I. INTRODUCTION
Cu–10Al–4Fe–4Ni alloy is the most widely used nickel–aluminum bronze (NAB) due to its excellent mechanical and wear resistant properties. Nevertheless, because of the variability of chemical composition, the diversity of the manufacture process, and the complex nature of phase transformation, various microstructures will exhibit, which results in different performances.Reference Gupta, Ghosh and Sinha1–Reference Kudashov, Zauter and Muller6 Hence, it is significant to investigate the phase transformation manners of Cu–10Al–4Fe–4Ni alloy under various conditions.
A series of complex NAB based on Cu-(8.9–9.37 wt%)Al-(4.38–5.09 wt%)Fe-(4.35–5.1 wt%)Ni was investigated by Jahanafrooz et al.Reference Jahanafrooz, Hasan, Lorimer and Ridley7 and Culpan and Barnby.Reference Culpan and Barnby8 In these literatures, the schematic representations of the precipitation sequence of NAB were proposed, all of which were proved to be quite similar. However, the precipitation temperatures of different precipitates change with chemical composition. Moreover, Sun et al.Reference Sun, Lorimer and Ridley9 also studied alloys based on Cu-(9.1–9.7 wt%)Al-(0.1–4.5 wt%)Ni in detail and proposed that the Al and the Ni contents had tremendous effects on the sensitivity of initial phase precipitation temperature, and β was more likely to form α + KIII than α + γ2.
As the latest special casting method with great potential, suction casting (SC) and centrifugal casting (CC) have many unique advantages, such as products with excellent mechanical performance, products with high quality of surface and geometric dimensions, low consumption of raw materials, energy saving, etc. These two methods have different ways to fill cast molds with molten metal, which causes various solidification conditions, thus influencing the mechanical properties of final products.
The present paper does a comparative study on effects of two different kinds of special casting processes, SC and CC, on microstructural development in Cu–10Al–4Fe–4Ni alloy with continuous cooling method to control the final mechanical properties during heat treatment or other hot working technologies.
II. EXPERIMENTAL PROCEDURE
Aluminum bronzes based on Cu–10Al–4Fe–4Ni were investigated, which were prepared by SC and CC, respectively. The ingots manufactured by SC and CC are normally to be hollow spindles. In some particular situations, SC can also be adopted to produce solid ingots. Although the ingots prepared by SC always contain more defects, including shrinkage porosity and coarse microstructure, all of which will result in the poor mechanical property eventually. The experiment samples in this paper were cutting from the external layer of large-size ingots according to practical application. Chips were taken from different parts of ingots for chemical analysis in IRIS 1000 ICP-AES, and the results are summarized in Table I, wherein, alloy 2 prepared via CC contains higher iron content. It is mainly because of the aggregation of the heavy metal elements (such as Fe and Ni) and the magnetism of Fe element, which makes it easier for these elements to be aggregated in the external layer of ingots.
Chemical composition of alloy 1 prepared by SC and alloy 2 prepared by CC (wt%).

Specimens with dimensions of 10 × 10 × 5 mm were kept at 1000 °C, extremely approaching the solidus, for 40 min. As the temperature was lowered gradually, the samples were successively quenched into water every 50 °C until the temperature reached 450 °C. During this process, the cooling rate achieved 10–50 °C/min. The microstructural developments of the alloys were characterized by technologies of optical microscope, x-ray diffraction, scanning electron microscope, transmission electron microscope (TEM), and analytical electron microscope equipped with energy dispersive spectrometer. The hardness (HBS5/750120) of the specimens in different stages was tested so that the trends and the changes can be exhibited clearly. The mixture aqueous solution with 2.5 pct ferric chloride and 12.5 pct hydrogen chloride was applied as the metallographic etchant.
III. RESULTS AND DISCUSSION
A. Microstructural development
According to the Cu–Al binary diagram and Cu-rich side of Cu–Al–Fe and Cu–Al–Ni ternary diagrams, the equilibrium microstructure of Cu–10Al–4Fe–4Ni alloy should be α + (α + γ2) + K. The microstructure of NAB mainly probably consists of α, β, KI, KII, KIII, β′, and γ2 phases. Wherein, α phase with an fcc crystal structure is based on copper-rich solution; β phase is based on Cu3Al solution and possesses a bcc crystal structure; and among four kinds of K phases, the numbers are determined by the order of precipitation. KI precipitates from the original liquid first, rich in iron and based on AlFe3 mostly, possessing a bulk shape or a rosette shape and being more likely to be rosette shaped; KII precipitates at a relatively high temperature, also rich in iron and based on AlFe3, possessing a morphology similar to KI, but the size is smaller and is more likely to be quasisphere shaped; KIII is lamellar or globular eutectoidal decomposition product, lying among the grain boundaries and being based on NiAl. As the temperature decreases, KIV shows up in α phase, which contains high iron content, possesses a relatively small size and is based on AlFe3. It is widely accepted that the KI, KII, and KIV precipitates are rich in iron and based on AlFe with the DO3 structure. The KIII phase is rich in aluminum and nickel and based on NiAl with the B2 structure. The morphology, the size, the location, and the composition are the main key factors to judge the kinds of K phases. The β′ is essentially martensite, and γ2 is based on Al4Cu9 with a complex crystal structure.Reference Recarte, Perez-Saez, San Juan, Bocanegra and No10–Reference Chen, Liang, Zhang, Zhang, Luo and Li16 The allotropic transformation from β to β′ takes place as the temperature drops from a high point to a relatively low range rapidly.
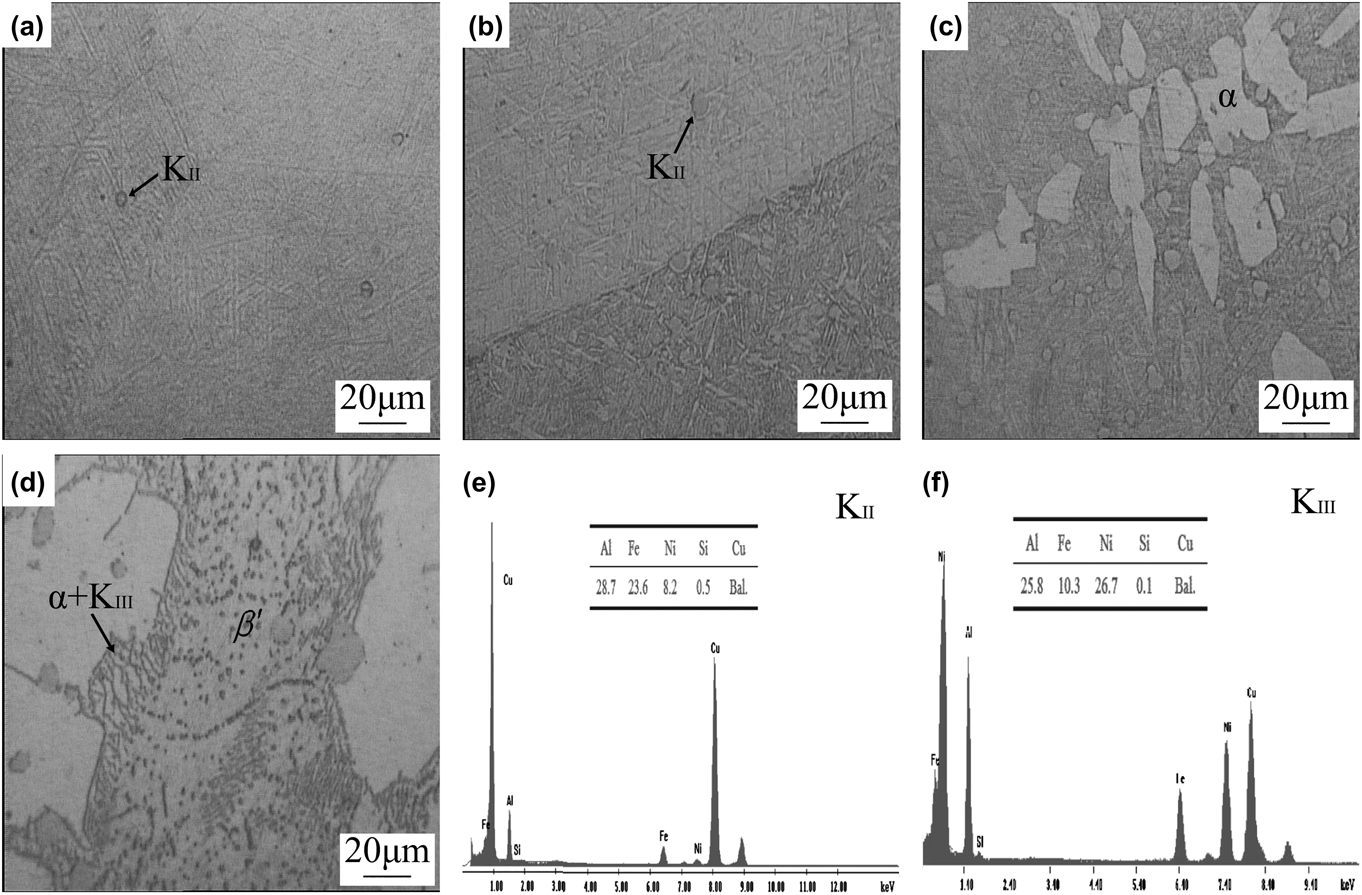
Typical stages of microstructural development of alloys 1 and 2 continuously cooled from 1000 °C are exhibited in Figs. 1 and 2, respectively. With the aid of energy spectrum analysis (EDS) [Figs. 1(e) and 1(f)], the microstructure of alloy 1 was investigated. And it is confirmed to be made up of β and a few KII particles at initial high temperature 1000 °C [Fig. 1(a)]. The quantity of KII increases gradually and continuously as the temperature decreases. At about 850 °C, light-etching α precipitated from original β region, but its subsequent coarsening is impeded by KII as shown in Fig. 1(c). On further cooling, the eutectoid decomposition of β into α + KIII initiates at α/β boundaries at about 750 °C. However, the reaction cannot be completed under normal cooling condition, and finally, the remnant β transforms to martensite β′. The microstructure of the specimen quenched from 450 °C is extremely similar to as-cast alloy, named as quasicast. Apparently, only α, KII, KIII, and β′ phases present in the quasicast microstructure of alloy 1, and there is no KI and KIV phases present compared with the results investigated by Jahanafrooz et al.Reference Jahanafrooz, Hasan, Lorimer and Ridley7 on a set of NAB with a range of Al content from 9.0% to 9.4%.
Typical stages of microstructural development of alloy 1 prepared via SC at (a) 1000 °C, (b) 950 °C, (c) 850 °C, and (d) 750 °C and the EDS of (e) KII and (f) KIII.
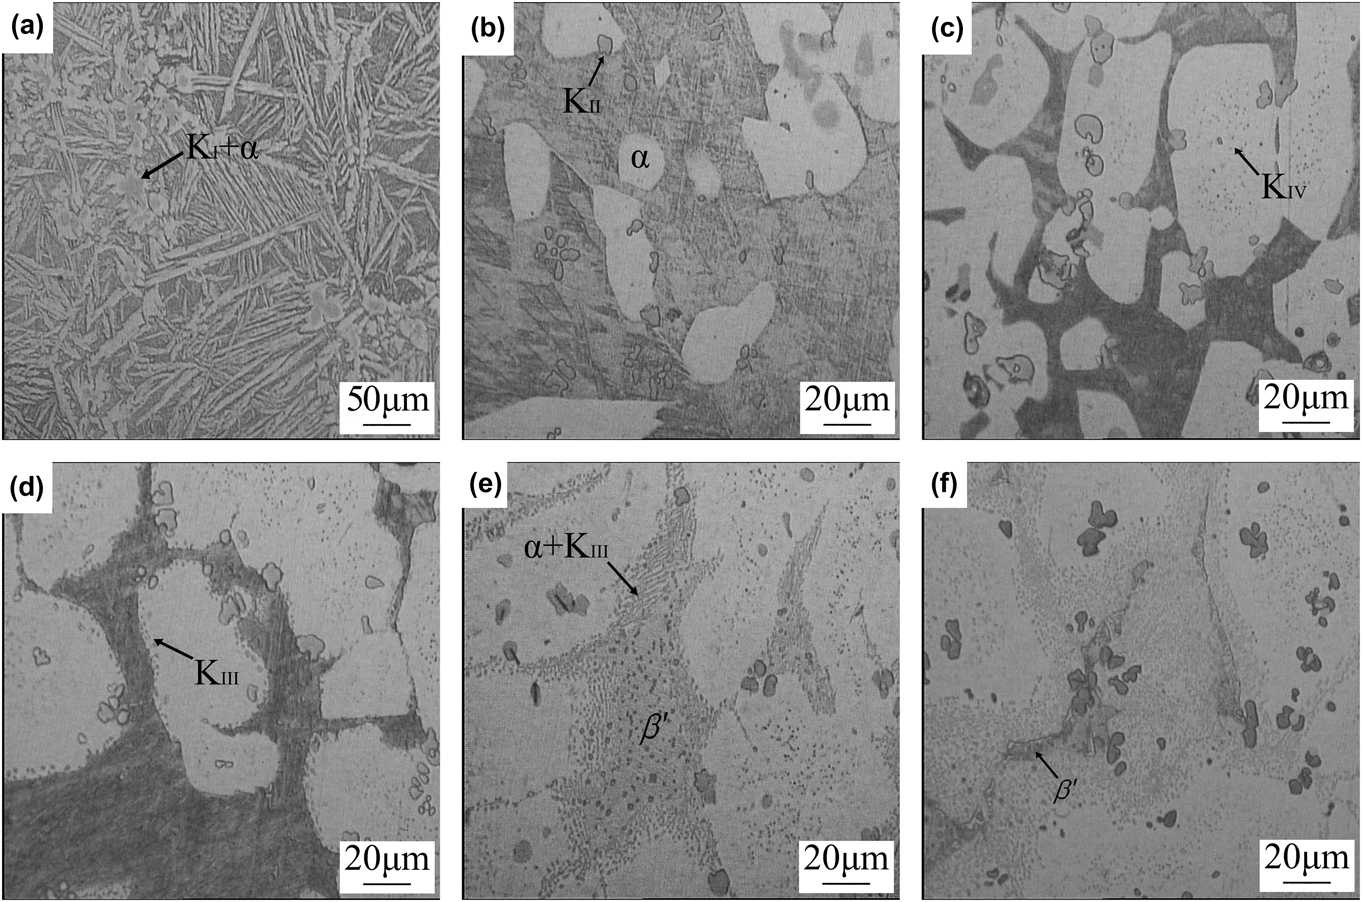
Typical stages of microstructural development of alloy 2 prepared via CC at (a) 1000 °C, (b) 950 °C, (c) 850 °C, (d) 800 °C, (e) 750 °C, and (f) 450 °C.
As illustrated in Fig. 2, α phase, most of which are in lamellar shape, and KI particles are observed in alloy 2 at 1000 °C. KI particles can act as the nucleation center of α in the subsequent solidification. When the temperature dropped to 950 °C, KII particles precipitate from the original β region and hinder the growth of α phase, similar to alloy 1. KIV starts to appear in the center of α at 850 °C. Previous literatureReference Jahanafrooz, Hasan, Lorimer and Ridley7 revealed that the region in β, where α first got observed, was always to be the area that KIV chose to appear mainly due to the high amount of iron, which makes it the first region to reach the solubility limit of iron as the temperature continuously decreases. Figure 2(e) illustrates that the eutectoid (α + KIII) seems to be in lamellar or globular shape, and the reaction initiates at the α/β interface and grows into the β regions. In addition, a few initially formed particles of KIII are globular, whereas most of the subsequent KIII in eutectoid (α + KIII) are lamellar. In a word, the microstructure of quasicast alloy 2 consists of α, β′, KI, KII, KIII, and KIV, which is extremely similar to the results investigated by Jahanafrooz et al.,Reference Jahanafrooz, Hasan, Lorimer and Ridley7 Culpan and Barnby,Reference Culpan and Barnby8 etc.
As shown in Fig. 3, the morphology of phases mentioned above was determined by TEM, and the orientation relationship between α and KIII was studied by electron diffraction. According to the thermodynamic principles of phase transformation and considering the driving force required,Reference van der Heide, Stam, Giraud, Lovato, Akdut, Clarysse, Caenen and Heikilla12 the phase interface/grain boundary is always chosen to be the habit precipitation point of phases. Hence, β′ precipitated from the phases interface/grain boundary and then extend into β as shown in Fig. 3(a); in this way, the interface energy can be reduced. The solid solubility of Fe was so sensitive to temperature variation that a sharply quench would lead to tremendous decline of the solubility, resulting in KII particles [Fig. 3(b)] precipitated from β when the temperature dropped from a high point.
TEM micrographs taken along [011]α zone axis showing the morphology of (a) β′ martensite (b) KII (c) α + KIII eutectoid, and (d, e) electron diffraction pattern taken from α + KIII eutectoid exhibits the K–S orientation relationship between α and KIII: ( $00\overline 2$)α‖(
 $00\overline 2$)KIII; [
 $1\overline 1 0$]α‖[
 $1\overline 1 0$]KIII (●KIII hkl, ○αhkl).
A fine lamellar aligned product (α + KIII) was formed from the eutectoid reaction β → α + KIII as shown in Fig. 3(c). The electron diffraction pattern [Figs. 3(d) and 3(e)] of the eutectoid which is composed of fcc α and bcc KIII shows a K–S orientation relationship: [ $1\overline 1 0$]α‖[
 $1\overline 1 0$]KIII; (
 $00\overline 2$)α‖(
 $002$)KIII. With the increase of the distance away from the interface, the nucleation work of eutectoid transformation needs to be raised, which means that it is more and more difficult for the eutectoid reaction to initiate. Due to the principle of minimum energy,Reference van der Heide, Stam, Giraud, Lovato, Akdut, Clarysse, Caenen and Heikilla12 the fine lamellar α + KIII eutectoid will roughen immediately to reduce the free energy of the whole system as soon as it precipitates.
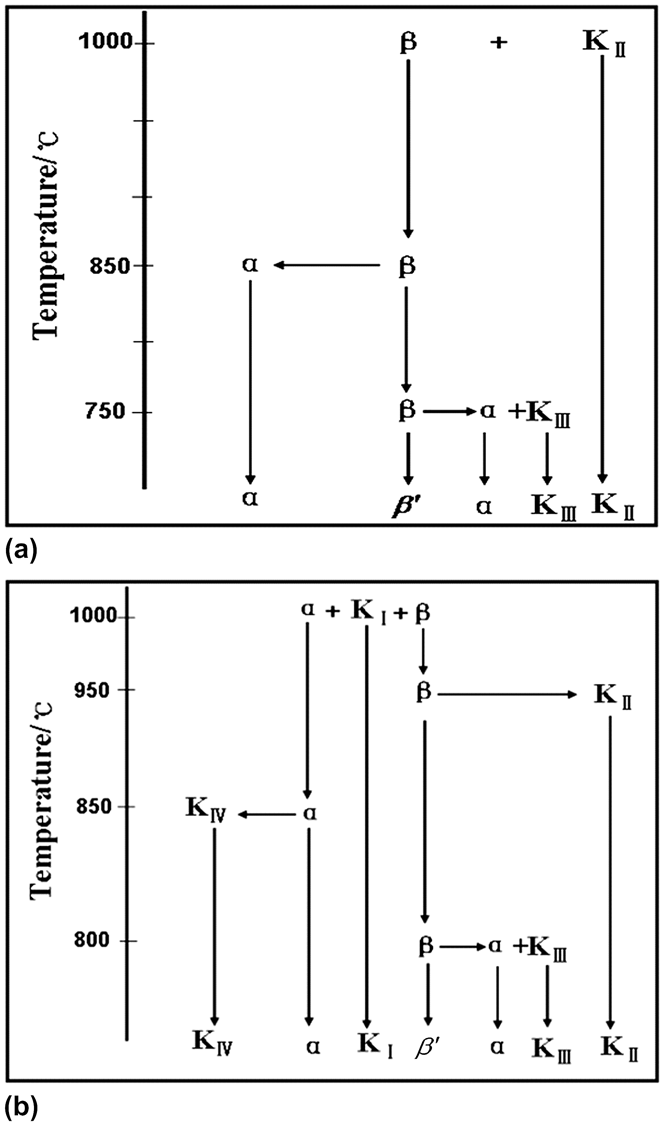
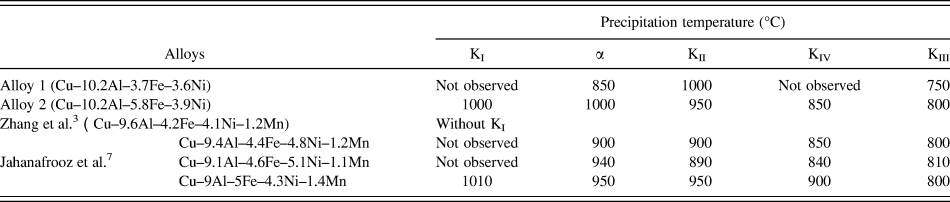
The schematic representations of the precipitation sequence of alloys 1 and 2 are shown in Fig. 4, and the precipitation temperatures of various phases are listed in Table II. It is evident that the types, precipitation sequences, and initial precipitation temperatures of phases are quite different in the final alloys prepared via SC and CC processes. And the typical characteristics of phase transformation for alloy 1 are quite different from the original investigation by Jahanafrooz et al.,Reference Jahanafrooz, Hasan, Lorimer and Ridley7 etc.
Schematic representations of the sequence of microstructural development of (a) alloy 1 and (b) alloy 2.
Initial precipitation temperature of various phases.
KI can be observed in alloy 2, but unfortunately, it cannot be found in alloy 1 and Cu–9.6Al–4.2Fe–4.1Ni–1.2Mn alloy prepared by Zhang et al.,Reference Zhang, Chen, Zhang and Luo3 which has been confirmed to be related to the Fe/Ni ratio according to the researches completed by Jahanafrooz et al.Reference Jahanafrooz, Hasan, Lorimer and Ridley7 For further details, only when Fe/Ni ratio becomes higher than 1, will KI turn up in the matrix, and the higher this value becomes, the more possible for KI to be observed. Actually, alloy 2 has an eligible Fe/Ni ratio exactly listed in Table I. In metallographic photos, KI is so easy to be corroded that it always presents as dark etched. In the bending test of as-cast nickel–aluminum examined by Culpan and Barnby,Reference Culpan and Barnby8 it was discovered that cracks always started from microinterface in the microstructure and then developed along or through KI. As a consequence, KI particles would be separated into two parts existing in each side of the broken pieces. The existence of KI had an enormous negative influence on the mechanical and corrosion-resistance properties. So it is vital to control the content of Fe and the ratio of Fe/Ni properly. Furthermore, KIV cannot be observed in alloy 1 possibly due to the reasons as follows: at first, the range of the precipitation temperature of KIV is too narrow and the cooling rate is too fast for the particles to precipitate. Moreover, it is probably also related to the Fe content and the Fe/Ni ratio. During the microstructural development of alloy 1, there were some phenomena that do not coincide with those available results in previous literatures, such as KII appearing prior to α and the delayed appearance of α phase, thus requiring further research in the future.
B. Trends of microhardness
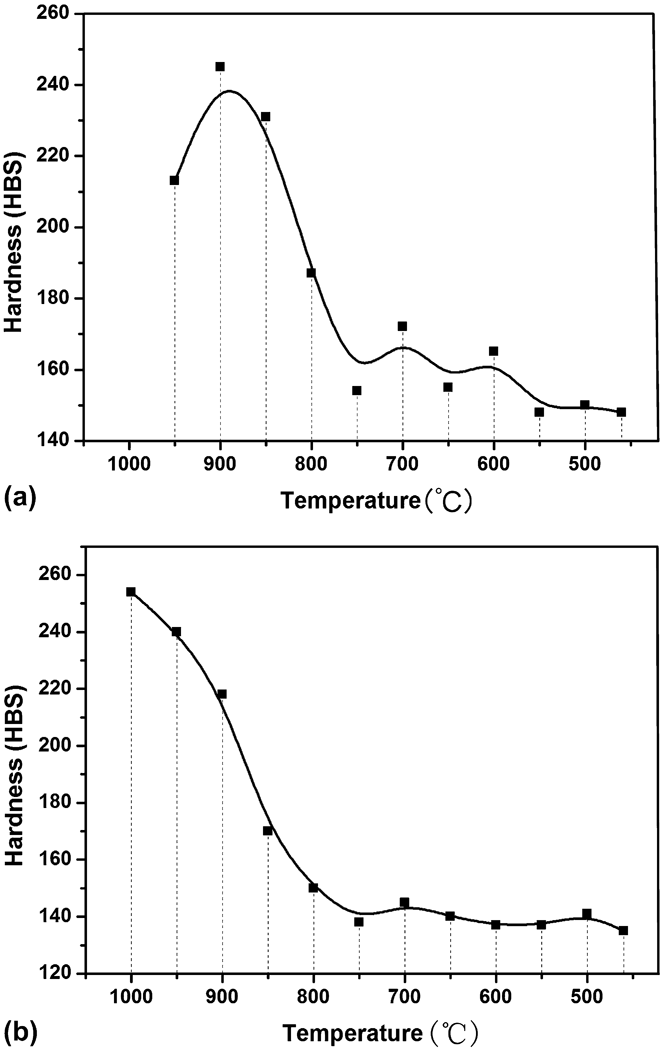
The trends of microhardness at every stage during continuous cooling are briefly described as curves shown in Fig. 5. Both curves show a rapid decrease at 900 °C and reach a smooth platform finally. The decrease of hardness is due to the raise of the amount of soft α-phase as the temperature decreases. In terms of alloy 1, unexpectedly, when the temperature is higher than 900 °C, the value of the microhardness is lower than that of 900 °C. The data of 1000 °C could not be collected owing to the microcrack observed during the hardness test. Obviously, alloy 1 is extremely frangible between 950 and 1000 °C due to the present of β′ martensite and a small amount of K-phase [Figs. 1(a) and 1(b)] in this temperature range, both of which would be the crack source and paths for cracks propagation. From the figures, we can also get some information concluded as follows: when the temperature gets low enough, the as-quenched microstructures of both alloy 1 and alloy 2 stay stabilized. Additionally, the critical points should be 750 and 800 °C for alloy 1 and alloy 2, respectively, which is coincident with the precipitation temperature of KIII phase. Obviously, β → α + KIII eutectoid reaction has no significant contribution to the microharness.
Trends of microhardness of (a) alloy 1 and (b) alloy 2 at every stage during continuous cooling.
In brief, SC and CC processes are quite similar in the terms of solidification of the melt, whereas, the small distinction between them refers to the cooling rate. The original reason resulting in immense distinction in the precipitation temperatures of the phases between the two kinds of alloys is confirmed to be the differences of Fe contents, which basically due to the various casting mechanisms involved in these casting methods.
IV. CONCLUSIONS
The major conclusions obtained from this investigation are as follows:
(1) The types, precipitation sequences, and initial precipitation temperatures of phases in the alloys are quite different. Quasicast structure via SC consists of α, β′, KII, and KIII, precipitating in a sequence of KII → α → KIII, and the initial precipitation temperatures are 1000, 850, 750 °C, respectively. However, KI and KIV are observed in the quasicast structure via CC, and the precipitation sequence is spotted as α + KI → KII → KIV → KIII.
(2) Initial precipitation temperatures via CC are relatively higher than that via SC, especially for α phase.
(3) With the decrease of the quenching temperature, the hardness of both alloys shows a tendency of rapid decline followed by a stabilizing state. Furthermore, embrittlements will appear in samples via SC at a quenching temperature higher than 900 °C. It is found that the eutectoid decomposed (β → α + KIII) has no significant contribution to the hardness of the alloys.
ACKNOWLEDGMENTS
This research was supported by Key Laboratory of Nonferrous Metal Materials Science and Engineering, Ministry of Education, Central South University, China.