Introduction
Maternal depression during pregnancy occurs in up to 40% of pregnancies and is a strong predictor of post-partum depression and poorer self-reported health (Field, Reference Field2011). Maternal depression during pregnancy also has an impact on offspring health, increasing the risk of prematurity, low birth weight, and later attentional, emotional and behavioural problems (Field, Reference Field2011). Mood disorders are commonly attributed to disordered signalling by monoamines, notably serotonin, and/or glucocorticoid ‘stress’ hormones (Ressler & Nemeroff, Reference Ressler and Nemeroff2000; Gotlib et al. Reference Gotlib, Joorman, Minor and Hallmayer2008) and alterations in these pathways may underlie the link between maternal depression during pregnancy and adverse maternal/fetal outcomes. In support of this, extensive studies in animal models have demonstrated the important role of serotonin in fetal neurodevelopment (Velasquez et al. Reference Velasquez, Goeden and Bonnin2013) and have linked fetal glucocorticoid over-exposure with adverse outcomes (Cottrell & Seckl, Reference Cottrell and Seckl2009). Emerging studies in pregnant women diagnosed with mood disorders, or receiving treatment with selective serotonin reuptake inhibitors (SSRIs), are also consistent with a key role for serotonin pathways in fetal development (Oberlander, Reference Oberlander2012; Olivier et al. Reference Olivier, Akerud, Kaihola, Pawluski, Skalkidou, Högberg and Sundström-Poromaa2013), with effects persisting at least to childhood. Likewise, maternal depression during pregnancy has been associated with elevated mid-pregnancy corticotrophin-releasing hormone (Rich-Edwards et al. Reference Rich-Edwards, Mohllajee, Kleinman, Hacker, Majzoub, Wright and Gillman2008; O'Keane et al. Reference O'Keane, Lightman, Marsh, Pawlby, Papadopoulos, Taylor, Moore and Patrick2011) and cortisol levels (Field et al. Reference Field, Diego, Dieter and Hernandez-Reif2006, Reference Field, Diego, Hernandez-Reif, Figueiredo, Ascencio, Schanberg and Kuhn2008), with altered diurnal pattern of cortisol secretion in the second trimester (O'Keane et al. Reference O'Keane, Lightman, Marsh, Pawlby, Papadopoulos, Taylor, Moore and Patrick2011) and also with elevated neonatal cortisol levels (Field et al. Reference Field, Diego, Dieter and Hernandez-Reif2006). Indeed, the serotonin and glucocorticoid signalling systems interact, with glucocorticoids regulating serotonin synthesis, transport, re-uptake and neuronal receptor expression, whilst serotonin controls glucocorticoid receptor (GR) and mineralocorticoid receptor (MR) expression in the central nervous system (Wyrwoll & Holmes, Reference Wyrwoll and Holmes2012). Animal models point to critical windows of fetal vulnerability to exposure to depression, but whether this occurs in humans is not known.
Located at the maternal–fetal interface, the placenta is essential for normal growth and survival of the fetus during development and plays a vital role in regulating transfer of glucocorticoids and serotonin to the fetus. The placental enzyme 11β-hydroxysteroid dehydrogenase type 2 (HSD2) metabolizes 80–90% of active maternal cortisol to inactive cortisone, protecting the fetus from excess glucocorticoid exposure (Edwards et al. Reference Edwards, Benediktsson, Lindsay and Seckl1993). Other key players in regulating glucocorticoid action, including GR and MR, and 11β-hydroxysteroid dehydrogenase type 1 (HSD1), which catalyses the regeneration of active glucocorticoids, are expressed in placental tissue (Murphy et al. Reference Murphy, Smith, Giles and Clifton2006). The serotonin transporter (SLC6A4) mediates placental uptake of serotonin and the placenta is also able to synthesize serotonin from maternal tryptophan precursors (Bonnin et al. Reference Bonnin, Goeden, Chen, Wilson, King, Shih, Blakely, Deneri and Levitt2011). Thus environmental signals that influence serotonin transporter function have potential to make an impact on fetal brain development. A recent study showed that SLC6A4 expression was increased in placentas from women with untreated mood disorders and from women treated with SSRIs, compared with controls (Ponder et al. Reference Ponder, Salisbury, McGonnigal, Laliberte, Lester and Padbury2011). Both in the Ponder et al. (Reference Ponder, Salisbury, McGonnigal, Laliberte, Lester and Padbury2011) study and another smaller study (O'Donnell et al. Reference O'Donnell, Bugge Jensen, Freeman, Khalife, O'Connor and Glover2012), maternal depression was not associated with any significant changes in placental HSD2 expression. However, the history of depression during pregnancy in both of these studies was obtained retrospectively, either through review of delivery and/or antenatal health records (Ponder et al. Reference Ponder, Salisbury, McGonnigal, Laliberte, Lester and Padbury2011), which may be subject to recall bias or by questionnaire at time of elective Caesarean section which may be highly influenced by the current situation (O'Donnell et al. Reference O'Donnell, Bugge Jensen, Freeman, Khalife, O'Connor and Glover2012). We therefore hypothesized that placental expression of key genes involved in regulating placental serotonin and glucocorticoid transfer, metabolism and/or action would differ according to the weeks of gestation at which the mother experiences depressive symptoms. We tested this hypothesis in a prospective cohort of healthy pregnant women in whom symptoms of depression were assessed throughout pregnancy and from whom placental samples were collected at term.
Method
Study population
The participants were 56 healthy mothers with a singleton pregnancy, without obstetric complications, enrolled in the Prediction and Prevention of Preeclampsia (PREDO) Study (Villa et al. Reference Villa, Kajantie, Räikkönen, Pesonen, Hämäläinen, Vainio, Taipale and Laivuori2013). Recruitment and study design have been described in detail elsewhere (Villa et al. Reference Villa, Kajantie, Räikkönen, Pesonen, Hämäläinen, Vainio, Taipale and Laivuori2013; Räikkönen et al. Reference Räikkönen, O'Reilly, Pesonen, Kajantie, Villa, Laivuori, Hämäläinen, Seckl and Reynolds2014). None of the women was taking antidepressant or glucocorticoid therapy or had any history of prior psychiatric disease. The study protocol was approved by the ethical committees at the Helsinki and Uusimaa Hospital district and written informed consent was obtained from all participants.
Assessment of maternal mood
Maternal depressive symptoms were assessed at 2-week intervals throughout pregnancy from 12 to 14 weeks of gestation until delivery using the Center for Epidemiological Studies Depression Scale (CES-D) (Radloff, Reference Radloff1977). This scale consists of 20 questions addressing six symptoms of depression including depressed mood, feelings of guilt or worthlessness, helplessness or hopelessness, psychomotor retardation, loss of appetite, and sleep disturbance experienced during the preceding week. Each question is scored on a scale of 0–3 according to the frequency of the symptoms. The total CES-D scores range from 0 to 60 and a score ⩾16 indicates a high risk of depression. The CES-D was originally validated in the general population (Radloff, Reference Radloff1977) but has also been used extensively in studies assessing depressive symptoms among pregnant women (Nast et al. Reference Nast, Bolten, Meinlschmidt and Hellhammer2013).
Placental tissue sampling and gene expression
Two sets of nine-site biopsies were collected from the decidual side of the placenta using standard protocols, from women delivering at term (37 + 0 to 41 + 6 weeks +days of gestation) a maximum of 90 (mean 48.7, s.d. = 21.4) min after a vaginal (n = 43) or Caesarean (n = 13) delivery. The biopsies were put in RNA-later and stored at −20°C. Total ribonucleic acid (RNA) was extracted from placental tissue sampled from a central site using QIAGEN RNeasy mini kits (Qiagen Ltd, UK). The RNA concentration and purity of all samples were assessed using a Nanodrop ND-1000 spectrophotometer (Thermo Fisher Scientific, UK) and the integrity of RNA confirmed by separating ribosomal RNA (rRNA) using electrophoresis in a 1% agarose/0.5 × TBE (45 mm-Tris-borate, 1 mm-EDTA) gel with 0.1 μl/ml Gel Red (Biotium, USA) at about 90 V for 30–50 min. Complementary DNA (cDNA) synthesis was carried out using the Access RT-PCR (reverse transcriptase–polymerase chain reaction) system (Promega, UK). cDNA was incubated in triplicate with gene-specific primers and fluorescent probes either using the Universal Probe Library system from Roche Diagnostics Ltd (UK) for HSD1 (forward primer: caatggaagcattgttgtcg, reverse primer: ggcagcaaccattggataag) and MR (forward primer: tgggaattctgacttacttaacca, reverse primer: aatacaaaaagctgatgcagacc) or pre-designed assays from Applied Biosystems (USA) for GR HSD2 and SLC6A4 in Roche LightCycler 480 Probes Mastermix. PCR cycling and detection of fluorescent signal were carried out using a Roche LightCycler 480. A standard curve was constructed for each primer–probe set using a serial dilution of cDNA pooled from all samples. Results were corrected to the control gene TATA box binding protein (TBP).
Covariates and confounders
Sample time between birth and placental biopsy (min) was recorded by trained personnel taking the biopsies. Mode of delivery (vaginal v. elective/emergency Caesarean section), parity (primiparous v. multiparous), pre-pregnancy body mass index (BMI) (kg/m2), maternal age (years) at delivery, smoking status (yes/no; number of cigarettes per day) during pregnancy, gestation length (days) and infant birth weight (g) were derived from hospital birth records and the Finnish National Birth Register. Education level and alcohol consumption (number of drinks during the previous 4 weeks) during pregnancy were self-reported by questionnaire.
Statistical analyses
Data were analysed using SPSS version 21.0 (IBM, USA). The final sample size included all women with complete CES-D score data and RNA of sufficient quality to carry out the gene analyses. Gene expression data were log-transformed to account for non-normality. Associations between CES-D scores and messenger RNA (mRNA) levels of GR, MR, HSD1, HSD2 and SLC6A4 were tested using multiple linear regression analyses. First trimester (12 weeks) CES-D scores and second and third trimester-specific means (means of scores from weeks 14–26 and 28–38, respectively) of CES-D scores and mean of the first trimester and second and third trimester-specific mean scores were used as independent variables and gene mRNA levels as dependent variables (each tested in a separate model).
By using linear regression analyses, we also tested associations between CES-D scores at each measurement point across the whole pregnancy and tested if the number of times (0, 1, 2–3) of having a CES-D score above the clinical cut-off of ⩾16 (calculated from value at the first trimester and mean values across the second and third trimesters) was associated with gene mRNA levels. All analyses were adjusted for between-person covariates and confounders which we have previously shown to influence placental gene expression (Räikkönen et al. Reference Räikkönen, O'Reilly, Pesonen, Kajantie, Villa, Laivuori, Hämäläinen, Seckl and Reynolds2014) including maternal education, age, parity, BMI, smoking, alcohol intake, mode of delivery, time between delivery and biopsy, birth weight standard deviation score (by sex), gestation at delivery and infant sex. We standardized all continuous variables (mean = 0 and s.d. = 1) to facilitate interpretation of the findings. A p value of <0.05 was considered statistically significant.
Results
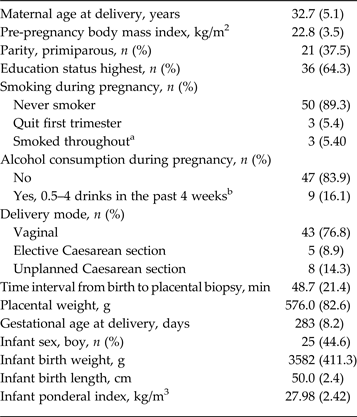
Table 1 shows the clinical characteristics of the participants. The mean CES-D scores at the first trimester and across the second and third trimesters were 9.2 (s.d. = 5.7), 9.2 (s.d. = 5.4) and 10.2 (s.d. = 6.1), respectively. The mean CES-D scores at each time point were significantly correlated (r = 0.66, 0.67 and 0.83, all p values <0.001) between the first trimester value and second trimester mean value, first trimester value and third trimester mean value, and second and third trimester mean values, respectively. CES-D scores ⩾16 were reported by nine (16.3%), seven (12.5%) and eight (14.7%) of the women at the first trimester, and across the second and third trimesters, respectively. The mean CES-D score across all three trimesters was not associated with maternal age, education, BMI, parity, smoking status, alcohol consumption, mode of delivery, time between birth and placental biopsy, birth weight standard deviation score, gestational age at delivery or infant sex.
Clinical characteristics of participants

Data are given as mean (standard deviation) unless otherwise indicated.
a 10–19 cigarettes per day, n = 1; <10 cigarettes per day, n = 1; <10 cigarettes per week or less often, n = 2.
b One drink refers to 330 ml of beer or cider (3.5–4.7% alcohol by volume), 120 ml of mild wine (7–16% alcohol by volume) or 80 ml of strong wine (15–22% alcohol by volume) or 40 ml of liquor (>22% alcohol by volume).
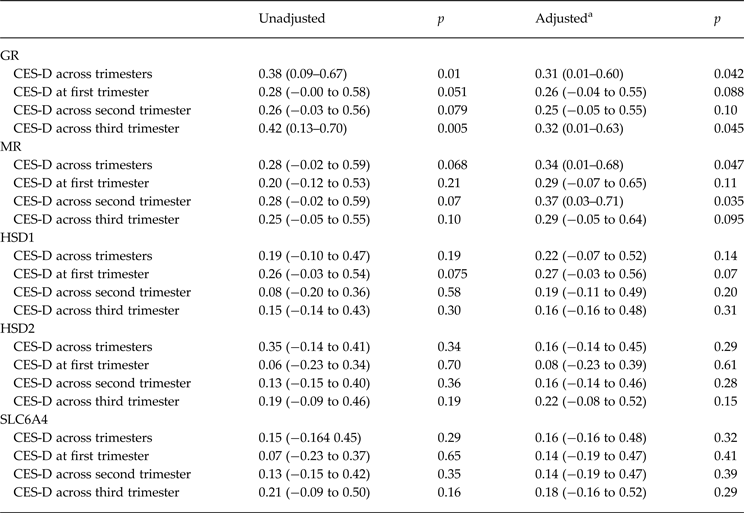
Table 2 shows that women who reported higher CES-D scores across the whole of pregnancy were more likely to have higher placental GR mRNA levels (p values = 0.01 and 0.042 in unadjusted and adjusted analyses, respectively), with a similar trend for higher MR levels (p values = 0.068 and 0.047 in unadjusted and adjusted analyses, respectively). CES-D scores were not significantly associated with HSD1, HSD2 or SLC6A4 (Table 2) (p > 0.14).
Associations between CES-D scores across trimesters and at each trimester and mRNA levels of GR, MR, HSD1, HSD2 and SLC6A4

Data are given as effect size in standard deviation units (95% confidence interval).
CES-D, Center for Epidemiological Studies Depression scale; mRNA, messenger ribonucleic acid; GR, glucocorticoid receptor; MR, mineralocorticoid receptor; HSD, 11β-hydroxysteroid dehydrogenase; SLC6A4, serotonin transporter.
a Adjusted refers to a model where adjustments were made for maternal education, age, parity, body mass index, smoking, alcohol intake, mode of delivery, time between delivery and biopsy, birth weight standard deviation score (by sex), gestation at delivery and infant sex.
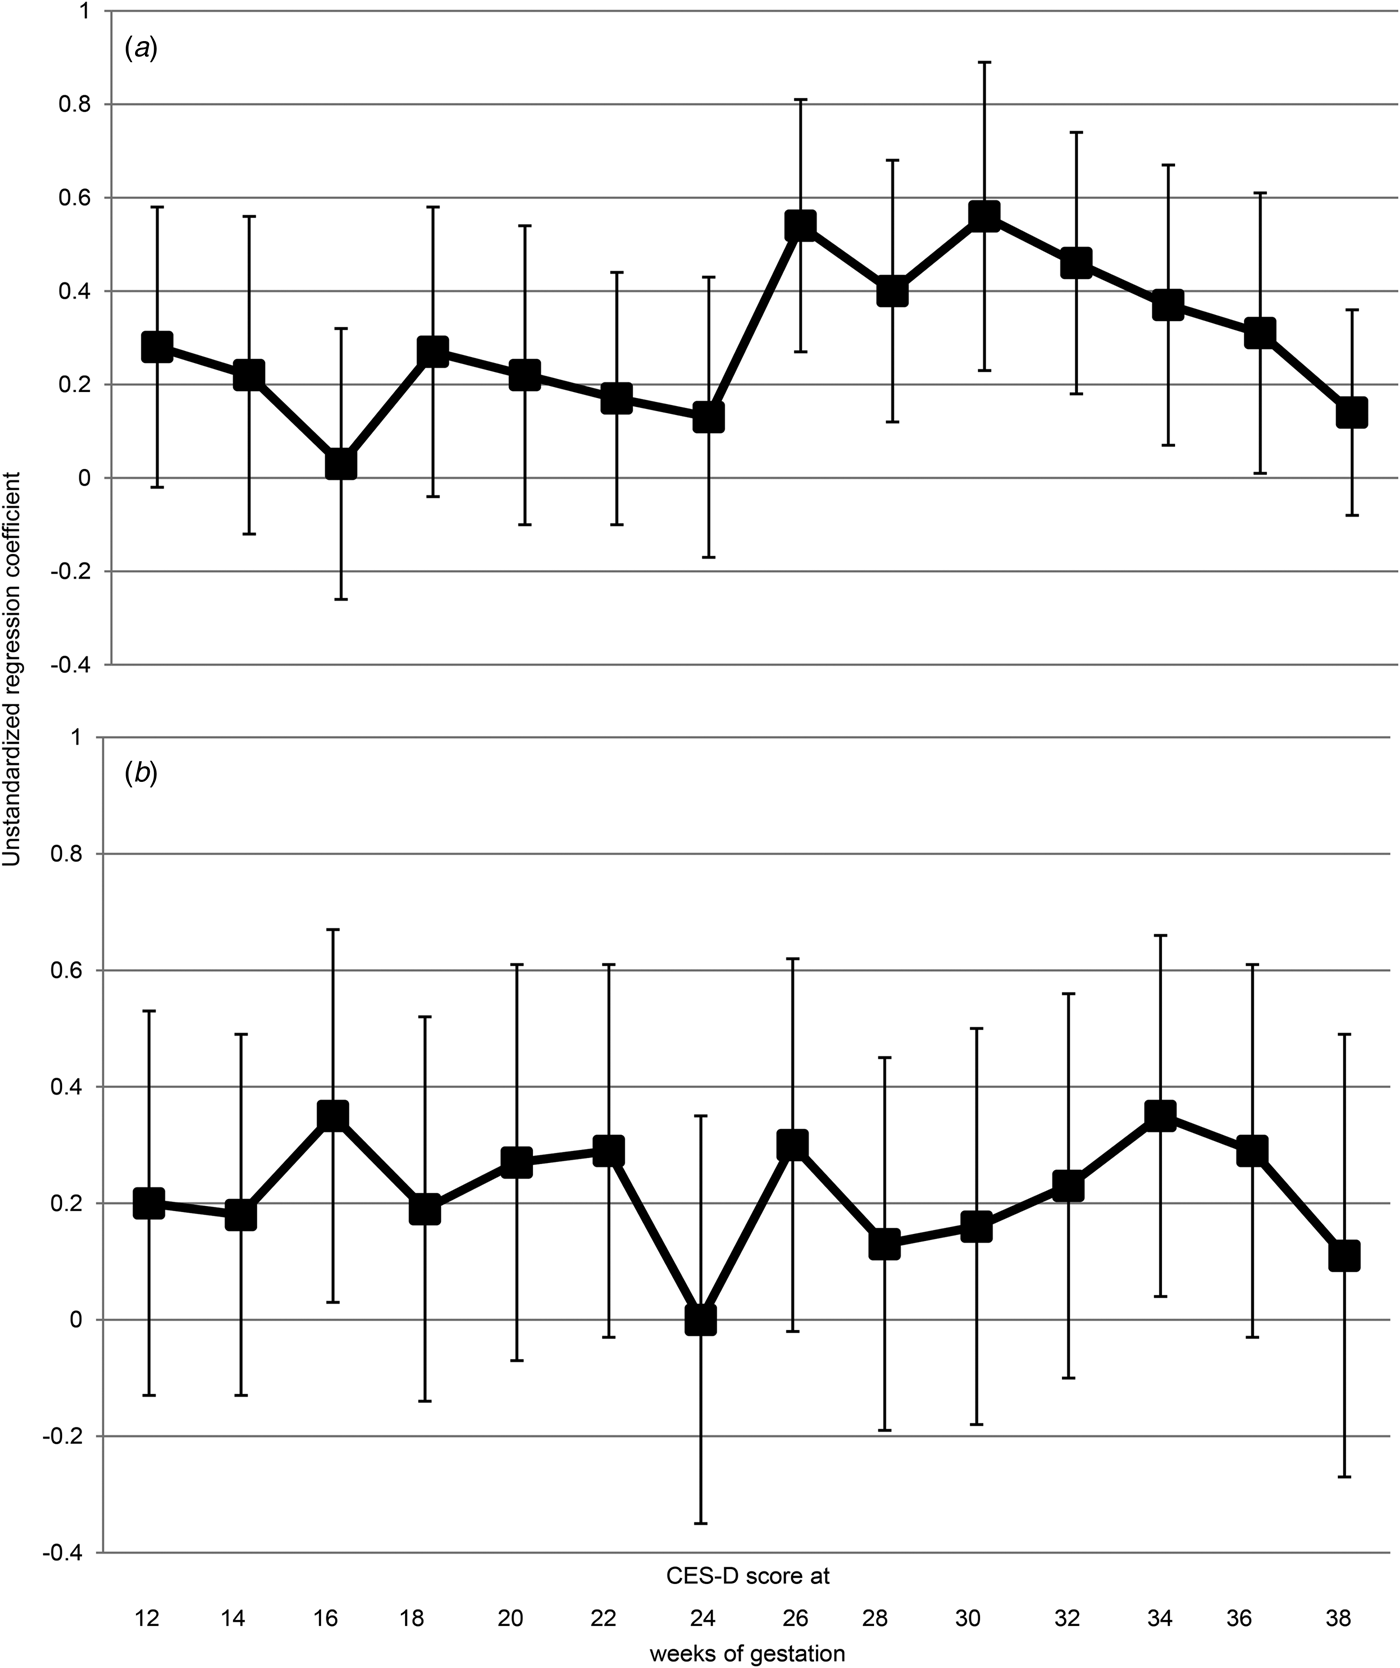
Figs 1 a and b show the gestation week-specific associations between depressive symptoms and the placental GR and MR mRNA levels. The associations with GR mRNA levels reached significance during the third trimester of pregnancy. The gestation week-specific associations with MR were significant with symptoms in the second trimester, with a similar trend for the third trimester.
Gestation week-specific associations between depressive symptoms and glucocorticoid receptor (GR) (a) and mineralocorticoid receptor (MR) (b) messenger ribonucleic acid (mRNA) levels in term placenta. Associations between Center for Epidemiological Studies Depression scale (CES-D) scores at each measurement point across the whole pregnancy and mRNA levels of GR and MR in term placenta were tested using multiple linear regression analyses. Error bars represent 95% confidence intervals.

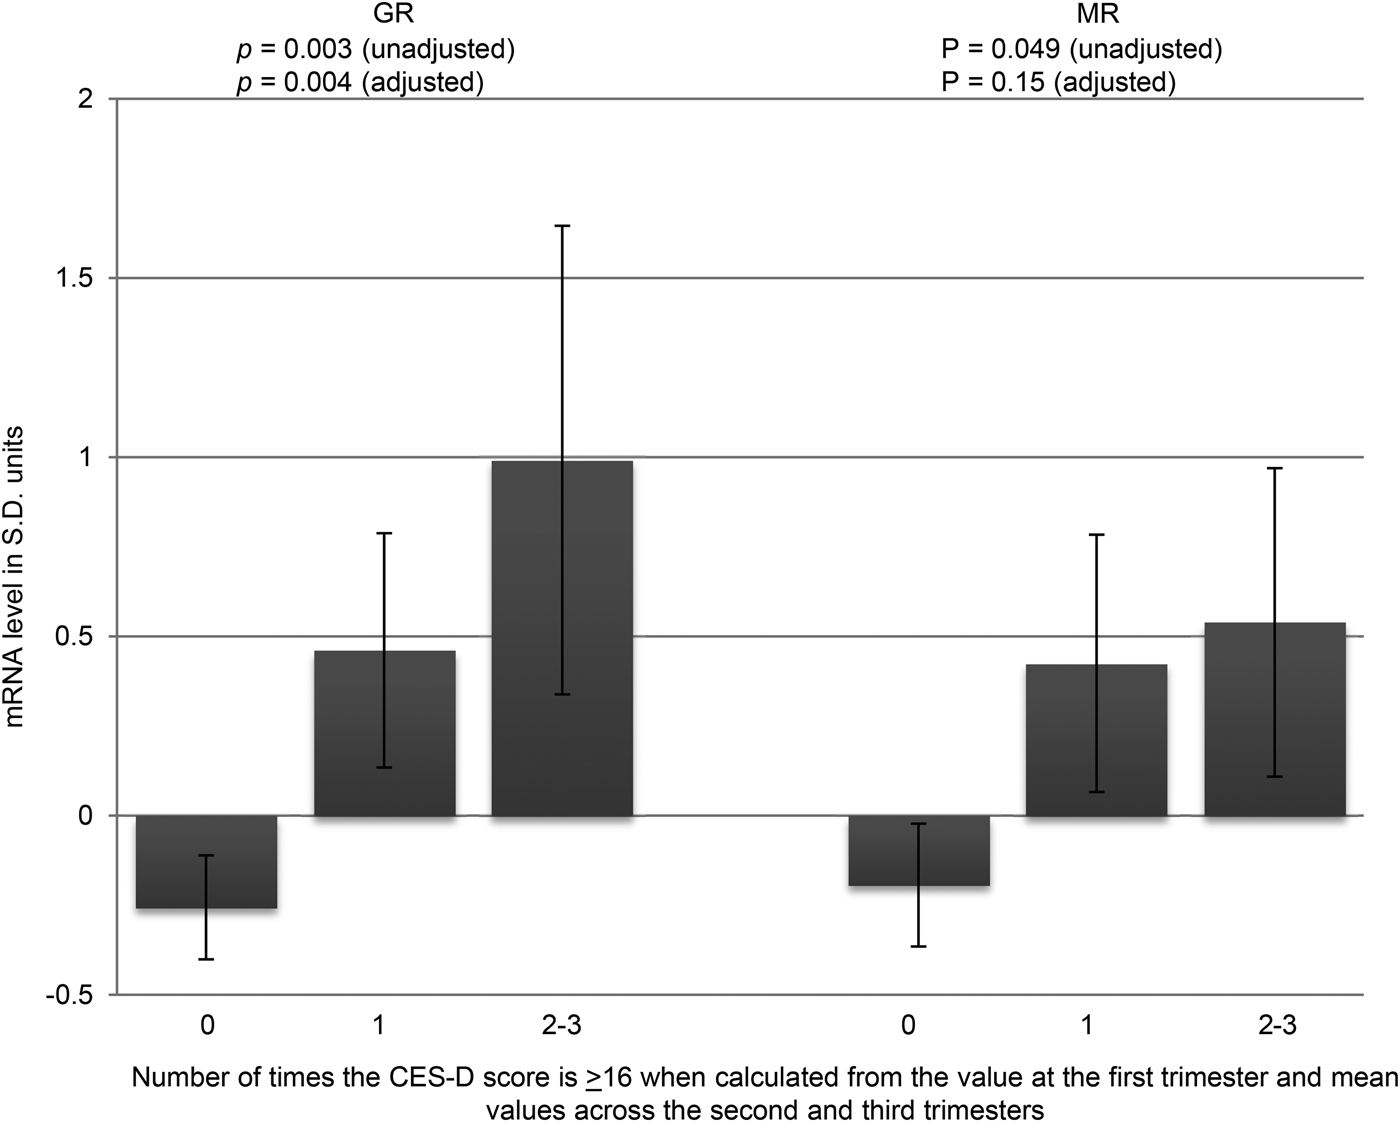
We also tested if the number of times of having high CES-D scores ⩾16 across trimesters was significantly associated with placental gene mRNA levels. Fig. 2 shows that GR and MR mRNA levels increased linearly by having depressive symptoms scores 0 (n = 40, 71.4%), 1 (n = 10, 17.9%) or 2–3 (n = 6, 10.7%) times above the clinical cut-off of CES-D ⩾16 (p values = 0.003 and 0.004 and 0.049 and 0.15 in unadjusted and adjusted analyses, respectively) at the first trimester and across the second and third trimesters.
Glucocorticoid receptor (GR) and mineralocorticoid receptor (MR) messenger ribonucleic acid (mRNA) levels in term placenta according to the number of times (0, 1, 2–3) depressive symptoms scores were above the clinical cut-off of Center for Epidemiological Studies Depression scale (CES-D) ⩾16 when calculated from the value at the first trimester and mean values across the second and third trimesters. p Value refers to a linear trend of having the CES-D score 0, 1 or 2–3 times above the clinical cut-off. CES-D ⩾16 0 (n = 40, 71.4%), 1 (n = 10, 17.9%) or 2–3 times (n = 6, 10.7%). Error bars represent standard errors of the mean. s.d., Standard deviation.

Finally, in a series of exploratory analyses we tested if infant sex moderated any of the above associations. We found no significant ‘sex × gene mRNA level’ interactions (p values > 0.05).
Discussion
Our results demonstrate that maternal depressive symptoms during pregnancy are associated with alterations in mRNA levels of key genes regulating fetal glucocorticoid exposure in term placenta. Maternal depressive symptoms throughout pregnancy are associated with increased expression of both GR and MR, thus increasing placental glucocorticoid sensitivity, at least at term. The prospective study design with 2-weekly assessment of depressive symptoms from 12 weeks of gestation allowed us to investigate both gestation-specific and the cumulative effect of experiencing depressive symptoms throughout pregnancy on term placental gene expression.
Studies showing dysregulation of the maternal hypothalamic–pituitary–adrenal axis in women with depression during pregnancy (Field et al. Reference Field, Diego, Dieter and Hernandez-Reif2006, Reference Field, Diego, Hernandez-Reif, Figueiredo, Ascencio, Schanberg and Kuhn2008; Rich-Edwards et al. Reference Rich-Edwards, Mohllajee, Kleinman, Hacker, Majzoub, Wright and Gillman2008; O'Keane et al. Reference O'Keane, Lightman, Marsh, Pawlby, Papadopoulos, Taylor, Moore and Patrick2011) suggest the potential for the developing fetus of a depressed mother to be exposed to excess maternal glucocorticoids during gestation. Yet there are only weak, if any, associations between less severe maternal anxiety and depressive symptoms and maternal cortisol levels (O'Donnell et al. Reference O'Donnell, O'Connor and Glover2009) and in accord with other published studies we found no significant associations between placental HSD2 mRNA levels and maternal depressive symptoms (Ponder et al. Reference Ponder, Salisbury, McGonnigal, Laliberte, Lester and Padbury2011; O'Donnell et al. Reference O'Donnell, Bugge Jensen, Freeman, Khalife, O'Connor and Glover2012). Our findings of increased placental mRNA levels of both GR and MR in women with depressive symptoms throughout pregnancy suggest an alternative mechanism for increased fetal glucocorticoid exposure, adding placental glucocorticoid sensitivity as a novel process potentially leading to fetal glucocorticoid overexposure in women with depression during pregnancy. Indeed, for women with depression scores indicating a high risk of clinical depression, there was a cumulative effect of experiencing depressive symptoms in all three trimesters on expression of GR and MR. It is recognized that there are critical windows during gestation when the developing fetus may be particularly vulnerable to in utero exposures (Räikkönen et al. Reference Räikkönen, Pesonen, Roseboom and Eriksson2012). For example, the third trimester has been shown to be a vulnerable time when maternal mental state and cortisol levels are linked to later offspring outcome (Yehuda et al. Reference Yehuda, Engel, Brand, Seckl, Marcus and Berkowitz2005). These findings suggest that maternal mood earlier in pregnancy can also influence fetal glucocorticoid exposure and outcome.
We found no associations between depressive symptoms in pregnancy and placental SLC6A4 expression, in contrast to the only previous published study (Ponder et al. Reference Ponder, Salisbury, McGonnigal, Laliberte, Lester and Padbury2011). However, in the latter study placental SLC6A4 expression was increased in women with clinically diagnosed mood disorders or on treatment with SSRIs compared with controls (Ponder et al. Reference Ponder, Salisbury, McGonnigal, Laliberte, Lester and Padbury2011). The participants in our study were otherwise healthy women and so probably more comparable with the controls in the other study.
The mechanisms through which maternal depressive symptoms influence placental gene expression are unknown. Epigenetic modifications are a potential candidate, as DNA methylation is a vital process for normal placental development and function (Hogg et al. Reference Hogg, Price, Hanna and Robinson2012; Novakovic & Saffery, Reference Novakovic and Saffery2012). Studies are emerging reporting changes in placental DNA methylation in association with adverse early-life environmental conditions such as altered maternal mood (Reynolds et al. Reference Reynolds, Jacobsen and Drake2013). The studies investigating whether maternal depression in pregnancy influences fetal DNA methylation have mainly focused on the use of DNA extracted from cord blood as a window on fetal development. Thus prenatal exposure to maternal depression has been associated with decreased methylation in umbilical cord leucocytes of SLC6A4 (Devlin et al. Reference Devlin, Brain, Austin and Oberlander2010) and increased methylation at the exon 1F promoter of NR3C1 (GR) in cord blood (Oberlander et al. Reference Oberlander, Weinberg, Papsdorf, Grunau, Misri and Devlin2008; Hompes et al. Reference Hompes, Izzi, Gellens, Morreels, Fieuws, Pexsters, Schops, Dom, Van Bree, Freson, Verhaeghe, Spitz, Demyttenaere, Glover, Van den Bergh, Allegaert and Claes2013). Whether these findings are causal, or a response to the adverse intra-uterine environment, or are secondary to the changes in growth that occur in a fetus subject to an adverse intra-uterine environment is unknown; whether these findings are modifiable is also unknown. The recent observation linking altered methylation in placenta of both NR3C1 (GR) and HSD2 in women with depression or anxiety with infant neurobehaviour (Conradt et al. Reference Conradt, Lester, Appleton, Armstrong and Marsit2013) suggests further follow-up of the infants in our study is warranted.
A major strength of our study is the prospective design and the use of repeated assessment of depressive symptoms throughout pregnancy, using a scale that has been extensively used in pregnancy (Nast et al. Reference Nast, Bolten, Meinlschmidt and Hellhammer2013). This allowed us to examine whether different windows of exposure to depression influenced placental gene levels and contrasts with previous studies using a retrospective design and a less detailed assessment of depressive symptoms (Ponder et al. Reference Ponder, Salisbury, McGonnigal, Laliberte, Lester and Padbury2011; O'Donnell et al. Reference O'Donnell, Bugge Jensen, Freeman, Khalife, O'Connor and Glover2012). In addition, due to the detailed characterization of participants, we were able to adjust for several important confounding factors in our analyses including maternal education, age, parity, BMI, smoking, alcohol intake, mode of delivery, time between delivery and biopsy, birth weight, sex and gestation at delivery. Limitations of our study include the small sample size, though this was comparable with other studies in pregnant women (Oberlander et al. Reference Oberlander, Weinberg, Papsdorf, Grunau, Misri and Devlin2008; Devlin et al. Reference Devlin, Brain, Austin and Oberlander2010; O'Donnell et al. Reference O'Donnell, Bugge Jensen, Freeman, Khalife, O'Connor and Glover2012; Hompes et al. Reference Hompes, Izzi, Gellens, Morreels, Fieuws, Pexsters, Schops, Dom, Van Bree, Freson, Verhaeghe, Spitz, Demyttenaere, Glover, Van den Bergh, Allegaert and Claes2013). We acknowledge that significant differences in HSD1, HSD2 or SLC6A4 mRNA levels may not have been detectable due to this small sample size. We included a random healthy sample of women from a larger cohort study of pregnant women, and these women are representative of other Finnish pregnant women (Villa et al. Reference Villa, Kajantie, Räikkönen, Pesonen, Hämäläinen, Vainio, Taipale and Laivuori2013; Räikkönen et al. Reference Räikkönen, O'Reilly, Pesonen, Kajantie, Villa, Laivuori, Hämäläinen, Seckl and Reynolds2014). Placental samples were collected a maximum of 90 min after delivery in order to minimize RNA degradation and maximize RNA integrity, whereas others included a sampling window of up to 3 h post-delivery (Ponder et al. Reference Ponder, Salisbury, McGonnigal, Laliberte, Lester and Padbury2011).
Conclusions
In conclusion, our findings offer potential gestational age-specific mechanisms linking maternal depressive symptoms during pregnancy via placental biology. Further studies are needed to test whether these also link with adverse offspring outcomes. The observation that maternal depression during pregnancy is associated with changes in genes related to glucocorticoid sensitivity is novel. The knowledge that there are cumulative effects of experiencing depressive symptoms throughout pregnancy on placental gene expression will be useful in the design of early intervention studies in women with depression during pregnancy.
Acknowledgements
The study was supported by the Academy of Finland (K.R, E.K., A.-K.P., H.L.), the Signe and Ane Gyllenberg Foundation (K.R., E.K., A.-K.P., H.L.), the Emil Aaltonen Foundation, EVO (a special state subsidy for health science research) (E.K., H.L., P.M.V., E.H.), the Finnish Medical Foundation (E.K., H.L., P.M.V.), the Jane and Aatos Erkko Foundation (H.L.), the Novo Nordisk Foundation (E.K.), the Päivikki and Sakari Sohlberg Foundation (E.K., H.L.), the Sigrid Juselius Foundation (E.K.), University of Helsinki Research funds (K.R., A.-K.P.) and the Sir Jules Thorn Charitable Trust (R.M.R.).
Declaration of Interest
None.