


Background
Hutchinson–Gilford progeria syndrome is an ultrarare premature ageing disease with a prevalence of 1 in 20 million Reference Merideth, Gordon and Clauss1 and is due to the aberrant splicing of the lamin A gene, resulting in the accumulation of a toxic isoform called progerin in tissues which leads to cellular dysfunction and stiffening. Reference Gonzalo and Kreienkamp2
Typical clinical appearance includes very short stature, underweight, total alopecia, lipodystrophy, sclerodermoid skin, skeletal dysplasia, and decreased joint mobility, as in the elderly. Life expectancy does not normally exceed 14 years, with myocardial infarction caused by premature atherosclerosis being the leading cause of death. Reference Merideth, Gordon and Clauss1
With only 107 known living patients worldwide, basic knowledge about the cardiovascular complications of progeria has come from post-mortem studies, which means that the natural history of cardiac involvement is not fully understood. Reference Prakash, Gordon and Kleinman3
We hope to add some insights on this subject by describing the cardiovascular manifestations of one of the oldest living patients with Hutchinson–Gilford progeria syndrome and by briefly discussing the current therapeutic options.
Case report
A 23-year-old female with Hutchinson–Gilford progeria syndrome followed up at our department presented with progressive shortness of breath during ordinary activities (NYHA functional capacity II-III) and a recent episode of chest pain. The patient was already medicated for systemic hypertension and dyslipidaemia.
She had the typical external appearance of a patient with progeria, with a body weight of 12 kg and height of 107 cm (body mass index of 10.5Kg/m2, less than the third percentile). A grade IV/VI systolic ejection murmur heard best at the aortic area, and radiating to the carotid arteries with a thrill was evident on physical examination; no signs of congestive heart failure were found.
The 12-lead electrocardiogram showed left ventricular hypertrophy with a strain pattern and ST segment depression without pathological Q waves in inferior and lateral leads.
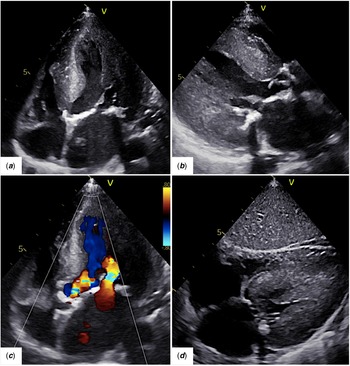
The transthoracic echocardiogram with continuous wave Doppler interrogation revealed severe aortic stenosis with a mean pressure gradient of 80mmHg and an indexed aortic valve area of 0.3cm Reference Gonzalo and Kreienkamp2 /m2; moderate aortic regurgitation with a pressure half-time of 400ms; and moderate mitral stenosis with mitral valve mean inflow pressure gradient of 5mmHg. There was concentric left ventricle hypertrophy (left ventricular end-diastolic septal thickness of 12 mm [Z score +14] and posterior wall of 14 mm [Z score +18]) Reference Sluysmans and Colan4 with good systolic function (left ventricle ejection fraction = 73%) without regional wall abnormalities. Diastolic function was altered suggesting increased left ventricular diastolic pressure with severe left atrium enlargement (Fig 1).
( a ) 2D echocardiogram, parasternal 4-chamber view shows increased echogenicity of the mitral leaflets, mitral annulus, and papillary muscles translating the severe calcification of these structures; chordae tendineae were also thickened and shortened. ( b ) 2D echocardiogram, parasternal long-axis view shows a severely concentrically hypertrophied left ventricle (LV) in diastole. LV end-diastolic septal thickness is 12mm (Z score* +14), LV end-diastolic posterior wall is 14 mm (Z score* +18), LV mass is 224 g (Z score* +9); the left atrium (LA) is markedly enlarged with an indexed volume of 44 ml/m2 (Z score* +4.8); there is an inhomogeneous increase in echo density of the aortic and mitral annulus with thickening of the leaflets and impaired motion; the aortic orifice is severely stenotic. ( c ) 2D echocardiogram with colour Doppler study, parasternal long-axis view, shows the limited opening of both mitral valve and aortic valve with increased turbulence across these structures. ( d ) 2D echocardiogram, subcostal 4-chamber view, shows the markedly LV hypertrophy in systole. *Z scores using previously published normative data from the echocardiography laboratory at Boston Children’s Hospital.

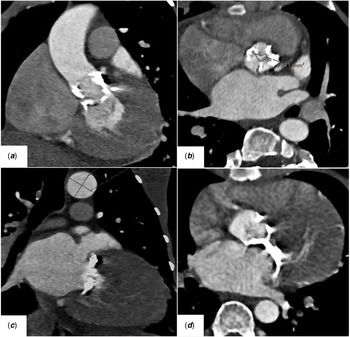
Angio thoracic CT performed for risk stratification confirmed severe aortic annular calcification with a calcium score of 2291 AU and severe annular mitral and chordal calcification with a calcium score of 2358 AU. The coronary calcification was discrete with a calcium score of 24 AU (Fig 2).
Angio thoracic CT. ( a ) Shows the atherosclerotic involvement of the outflow tract of the left ventricle. ( b ) Symmetric calcium deposits are seen in the aortic leaflets with a calcium score of 2291 AU; the aortic valve area (AVA) is 1.92 cm2 (indexed AVA of 0.3 cm2/m2) translating severe aortic stenosis. ( c and d ) Extensive calcification of the mitral annulus with a calcium score of 2358 AU.

In accordance with patient wishes and her family, treatment has been mainly supportive, and she is currently under lonafarnib.
Discussion
The most devastating aspect of Hutchinson–Gilford progeria syndrome is the premature onset of cardiovascular disease that leads to fatal myocardial infarction or stroke in the first decades of life. Degenerative cardiac findings differ from the natural ageing process, with highly accelerated calcium deposition in the coronary arteries, aortic artery, aortic and mitral valve cusps, and mitral annulus. Reference Zhao, Song and Yang5
There were few therapeutical options; recently, new medical treatments and percutaneous interventions have brought some hope for progeria patients.
In November 2020, lonafarnib, a farnesyltransferase inhibitor, was approved in the United States of America as the first effective therapy to reduce the risk of mortality in Hutchinson–Gilford Progeria Syndrome. Reference Lonafarnib6,Reference Gordon, Shappell and Massaro7 Also, previously, in 2019, the San Camillo-Forlanini Hospital in Italy performed a pioneer transcatheter aortic valve replacement in a patient with severe aortic stenosis with progeria syndrome. Remarkably, this is the first and only case of aortic stenosis in this context not being conservatively managed. Reference Musumeci, Cammardella and Lio8
There are some similarities between the patient who underwent the transcatheter procedure and ours, namely the extensive calcification of the aortic valve extending into the left outflow tract, a common finding in progeria patients after the second decade of life Reference Prakash, Gordon and Kleinman3 , and the fact that the coronary arteries did not have significant lesions and were at a reasonable safe distance from the aortic annulus. However, there are also crucial differences between these two patients that make the transcatheter procedure not feasible in our case.
The most obvious difference relates to the anthropometry of both patients; the patient who underwent the transcatheter procedure had 20 kg in contrast to ours, who has only 12 kg, which makes the intervention riskier. However, the determining difference between the two cases is the measurements of the aortic annulus. The Italian patient had an aortic annulus of 20.5x21 mm, that supports a Sapien 3 Ultra 20 mm (Edwards Lifesciences Corporation), which is the smallest percutaneously implantable aortic valve currently available; instead, our patient has a much smaller aortic annulus of 14,5x10 mm, not allowing this kind of intervention.
Our case is particular in that it is one of the oldest living patients with Hutchinson–Gilford progeria syndrome and, surprisingly, knowing from previous reports that coronary involvement increases with time, being the leading cause of death; Reference Ha, Shim and Chung9,Reference Makous, Friedman and Yakovac10 in our patient, the score of calcium was low. This particularity could favour our patient; however, it does not overcome the unfavourable measures of the aortic root that make percutaneous intervention unfeasible and the fragile general condition that makes her considered to be inoperable.
In conclusion, although new therapeutic options have emerged for patients with progeria, they are still limited; therefore, controlling symptoms and risk factors for atherosclerosis may be the best option for patients like ours.
Acknowledgements
None.
Financial support
This research received no specific grant from any funding agency, commercial or not-for-profit sectors.
Conflicts of interest
None.