1 Introduction
Internationally, there is a call for countries to move towards universal health coverage (UHC) (World Health Organization, 2010). This requires universal access to needed health services that are of acceptable quality and which do not place undue financial hardships on households. Thus, financing health services should not impoverish households or impact on their ability to consume other basic household necessities (Wagstaff and van Doorslaer, Reference Wagstaff and van Doorslaer2003; Ataguba, Reference Ataguba and Goudge2012). An important policy consideration for each country is how a universal health system is to be financed. Recently, research into this issue has been encouraged (World Health Organization, 2013) in order to build a strong evidence base, particularly in the context of the post-2015 development agenda. Kutzin (Reference Kutzin2013) has recently highlighted that equity in health financing, where households contribute to the health system according to their ability-to-pay (ATP), is a core health system goal that should guide decisions on health financing to promote movement towards universal coverage.
Most of the studies assessing relative progressivity in health financing have been undertaken in high-income countries (Wagstaff and van Doorslaer, Reference Wagstaff and van Doorslaer1992, Reference Wagstaff and van Doorslaer1997; van Doorslaer et al., Reference van Doorslaer, Wagstaff and Rutten1993; Wagstaff et al., Reference Wagstaff, van Doorslaer, van der Burg, Calonge, Christiansen, Citoni, Gerdtham, Gerfin, Gross, Häkinnen, Johnson, John, Klavus, Lachaud, Lauritsen, Leu, Nolan, Perán, Pereira, Propper, Puffer, Rochaix, Rodríguez, Schellhorn, Sundberg and Winkelhake1999). A general lack of reliable data has limited the number and scope of such studies in low- and middle-income countries, although studies on health financing incidence are gradually increasing in these countries. As it is feasible that there could be differences in the incidence of alternative health financing mechanisms in low- and middle-income countries relative to high-income countries, it is important to strengthen the evidence base on health financing equity in low- and middle-income countries, particularly in Africa.
Although a study was previously undertaken in South Africa (Ataguba and McIntyre, Reference Ataguba, Akazili and McIntyre2012), there are a couple of issues that warrant a re-examination of progressivity in health financing in the country. That study used the 2005/2006 Income and Expenditure Survey (IES), which was subject to under-reporting (Statistics South Africa, 2008a). In fact Statistics South Africa notes that “there was clear and systematic under-reporting in the IES” (Statistics South Africa, 2008a: 5) when expenditures in the IES are compared with aggregate figures. And this was especially the case for expenditures on food and non-alcoholic beverages as the “proportion of consumption expenditure devoted to food in IES 2005/2006 is low for a country at South Africa’s level of development” (Statistics South Africa, 2008b: 17). Because the IES 2005/2006 was the first that combined the diary and the traditional questionnaire that relies on the respondent’s ability to recall, the subsequent IES survey represents an improvement over the shortfalls in the IES 2005/2006. For example, the diary-keeping period was reduced to two weeks as opposed to one month used earlier (Statistics South Africa, 2012). Also, there is a controversy about the treatment of corporate income tax in the assessment of progressivity (Musgrave, Reference Musgrave1985; Kotlikoff and Summers, Reference Kotlikoff and Summers1987; Martinez-Vazquez, Reference Martinez-Vazquez2001; Blackman et al., Reference Blackman, Osakwe and Alpizar2010) with progressivity remaining sensitive to the choice of tax shifting assumption (Shah and Whalley, Reference Shah and Whalley1991). The previous research in South Africa considered different shifting assumptions between shareholders and consumers. While the assumptions are difficult to assess, this paper applies a different assumption in line with studies conducted elsewhere [i.e. using the distribution of personal income tax (PIT) for all direct taxes] (Wagstaff et al., Reference Wagstaff, van Doorslaer, van der Burg, Calonge, Christiansen, Citoni, Gerdtham, Gerfin, Gross, Häkinnen, Johnson, John, Klavus, Lachaud, Lauritsen, Leu, Nolan, Perán, Pereira, Propper, Puffer, Rochaix, Rodríguez, Schellhorn, Sundberg and Winkelhake1999; O’Donnell et al., Reference O’Donnell, van Doorslaer, Rannan-Eliya, Somanathan, Adhikari, Akkazieva, Harbianto, Garg, Hanvoravongchai, Herrin, Huq, Ibragimova, Karan, Kwon, Leung, Lu, Ohkusa, Pande, Racelis, Tin, Tisayaticom, Trisnantoro, Wan, Yang and Zhao2008a). Thus, the release of the 2010/2011 IES data set provides an opportunity to re-examine the analysis of health financing incidence in the country. Also, the timing is opportune given recent proposals to undertake considerable health financing reform in South Africa as well as the global debates about equitable health financing and UHC in the build-up to the adoption of the post-2015 development agenda.
Thus, this paper assesses the progressivity of each of the major health financing mechanisms [direct and indirect taxes, out-of-pocket (OOP) payments and private health insurance] and the overall progressivity of health financing in South Africa using the most recent comprehensive data available. A critical evaluation of equity in the current South African health financing system will provide policy insights about how equity in financing health services can be promoted within the South African context, which may have relevance for other middle-income countries. To assist in the interpretation of the progressivity findings, the next section provides a brief overview of the South African health system including how health services are financed.
2 The South African health system in brief
South Africa has a tiered health system, with distinct public and private sectors serving different socio-economic groups. Currently the public sector, with services largely funded through allocations from general tax revenue and a small portion derived from local government revenue and user fees (Gilson and McIntyre, Reference Gilson and McIntyre2007), is structured in line with the three spheres of government (national, provincial and local). The respective roles of each sphere of government are spelt out in the 2004 National Health Act (Republic of South Africa, 2004; McIntyre et al., Reference McIntyre, Thiede, Nkosi, Mutyambizi, Castillo-Riquelme, Gilson, Erasmus and Goudge2007). Briefly, the National Department of Health is responsible for overall guidance, coordination and national health policy development. The provincial departments, with a high degree of decision-making autonomy, can make provincial health policy, but this must be in line with the broad national policy framework. They are the main providers of public sector health services through hospitals and primary care clinics (Gilson and McIntyre, Reference Gilson and McIntyre2007). Local governments are responsible for environmental health services and other non-facility-based primary health care services (Gilson and McIntyre, Reference Gilson and McIntyre2007).
There is a substantial private health care delivery sector, including a wide range of independent medical, dental and allied practitioners, retail pharmacies and private hospitals. These services are financed mainly through contributions to private health insurance (called medical schemes) with some direct household OOP payments.
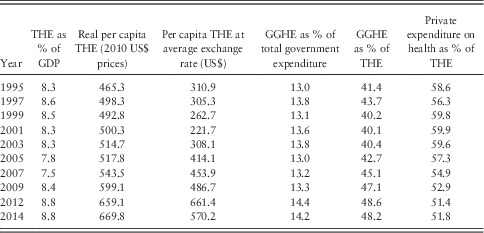
Internationally, it is acknowledged that the way in which “health systems are financed largely determines whether people can obtain needed health care and whether they suffer financial hardship as a result of obtaining care” (Carrin et al., Reference Carrin, Evans and Xu2007: 652). In South Africa, using data from the World Health Organization, real per capita total expenditure on health (at 2010 prices) increased steadily from $465 (in 1995) to $670 (in 2014). Also, total expenditure on health as percentage of gross domestic product increased marginally from 8.3% in 1995 to 8.8% in 2014 (see Table 1) with a substantial share attributable to private health insurance that covers less than one-fifth of the population comprising mainly the rich. However, government financing has not been keeping pace with population growth and inflation (McIntyre et al., Reference McIntyre and Kutzin2012). In fact government expenditure on health as a share of general government expenditure has remained relatively constant and consistently lower than the 15% Abuja target (African Union Heads of State, 2001) over the past two decades.
Overview of selected health financing indicators, South Africa, 1995–2014

Note: THE=total expenditure on health; GGHE=general government expenditure on health.
Source: World Health Organization National Health Account database http://apps.who.int/nha/database
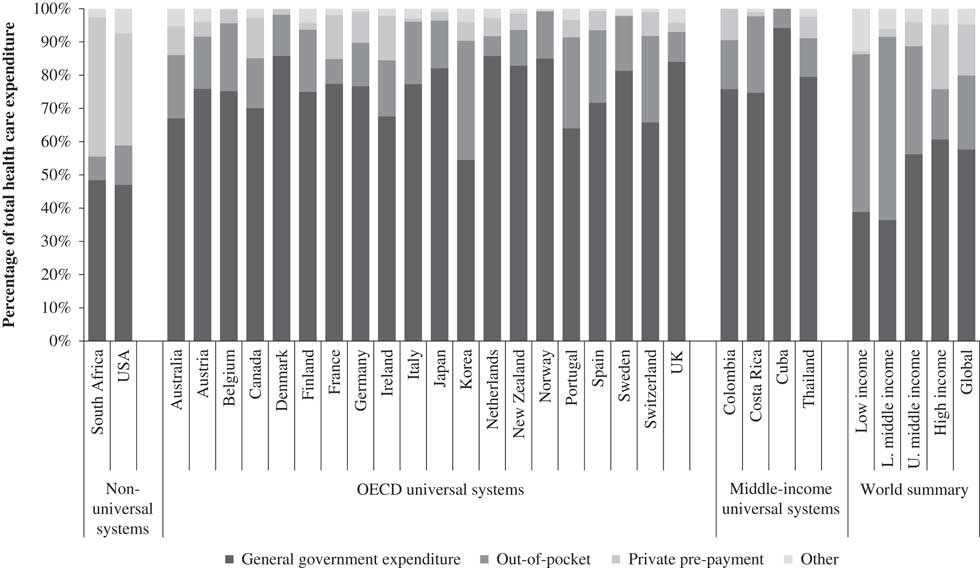
Following McIntyre (Reference McIntyre2012), health financing in South Africa is compared with the United States, a country that shares similarities with South Africa in terms of the prominence of private voluntary health insurance, and other countries with some form of universal health systems (Figure 1). Overall, general government expenditure on health in South Africa is less than that for upper-middle-income countries and the global average. Also, the Organisation for Economic Co-operation and Development (OECD) countries have substantial levels of mandatory pre-payment financing mechanisms (i.e. mainly general tax revenue) and very limited private voluntary pre-payment mechanisms supporting the predominantly public funded system (McIntyre, Reference McIntyre2012). In these countries, with the exception of a few, the share of direct OOP payments in total health expenditure remains very low. In essence, the share of government expenditure on health exceeds the combined shares of OOP payments and private voluntary health insurance in all these countries. This is characteristic of countries with some form of universal health systems.
Health care expenditure (public vs private) in selected countries, 2012. Source: World Health Organization (2015).

A major challenge in South Africa relates to the distribution of resources between the public and private sectors relative to the population that each serves (McIntyre et al., Reference McIntyre, Thiede, Nkosi, Mutyambizi, Castillo-Riquelme, Gilson, Erasmus and Goudge2007). The private sector that serves a minority population (mainly those with private health insurance) accounts for about half of total health care funds in comparison to the public sector that the majority of the population is heavily reliant on. Further, there is high level of fragmentation of resources within the private sector, with over 100 medical schemes registered in South Africa in January 2010 (Council for Medical Schemes, 2010).
In response to some of these challenges, the South African government has stated its commitment to establishing a National Health Insurance Fund (NHIF) as a means of moving the country towards UHC (Department of Health, 2011; National Department of Health, 2015). The NHIF is envisaged as an institution that would play a strategic purchasing role and would purchase services on behalf of the entire population. It is expected to be fully tax funded, through allocations from general tax revenue with the possibility of additional earmarked taxes such as a surcharge on personal income and/or a payroll tax for employers. The National Health Insurance (NHI) policy is still under development and it is expected to be rolled out over a 15-year period (National Department of Health, 2015).
3 Materials and methods
3.1 Data sources for different health financing mechanisms
Data are drawn from the nationally representative Income and Expenditure Survey (IES) conducted by Statistics South Africa (Stats SA) between September 2010 and August 2011. A total of 3,254 primary sampling units were selected and a total of 27,665 households were sampled, representing a response rate of 83%. The IES was conducted using a combination of the diary and questionnaire recall methods (Statistics South Africa, 2012).
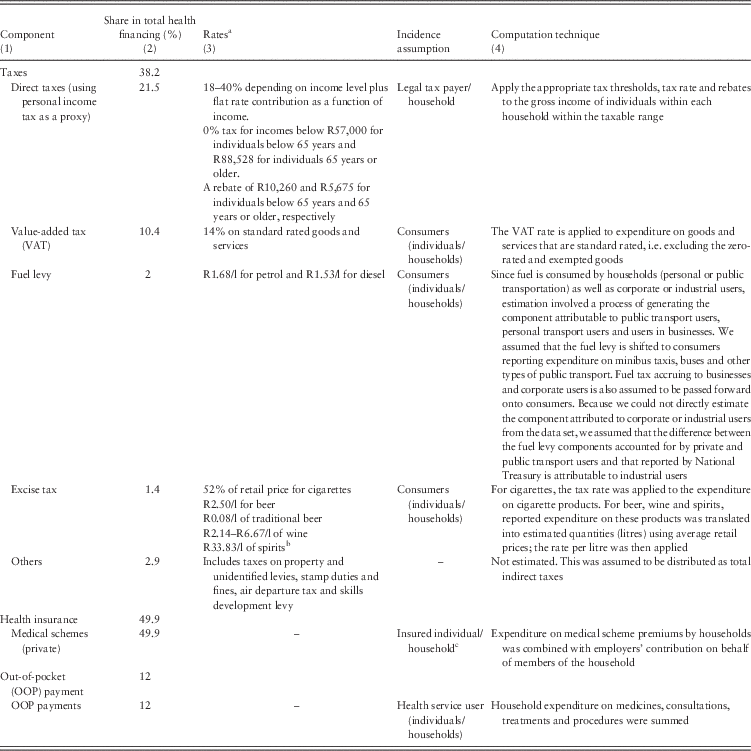
For each of the broad health financing mechanisms (taxes, private health insurance and direct OOP payments), each household’s total payments is estimated as described in Table 2. Only a proportion of tax revenue was allocated to the health sector (11.9% in 2011) (National Treasury, 2011). Because general tax revenue forms an integrated pool of funds, National Treasury does not allocate each tax category separately. Therefore, the contribution of each tax category in total tax revenue allocated to health in South Africa is taken as a fixed proportion (i.e. 11.9%). These have been reported in Table 2 (column 2). Two broad tax categories are considered; direct and indirect taxes. Indirect taxes, as contained in Table 2, include value-added tax (VAT), fuel levy and excise taxes on tobacco products, beer, wine and spirits (note that soft drinks were not included as excise tax on soft drinks was removed in 2002). Direct taxes are proxied by PIT. This is because of inter alia the difficulties of establishing an accurate incidence assumption for corporate income tax (Musgrave et al., Reference Musgrave, Carroll, Cook and Frane1951; Auerbach, Reference Auerbach2006). Altogether, the categories included account for over 90% of total tax receipts. Where the estimates of tax revenue calculated from the IES data did not equal revenue reported by the National Treasury, the difference was apportioned to households based on their proportional share of contribution to each tax estimated (see Borghi et al., Reference Borghi, Ataguba, Mtei, Akazili, Meheus, Rehnberg and McIntyre2009).
Process of computing the components of health care financing

Sources: Authors’ compilation using National Treasury (2011) for the tax rates.
a This applies to the taxes in the 2010/2011 assessment year.
b Assuming a 40 and 5% alcohol per volume for spirits and beer, respectively.
c Most employers in South Africa now operate on a total ‘cost to company’ basis. Thus, employees have a total remuneration package ceiling and must select their medical scheme option, the cost of which is then deducted from the overall package along with other deductions such as pension contributions, and the remainder is then paid as a cash salary.
3.2 A measure of income
Several approaches have been used to measure income or socio-economic status of households. In this paper household income is measured using consumption, defined as the “[f]inal use of goods and services, excluding the intermediate use of some goods and services in the production of others” (O’Donnell et al., Reference O’Donnell, Van Doorslaer, Wagstaff and Lindelow2008b: 70). In addition, the consumption measure used includes all health care payments and is gross of direct taxes. This is because “[i]f one wishes to make an inference about the distributional impact of health finance…, then the measure of ATP should be gross of all health care, tax, and social insurance payments” (O’Donnell et al., Reference O’Donnell, Van Doorslaer, Wagstaff and Lindelow2008b: 188).
Household income and health payments are adjusted to account for variations in household size and composition using an adult equivalent scale (Deaton, Reference Deaton1997):
 $${\rm AE}\, {\equals}\, \left( {s_{A} {\plus}\eta \cdot s_{K} } \right)^{\theta } \,{\rm for}\,\theta \, \geq \, 0,\;0\, \leq\, \eta \, \leq\, 0,$$
where s A is the number of adults in the household; s K the number of children, η the cost of a child – a measure of the weight accorded to children relative to the adults (Banks and Johnson, Reference Banks and Johnson1994) and θ represents economies of scale. This paper uses η=0.5 and θ=0.75 based on Deaton and Zaidi (Reference Deaton and Zaidi2002). The paper also presents results of sensitivity analysis using different values for the adult equivalent scale parameters η and θ.
3.3 Assessing progressivity
Generally, equity in health financing is judged by evaluating the relative progressivity of health care payments in relation to income, a measure of ATP (O’Donnell et al., Reference O’Donnell, Van Doorslaer, Wagstaff and Lindelow2008b) – i.e. how health care payments vary with households’ ATP. If poorer households pay less as a proportion of their ATP for health care compared to richer households, such a relationship is considered progressive. It is regressive if otherwise. A proportional relationship exists when all devote the same proportion of their household resources to financing health services.
There are various analytical methods that can be used to assess progressivity (see Lambert, Reference Lambert2001 for similar methods used in assessing a tax system for instance). In this paper, progressivity is assessed using two methods. The first method simply categorises households into five quintiles, and computes the share of each quintile’s income spent on health care via each of the major financing mechanisms. For instance, comparing each quintile’s share of income devoted to private health insurance with the share for other quintiles. In the case of taxes, as noted earlier, only the proportion of general tax revenue spent on health is taken into account. The second approach is a more ‘formal’ measure of progressivity. This measure compares the distribution of income (using the Lorenz curve) with the distribution of health care payments (using concentration curves) to obtain the Kakwani index of progressivity. This index has been most widely used (Kakwani, Reference Kakwani1977; O’Donnell et al., Reference O’Donnell, van Doorslaer, Rannan-Eliya, Somanathan, Adhikari, Akkazieva, Harbianto, Garg, Hanvoravongchai, Herrin, Huq, Ibragimova, Karan, Kwon, Leung, Lu, Ohkusa, Pande, Racelis, Tin, Tisayaticom, Trisnantoro, Wan, Yang and Zhao2008a) in the literature.
Generally, the Kakwani index of progressivity (π j ) of health financing mechanism j can be computed as
 $$\pi _{j} \, {\equals}\, C_{j} {\minus}G_{X} ,$$
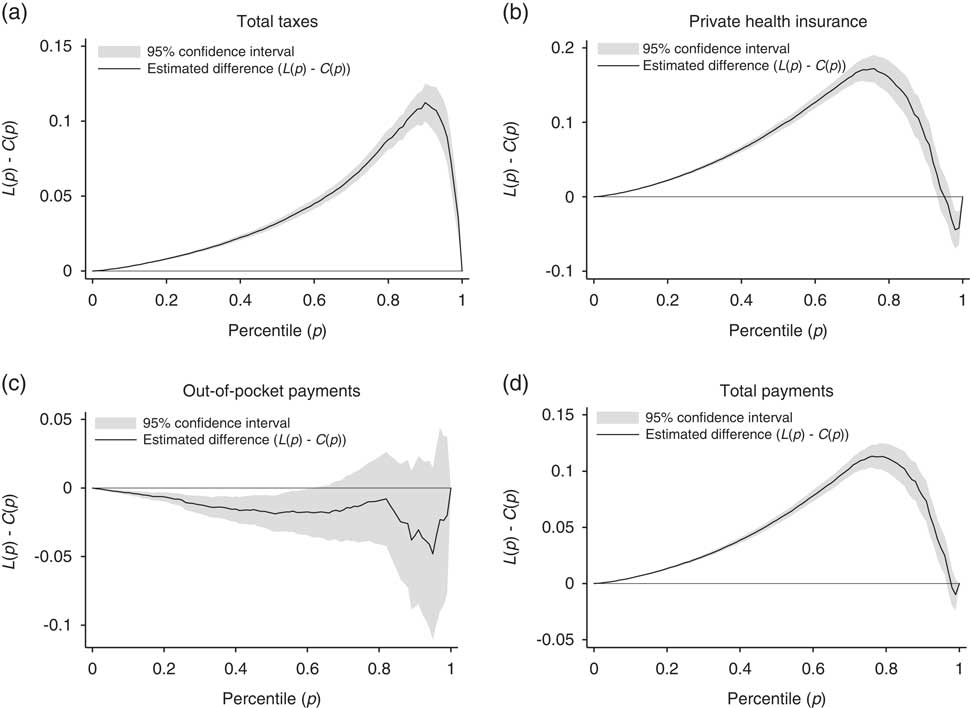
where C j is the concentration index of health financing mechanism j; and G X the Gini index of pre-payment income (i.e. gross income). A progressive (or regressive) financing mechanism or system occurs when π j >0 (or π j <0) while a mechanism or system is proportional when π j =0. Theoretically, π j can range from −2 (i.e. most regressive) to 1 (most progressive). Analytically, a proportional system may occur when the concentration curve lies on top of the Lorenz curve and it could also occur sometimes when the curves cross. This makes it important to supplement the Kakwani index with a more general graphical analysis of the concentration and Lorenz curves as well as statistical dominance tests (O’Donnell et al., Reference O’Donnell, Van Doorslaer, Wagstaff and Lindelow2008b: 193). The graphical analysis presented in this paper is based on computing the difference between the Lorenz curve [L(p)] and concentration curve [C(p)] coordinates at different percentiles of income [i.e. L(p)−C(p)] with associated confidence intervals. Briefly, progressivity at percentile point p corresponds to a case where (L(p)−C(p))>0 at that percentile point while regressivity at percentile point p occurs when (L(p)−C(p))<0 at that percentile point. So, (L(p)−C(p))>0 at all percentile points, corresponds to progressive financing (i.e. π>0) while (L(p)−C(p))<0 at all percentile points is interpreted as regressive financing (i.e. π<0). Similarly, (L(p)−C(p))=0 at all percentile points corresponds to proportional financing (i.e. π=0).
In this paper, the Gini index is computed as
 $$G_{X} \, {\equals}\, 1{\minus}\left( {\hat{\xi }\,/\,\hat{\mu }_{X} } \right),$$
where
 $\hat{\xi }\, {\equals}\, \mathop \sum\nolimits_{i\, {\equals}\, 1}^n (((V_{i} )^{2} {\minus}(V_{{i{\plus}1}} )^{2} )\,/\,(V_{1} )^{2} )x_{i} $
;
 $V_{i} \, {\equals}\, \mathop \sum\nolimits_{h\, {\equals}\, i}^n w_{h} $
and x
1≥x
2≥ … ≥x
n−1≥x
n
. The vector x=[x
1, x
2, … , x
n
] represents a vector of per adult equivalent incomes while the vector w=[w
1, w
2, … , w
n
] represents the sampling weights. The weighted average of per adult equivalised incomes is
 $\hat{\mu }_{X} $
.
The concentration index for the health care payment variable j is computed using the vector of per adult equivalent incomes as the ranking variable analogously as
 $$C_{j} \, {\equals}\, 1{\minus}\left( {\hat{\xi }_{j} \,/\,\hat{\mu }_{j} } \right).$$
The standard error for all indices are obtained analytically using the DASP routine (Araar and Duclos, Reference Araar and Duclos2009) within Stata®.
Further, the multiple comparison approach (MCA) dominance testing procedure (Dardanoni and Forcina, Reference Dardanoni and Forcina1999) was implemented to assess the dominance between concentration curves and between the Lorenz curve, the line of equality and the concentration curves. Here, curve A dominates curve B “if there is at least one quantile point at which curve A lies significantly above curve B and there is no quantile point at which curve B lies above curve A” (O’Donnell et al., Reference O’Donnell, Van Doorslaer, Wagstaff and Lindelow2008b: 88) using 19 evenly spaced quantiles from 0.05 to 0.95 (see Sahn et al., Reference Sahn, Younger and Simler2000 for why the extreme values are excluded).
All analyses were done taking into account the multistage sample design using Stata® 13.1 software (StataCorp, 2013). Although secondary data are used for this study, ethics clearance was obtained from the University of Cape Town, Faculty of Health Sciences Human Research Ethics Committee.
4 Results
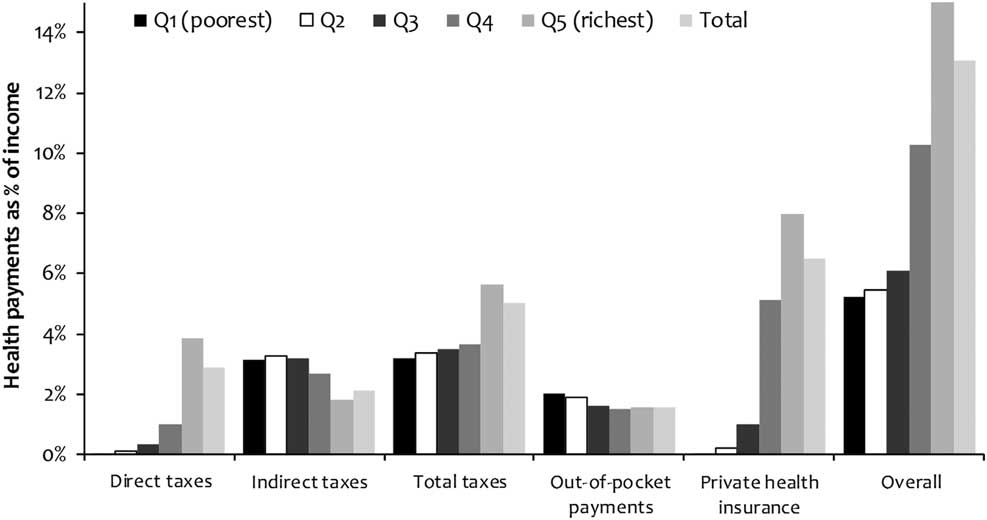
The results from the assessment of progressivity are presented in Figure 2. They show that OOP payments are regressive because the poorest 20% of the population pay more as a proportion of their income than the richest 20% of the population. Also, the poorest 60% of the population pay more as a proportion of their income OOP for health services than the average of all the quintiles.
Health care payments as a proportion of household income, South Africa 2010/2011.
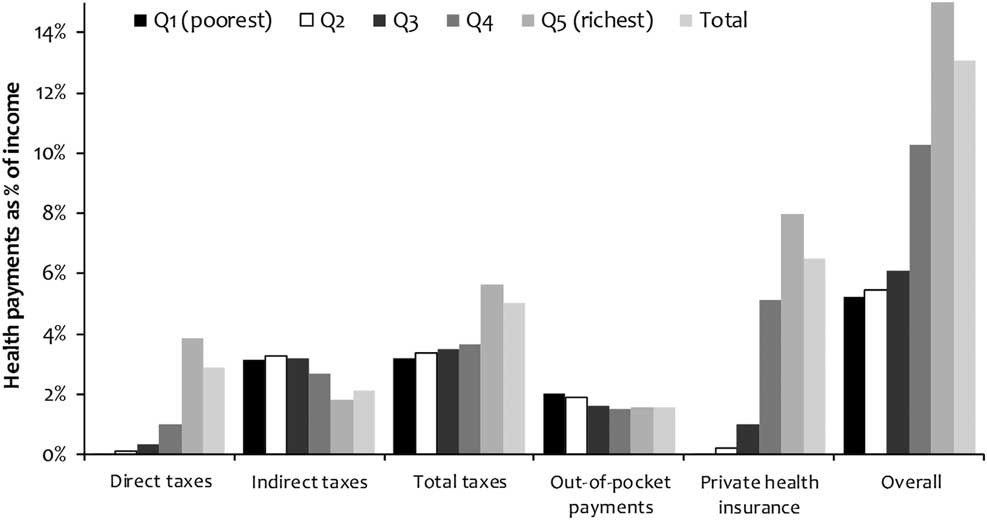
The health financing mechanisms that show clear progressive pattern include direct taxes and private health insurance (i.e. medical scheme) contributions. Here, the richest 20% of the population spend more on health financing as a proportion of their income than the poorest 20% of the population. The bottom 20% of the population spends a relatively small share of their income on health services via direct taxes and medical scheme contributions compared to the other groups. The result for private health insurance is not surprising as the poorest 20% of the population, statistically speaking, has few or no insured people. Direct taxes, as proxied by PIT, are by design progressive based on the progressive tax rates.
The incidence of general taxes overall is progressive. However, it is far less progressive than direct taxes due to the regressivity of indirect taxes which offsets the progressivity of direct taxes when all taxes are combined (see this later in Figure 4). The overall incidence of total taxes is very similar across the quintiles with the exception of the richest 20% of households. Figure 2 also shows that medical scheme contributions impose the largest burden on households’ income in comparison with general taxes and OOP payments. On average, it accounts for over 6% of all household incomes as compared to general taxes which account for about 5%. This burden is particularly high for the top two quintiles.
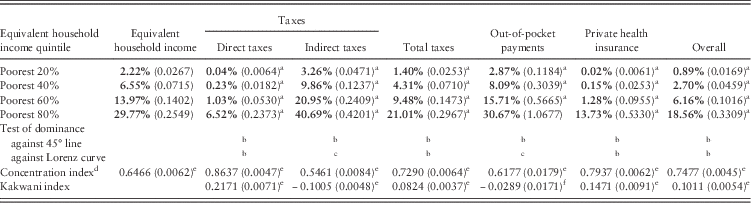
While the results contained in Figure 2 are informative, they do not tell us the extent to which each of these mechanisms is regressive or progressive. To investigate this further, we present in Table 3 the results of a more formal assessment of progressivity using the Kakwani index of progressivity. The results of the tests of dominance of the concentration curve and the Lorenz curve (i.e. income share), and the concentration curves and the 45° line (i.e. population share) are also presented. Here, the various columns of health financing are compared with the equivalent household income column and population shares. All the concentration indices are positive and statistically different from 0, at conventional levels, indicating that the concentration curves lie below the 45° line of equality (see the bold entries). Similarly, almost all concentration curve coordinates are statistically different from their respective Lorenz curve coordinates at the conventional levels of significance. The extent of inequality of income distribution in the population is presented by the Gini index estimated at 0.65 which is statistically different from 0 (equality). This is comparable to a value of 0.69 that is reported by Stats SA gross of taxes (Statistics South Africa, 2008c) for 2005/2006. In fact it is worth noting that South Africa records one of the highest levels of income inequality (World Bank, 2014) that is due in part to apartheid and the high degree of social and economic stratification in the country (Spaull, Reference Spaull2013).
Cumulative shares of health payments by income quintiles, South Africa 2010/2011

Note: standard errors in parenthesis.
For shares: bold indicates significant difference from population share (5%).
Dominance is rejected if there is at least one significant difference in one direction and no significant difference in the other, with comparisons at 19 quantiles and 5% significance level.
a Significant difference from income share (5%).
Dominance tests: b45° line/Lorenz curve dominates the concentration curve;
c concentration curve dominates 45° line/Lorenz curve.
d Gini index for equivalent household income.
For the indices: eSignificant difference from 0 (1%);
f significant difference from 0 (10%).
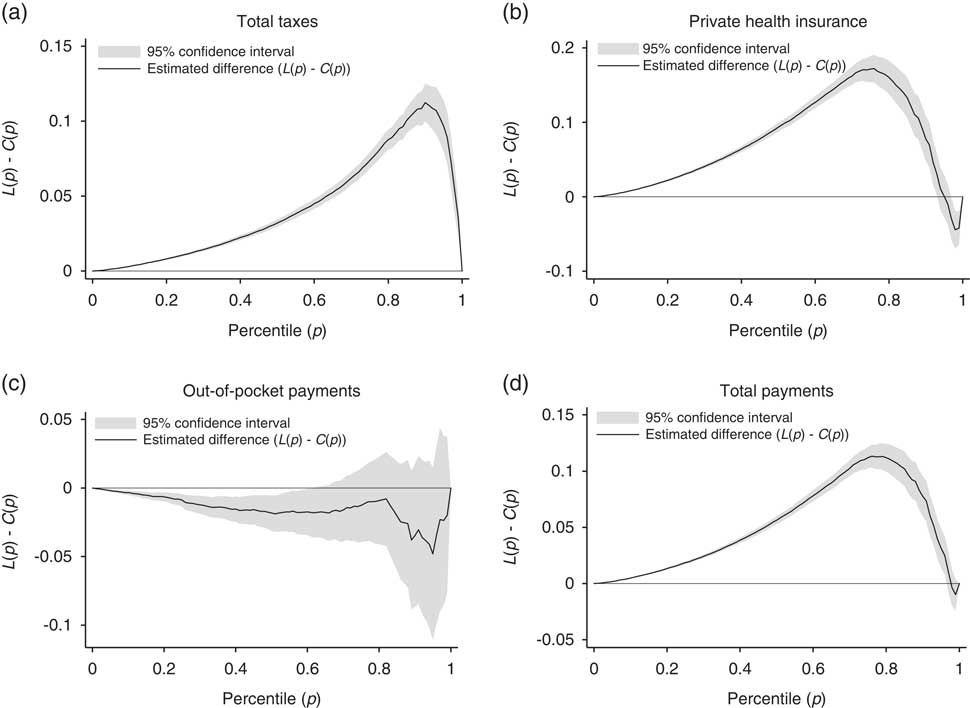
Private health insurance and direct taxes are progressive (i.e. have positive Kakwani indices) and statistically different from 0 at conventional levels. Indirect taxes and OOP payments are regressive and statistically different from 0. OOP payments are only marginally significant at the 10% level. The combined effect of the indirect and direct taxes resulted in a statistically significant progressive total taxes (Kakwani index=0.08). The dominance test results in Table 3 further show that all the concentration curves lie below the 45° line. Also, using the MCA approach, the dominance tests affirm that direct taxes, private health insurance, and total taxes are progressive while OOP payments and indirect taxes are regressive.
Overall, the Kakwani index of progressivity of health financing is estimated at 0.10 indicating a mildly progressive system of health financing. The ‘positive’ contributors to the overall progressivity are direct taxes and private health insurance while the ‘negative’ contributors include indirect taxes and OOP expenditures. The combined influence of the positive Kakwani indices offsets the negative indices, especially through their relative shares in total health financing (see Table 2).
The results in Table 3 are presented graphically in Figure 3. They confirm progressivity of private health insurance, total taxes and overall health financing [i.e. (L(p)−C(p))>0] and the regressivity of OOP expenditures [i.e. (L(p)−C(p))<0] even though the latter is not statistically significant at the 5% level.
Progressivity of the health financing in South Africa, 2010/2011.
The statistical dominance tests results presented in Table 4 show that the concentration curve of indirect taxes, lying above the Lorenz curve, dominates all the other mechanisms. This indicates that it is the most regressive health financing mechanism in South Africa. There is no clear dominance between the concentration curves of private health insurance and direct taxes as these curves cross each other.
Results of the dominance testing of concentration curves

Note: Dom indicates that concentration curve of row entry dominates (is less ‘progressive’ than) that of column entry; Cross indicates that the concentration curves of the row and column entries cross each other.
Dominance is rejected if there is at least one significant difference in one direction and no significant difference in the other, with comparisons at 19 quantiles and 5% level of significance.
5 Sensitivity and robustness checks
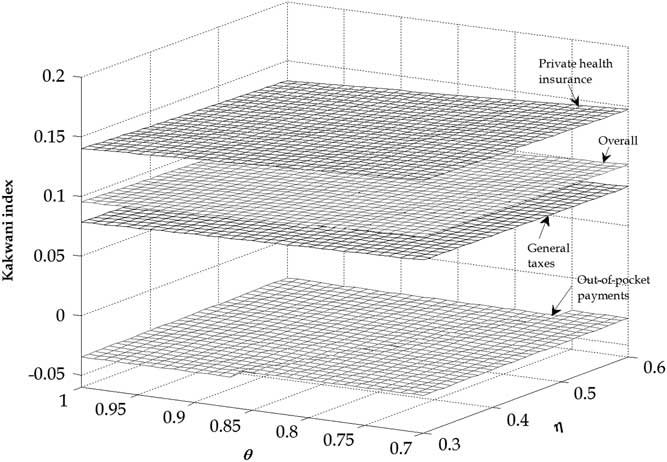
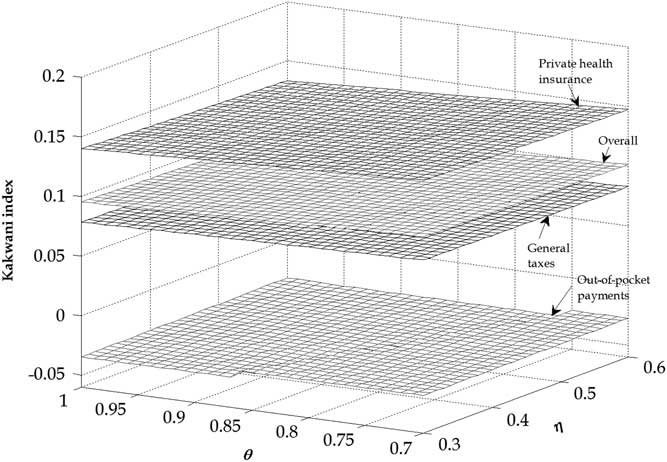
The estimates of progressivity reported in this paper are based on certain assumptions about the adult equivalent scale parameters. As shown in equation (1) the adult equivalent scale [i.e. AE=(s A +η⋅s K ) θ ] was used where η the cost of children parameter and θ the economies of scale parameter were set at 0.5 and 0.75, respectively. Basically if θ=η=1, then AE can be interpreted as total household size and all estimates coincide with per capita estimates. If we set η such that η→1 then the consumption of a child is assumed to be almost equivalent to that of an adult while θ→1 indicates the absence of economies of scale such that larger households, on average, do not live more cheaply than smaller households. On the issue of economies of scale Deaton and Zaidi (Reference Deaton and Zaidi2002) suggest that, for developing countries, the value of θ should lie between 0.75 and 1 while the value of η should lie between 0.3 and 0.5. This is because of the relative importance of food in total consumption, and the limited scope for economies of scale. These bands guide the sensitivity analysis performed in this paper.
As shown in Figure 4, within reasonable values, there are very marginal changes in the estimated Kakwani indices for the major financing mechanisms. Also, the choice of adult equivalent scale parameters does not change the ordering of the major financing mechanisms in terms of their progressivity/regressivity. This makes the results robust to the choice of adult equivalent scale parameter values.
Assessing the impact of the choice of adult equivalent scale parameters in ordering progressivity, South Africa, 2010/2011.
6 Discussion
This paper provides a comprehensive and updated analysis of the relative progressivity of each health financing mechanism and overall health financing in South Africa. The results show that the two largest health financing mechanisms, general tax revenue and medical scheme contributions are progressive while OOP payments are regressive. Because the combined ‘positive’ effect of general taxes and private health insurance outweighs the regressivity of OOP payments, health financing is progressive overall in South Africa.
Our findings in relation to the incidence of taxes are similar in pattern to earlier South African studies (see e.g. Simkins et al., Reference Simkins, Woolard and Thompson2000). Some of these earlier studies are now quite dated and consider racial (as opposed to socioeconomic) differences in tax incidence (McGrath, Reference McGrath, Janisch and Horner1979; McGrath et al., Reference McGrathn.d., for instance) or are based on much earlier data sets (Simkins et al., Reference Simkins, Woolard and Thompson2000). Others are limited to a specific tax (Amm, Reference Amm2001; Go et al., Reference Go, Kearney, Robinson and Thierfelder2005). However, these studies did not investigate progressivity of health financing in general. As shown in Table 2, taxes account for about 40% of total health financing only. In this paper, our main objective is to assess the progressivity of health financing (and not simply tax incidence) in South Africa.
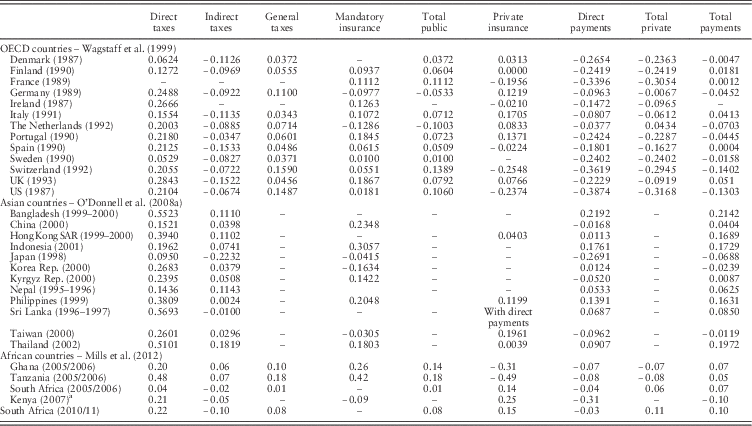
Most of the studies assessing the progressivity of health financing have been undertaken in high-income countries, but some have more recently been undertaken in a number of Asian countries (O’Donnell et al., Reference O’Donnell, van Doorslaer, Rannan-Eliya, Somanathan, Adhikari, Akkazieva, Harbianto, Garg, Hanvoravongchai, Herrin, Huq, Ibragimova, Karan, Kwon, Leung, Lu, Ohkusa, Pande, Racelis, Tin, Tisayaticom, Trisnantoro, Wan, Yang and Zhao2008a) and a few African countries (Akazili et al., Reference Akazili, Garshong, Aikins, Gyapong and McIntyre2012; Mills et al., Reference Mills, Ataguba, Akazili, Borghi, Garshong, Makawia, Mtei, Harris, Macha and Meheus2012; Mtei et al., Reference Mtei, Makawia, Ally, Kuwawenaruwa, Meheus and Borghi2012; Munge and Briggs, Reference Munge and Briggs2014). Table 5 provides a summary of the most recent findings on health financing incidence internationally. Although these data are not as recent as our study, they serve to demonstrate general international trends and key lessons about the relative progressivity of health financing. Direct taxes are almost universally progressive, as in South Africa, while indirect taxes are regressive in high-income countries but not necessarily in low- and middle-income countries. In South Africa, indirect taxes are found to be regressive. The progressivity of indirect taxes in some low- and middle-income countries is due to the fact that most food items in these countries are exempt from VAT or sales tax and that poorer households purchase goods that are produced in the local informal sector which escape indirect taxes (O’Donnell et al., Reference O’Donnell, Van Doorslaer, Wagstaff and Lindelow2008b; Akazili et al., Reference Akazili, Gyapong and McIntyre2011).
Kakwani indices for selected OECD countries, Asian countries and African countries

a Munge and Briggs (Reference Munge and Briggs2014).
Direct OOP payments are consistently regressive in high-income countries, as is the case in South Africa, but the incidence is variable in low- and middle-income countries. A key reason for the progressivity of OOP payments in low-income countries is the constrained ability of poor households to pay for health services. The poorest of the poor simply cannot afford to pay and therefore do not use health services if they are required to pay (O’Donnell et al., Reference O’Donnell, van Doorslaer, Rannan-Eliya, Somanathan, Adhikari, Akkazieva, Harbianto, Garg, Hanvoravongchai, Herrin, Huq, Ibragimova, Karan, Kwon, Leung, Lu, Ohkusa, Pande, Racelis, Tin, Tisayaticom, Trisnantoro, Wan, Yang and Zhao2008a).
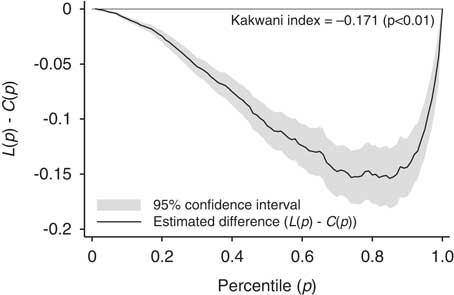
The incidence of private health insurance contributions varies considerably across countries. Where the majority of the population makes private health insurance contributions, such as the United States and formerly in Switzerland, it is very regressive. Similarly, a large proportion of the population in France contribute to private health insurance, to cover the high co-payments required by the mandatory insurance system. The combination of coverage of a large portion of the population and flat rate contributions (i.e. contributions that are not income related) translates into a regressive burden of private health insurance. In contrast, where there is a universal publicly funded (i.e. general tax and/or mandatory insurance) health system with a comprehensive benefit package and without large co-payments, private health insurance provides supplemental cover and is essentially a luxury good accessible only to the richest (Wagstaff et al., Reference Wagstaff, van Doorslaer, van der Burg, Calonge, Christiansen, Citoni, Gerdtham, Gerfin, Gross, Häkinnen, Johnson, John, Klavus, Lachaud, Lauritsen, Leu, Nolan, Perán, Pereira, Propper, Puffer, Rochaix, Rodríguez, Schellhorn, Sundberg and Winkelhake1999). Similarly, with the exception of community health insurance, private health insurance is a luxury good in low- and middle-income countries, as is the case in South Africa, and is consequently progressive. In the case of South Africa only the richer segments of the population are able to afford and to purchase private health insurance. Thus such contributions do not account for a substantial share of the poor’s income. However an assessment of progressivity of private health insurance among only the insured (Figure 5), comprising mainly the richer segments of the population, showed a regressive pattern (i.e. contributions to private health insurance among only the insured are regressive) and this is attributable largely to non-discriminatory premiums.
Regressivity of private health insurance contributions among the insured population in South Africa, 2010/2011.
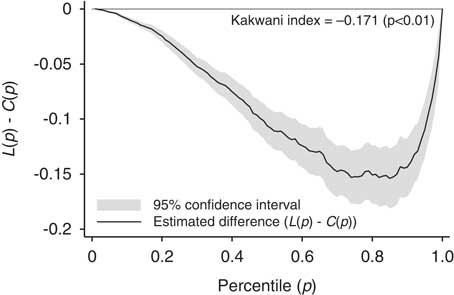
It is generally accepted that it is desirable to pursue a progressive health financing system, in line with the equity definition of contributing to health financing according to ability-to-pay (Wagstaff and Van Doorslaer, Reference Wagstaff and Van Doorslaer1993; Kutzin, Reference Kutzin2013). However, the degree of progressivity of a health financing system that is regarded as desirable within any particular country is clearly a value judgement and a policy decision, which should ultimately be based on societal preferences. We would argue that in the South African context, we should pursue as progressive a health financing system as possible, for two reasons. The first is that South Africa has a highly inequitable distribution of income, where the richest 10% of the population accounts for 51% of total income and the poorest 10% of the population account for a mere 0.2% of income (Statistics South Africa, 2008c). It is inconceivable that it is feasible for lower income groups to bear a greater burden of health financing than they currently do within the context of this highly skewed income distribution, which is one of the most skewed in the world. Second, the majority of South Africans support the concept of a progressive health financing system. Results from a national household survey found that 62% of South Africans stated a preference for a financing system that is progressive (either with all South Africans contributing something or with the poorest not paying anything) (McIntyre et al., Reference McIntyre and McLeod2009).
The results in this paper are also similar in pattern to those from a previous study in South Africa (Ataguba and McIntyre, Reference Ataguba, Akazili and McIntyre2012); direct taxes and private health insurance contributions are progressive, indirect taxes and OOP expenditures are regressive and health financing overall is progressive. However, these results are not directly comparable. This is due inter alia to differences in the methodology of computing the Kakwani index and the way some taxes were treated (e.g. direct taxes, particularly that the earlier study included estimates of corporate taxes). Also, there was no adjustment made for under-reporting of expenditure items in the previous data set.
What lessons can we learn from international experience in terms of strengthening the progressivity of health financing? First, OOP payments are generally regressive, and even where progressive, they are the least progressive way of financing health services. South Africa has a relatively low burden of health financing through OOP payments in that only 12% of total health care expenditure is financed through OOP payments, which is lower than in many other low- and middle-income countries. However, it is important to avoid increasing the burden of OOP payments, either in the form of user fees at public sector facilities or in the form of co-payments by the insured (Ataguba and Goudge, Reference Ataguba and McIntyre2012). This is because about 60% of OOP payments are attributable to medical scheme members at present, due to co-payments on certain benefits (such as acute medicine prescriptions) and for services that are either not covered by medical schemes or where annual benefits are so limited that they are exhausted rapidly. As a result, some medical scheme members lack adequate financial protection (Ataguba and Goudge, Reference Ataguba and McIntyre2012). Further, there have been growing restrictions on medical scheme benefit packages over time (McIntyre and McLeod, Reference McIntyre and McLeodin press).
Second, although the incidence of medical scheme contributions is progressive when viewed across the entire population, largely due to the fact that membership is heavily concentrated amongst the richest South Africans, the flat rate contribution structure means that scheme contributions are regressive across the population who are covered by schemes (see Figure 5). This regressive incidence is found in high-income countries where private health insurance covers the majority of the population. If private health insurance coverage is expanded in South Africa over time, those who will be drawn in will be lower income workers; the progressivity of scheme contributions when considered across the whole population will decline and could become regressive if widespread private health insurance coverage is achieved.
Third, general tax revenues are usually the most progressive health financing mechanism. The relative progressivity of general tax revenue is influenced by the mix of direct and indirect taxes (van Doorslaer and Wagstaff, Reference van Doorslaer and Wagstaff1993; Wagstaff et al., Reference Wagstaff, van Doorslaer, van der Burg, Calonge, Christiansen, Citoni, Gerdtham, Gerfin, Gross, Häkinnen, Johnson, John, Klavus, Lachaud, Lauritsen, Leu, Nolan, Perán, Pereira, Propper, Puffer, Rochaix, Rodríguez, Schellhorn, Sundberg and Winkelhake1999; McIntyre and Kutzin, Reference McIntyre, Doherty and Ataguba2012). The regressivity of indirect tax and its relative share caused a reduction in the progressivity of general taxes. Thus, increasing the share of direct taxes relative to indirect taxes will increase the progressivity of overall health financing.
From a South African policy perspective, it is important to consider this updated empirical evidence in relation to proposed health financing reform proposals. As noted earlier, the NHIF would be funded by allocations from existing general tax revenue to the health sector and two other possible mechanisms – a surcharge on personal income and a tax on employers based on the size of the payroll – that would be dedicated to the health sector. The international evidence and the findings of this study indicate that a surcharge on personal income would be a progressive mechanism for financing health services. However, the impact of a tax on employers is unclear; it is likely to have a similar incidence to company income tax, which is very difficult to determine accurately due to the potential to shift such taxes onto consumers. The ultimate decision among these options will be a policy choice, based on policy-makers’ preferences in relation to the relative progressivity of health care financing.
While the results in this paper are useful for understanding the relative progressivity of different health financing mechanisms in general, they do not provide a holistic picture of equity in the delivery and financing of health services in South Africa. In South Africa, as in many other countries, evidence shows that the poor bear a greater burden of disease (Ataguba et al., Reference Ataguba and McIntyre2011; Ataguba et al., Reference Ataguba2015). Also, a previous study has shown that the distribution of health service utilisation and benefits (for both public and private services) is pro-rich and not distributed in line with self-reported need for health care (Ataguba and McIntyre, Reference Ataguba, Day and McIntyre2013). In fact South Africa reflects the classic case of the inverse care law where those with the greatest need for health services benefit from fewer services than those with relatively less need for such services (Ataguba and McIntyre, Reference Ataguba, Day and McIntyre2013). Thus, while health financing in South Africa may be progressive overall, an inequitable distribution of health service benefits indicates that the health system is yet to achieve overall equity in both the delivery and financing of health care. Thus, any policy choice to improve health financing equity needs to take this into account and should ensure an equitable utilisation of health services beyond just ensuring a progressive financing system.
A major strength of the paper lies in the use of a more recent and reliable data for assessing progressivity. However, a limitation of the paper relates to the use of self-reported household expenditures. While this limitation is shared by studies of this nature, if the reporting pattern is relatively similar between income groups, the impact on the estimates of progressivity will be negligible. This not notwithstanding, the results from this study are qualitatively comparable to those from previous studies. Also, the paper only assesses equity in health financing without recourse to the distribution of health care utilisation arising from such financing. A more holistic view of equity requires the assessment of both the financing and use of health care as a financing mechanism may be progressive but health care benefits may be inequitably distributed. In terms of future research, with the full implementation of the health sector reform in South Africa, there will be a need for research that will continue to assess equity in the entire system by looking at both the financing and delivery of health services to monitor progress towards an equitable universal system.
7 Conclusion
In conclusion, the South African health financing system is generally progressive. However the progressivity is a result of the combined effect of progressive private health insurance and direct taxes and regressive OOP payments and indirect taxes. More specifically, private health insurance is the largest contributor to progressivity. However, only some of the wealthiest segments of the population are enrolled in and benefit from medical schemes. The study showed that when we consider the distribution of scheme contributions across only the insured, the contributions are regressive. International experience highlights that private health insurance is generally regressive when it is expanded to cover a large section of the population. It is also now internationally accepted that OOP or direct payments tend to be the most regressive (or at best, the least progressive) mechanism for financing health services and can impoverish households, and the global emphasis is firmly on reducing such payments and moving more and more to mandatory pre-payment financing mechanisms (World Health Organization, 2010).
The policy decision on how progressive a country’s health financing system should be is essentially a value judgement. If a more progressive financing system is desired, the emphasis should be placed on direct taxes, particularly PITs. Less progressive financing systems would rely more heavily on indirect taxes and OOP payments. This study contributes to policy-making, particularly in relation to the proposed NHI in South Africa, in the sense that it provides updated empirical evidence on the relative progressivity of alternative health financing mechanisms, and so health financing reforms can be tailored to policy-makers’ preferences drawing on this evidence base.
Acknowledgements
This research was funded by the European Commission (Sixth Framework Programme; Specific Targeted Research Project no: 32289) and IDRC (Grant number 103457). D.M. is supported by the South African Research Chairs Initiative of the Department of Science and Technology and National Research Foundation. J.E.A. acknowledges the Claude Leon Foundation for additional financial support.