1 Introduction
The flow in the vicinity of the sharp interface that is widely observed to form between a turbulent flow and non-turbulent surroundings, e.g. a chimney plume issuing into quiescent air, has received considerable attention in the literature over the last decades (e.g. Dimotakis Reference Dimotakis2000; Holzner et al. Reference Holzner, Liberzon, Nikitin, Lüthi, Kinzelbach and Tsinober2008; da Silva et al. Reference da Silva, Hunt, Eames and Westerweel2014). Among others, the main motivation for these studies stems from the fact that, across turbulent/non-turbulent interfaces (TNTIs), fluid is continuously incorporated into the turbulent flow, a process known as turbulent entrainment. The entrainment rate has direct bearing on mixing properties and global dynamics of the flow and is therefore of high relevance and interest in many applications, e.g. jet, wake and boundary layer flows.
To date, much research has focused on small-scale properties of the entrainment process (see e.g. Westerweel et al. Reference Westerweel, Fukushima, Pedersen and Hunt2005; Holzner & Lüthi Reference Holzner and Lüthi2011; Silva, Zecchetto & da Silva Reference Silva, Zecchetto and da Silva2018) and it is now well established (Mathew & Basu Reference Mathew and Basu2002; Westerweel et al. Reference Westerweel, Fukushima, Pedersen and Hunt2009) that the process by which non-turbulent fluid initially acquires vorticity is of viscous nature, as originally envisioned by Corrsin & Kistler (Reference Corrsin and Kistler1954). However, the overall entrainment rate is known to be independent of viscosity or, in other terms, of the Reynolds number (see e.g. Tritton Reference Tritton1988; Tsinober Reference Tsinober2009). It is therefore believed that structures at larger scales act to cancel the Reynolds-number dependence of the small-scale process. That is to say, even though locally non-turbulent fluid becomes turbulent via viscous diffusion of vorticity, the overall entrainment is imposed by fluid motion at larger scales which control the surface area of the TNTI (Townsend Reference Townsend1980; Sreenivasan, Ramshankar & Meneveau Reference Sreenivasan, Ramshankar and Meneveau1989). Recently, Lee, Sung & Zaki (Reference Lee, Sung and Zaki2017) used conditional analysis to show that the TNTI surface area of a turbulent boundary layer increases in the vicinity of large-scale motions (LSMs). However, a similar observation is missing for other flows, far from the wall, and at present it is not clear how the fluid motion near the TNTI is related to the vortical structures in the flow. Da Silva & dos Reis (Reference da Silva and dos Reis2011) visualized the vortical structures near the TNTI of a turbulent planar jet. They suggested that the large-scale vortices ‘sitting’ on the TNTI are mostly defining its shape. Moreover, they conclude that the characteristic vorticity jump of the TNTI, as well as its thickness, is imposed by the radial vorticity distribution of these structures.
Nevertheless, progress in our understanding of the relation between the large-scale vortical structures and TNTI has been hampered by the arbitrariness in the ‘vortex’ structure definition. Often structures are extracted based on arbitrary thresholds and based on quantities that are not invariant to a change of the system of reference, i.e. they are not objective. Newly developed Lagrangian methods (for a review, see Haller (Reference Haller2015)) for vortex identification constitute a promising tool to overcome this issue.
Since the initial work of Haller & Yuan (Reference Haller and Yuan2000), the theory of Lagrangian coherent structures (LCSs) has aimed to identify vortical structures – referred to hereinafter as vortical Lagrangian coherent structures (VLCSs) to distinguish them from other types of LCSs – using dynamical systems approaches, overcoming the arbitrariness that characterizes the classical non-objective methods, such as
 $Q$
- (Hunt, Wray & Moin Reference Hunt, Wray and Moin1988),
 $\unicode[STIX]{x1D6E5}$
- (Chong, Perry & Cantwell Reference Chong, Perry and Cantwell1990) and
 $\unicode[STIX]{x1D706}_{2}$
-criteria (Jeong & Hussain Reference Jeong and Hussain1995). LCS approaches are mostly based on stretching requirements (Haller Reference Haller2015) and identify highly coherent, ‘black hole’ type material regions with high accuracy, but at substantial computational cost (see e.g. Haller & Beron-Vera Reference Haller and Beron-Vera2013; Hadjighasem & Haller Reference Hadjighasem and Haller2016). Recently, a less computationally expensive approach has been developed that replaces the stretching-based coherence requirement with rotational coherence. This method uses a new dynamic version of the classic polar decomposition introduced in Haller (Reference Haller2016) and identifies the initial positions of VLCSs as tubular level surfaces of the so-called Lagrangian-averaged vorticity deviation (LAVD). Haller et al. (Reference Haller, Hadjighasem, Farazmand and Huhn2016) identified vortical structures, using LAVD-based methods, in two-dimensional (2-D) and three-dimensional (3-D) flow fields. However, as highlighted by Haller et al. (Reference Haller, Hadjighasem, Farazmand and Huhn2016), a fully automated implementation of LAVD methods for multiple 3-D coherent structures is still missing.
In the present work, we seek to implement a 3-D VLCS extraction method based on the LAVD theory of Haller et al. (Reference Haller, Hadjighasem, Farazmand and Huhn2016) and apply it to experimental data of a gravity current. The gravity current constitutes an interesting flow case for two reasons. On the one hand, it has important practical applications, e.g. river plumes, katabatic winds and oceanic overflows. On the other hand, the entrainment rate across the TNTI varies with the ratio between the buoyancy and the flow shear strengths, represented by the Richardson number,
 $Ri$
. This allows us to investigate how the properties of the TNTI vary to accommodate the entrainment variation with
 $Ri$
and how these properties are related to the VLCSs in the proximity of the TNTI.
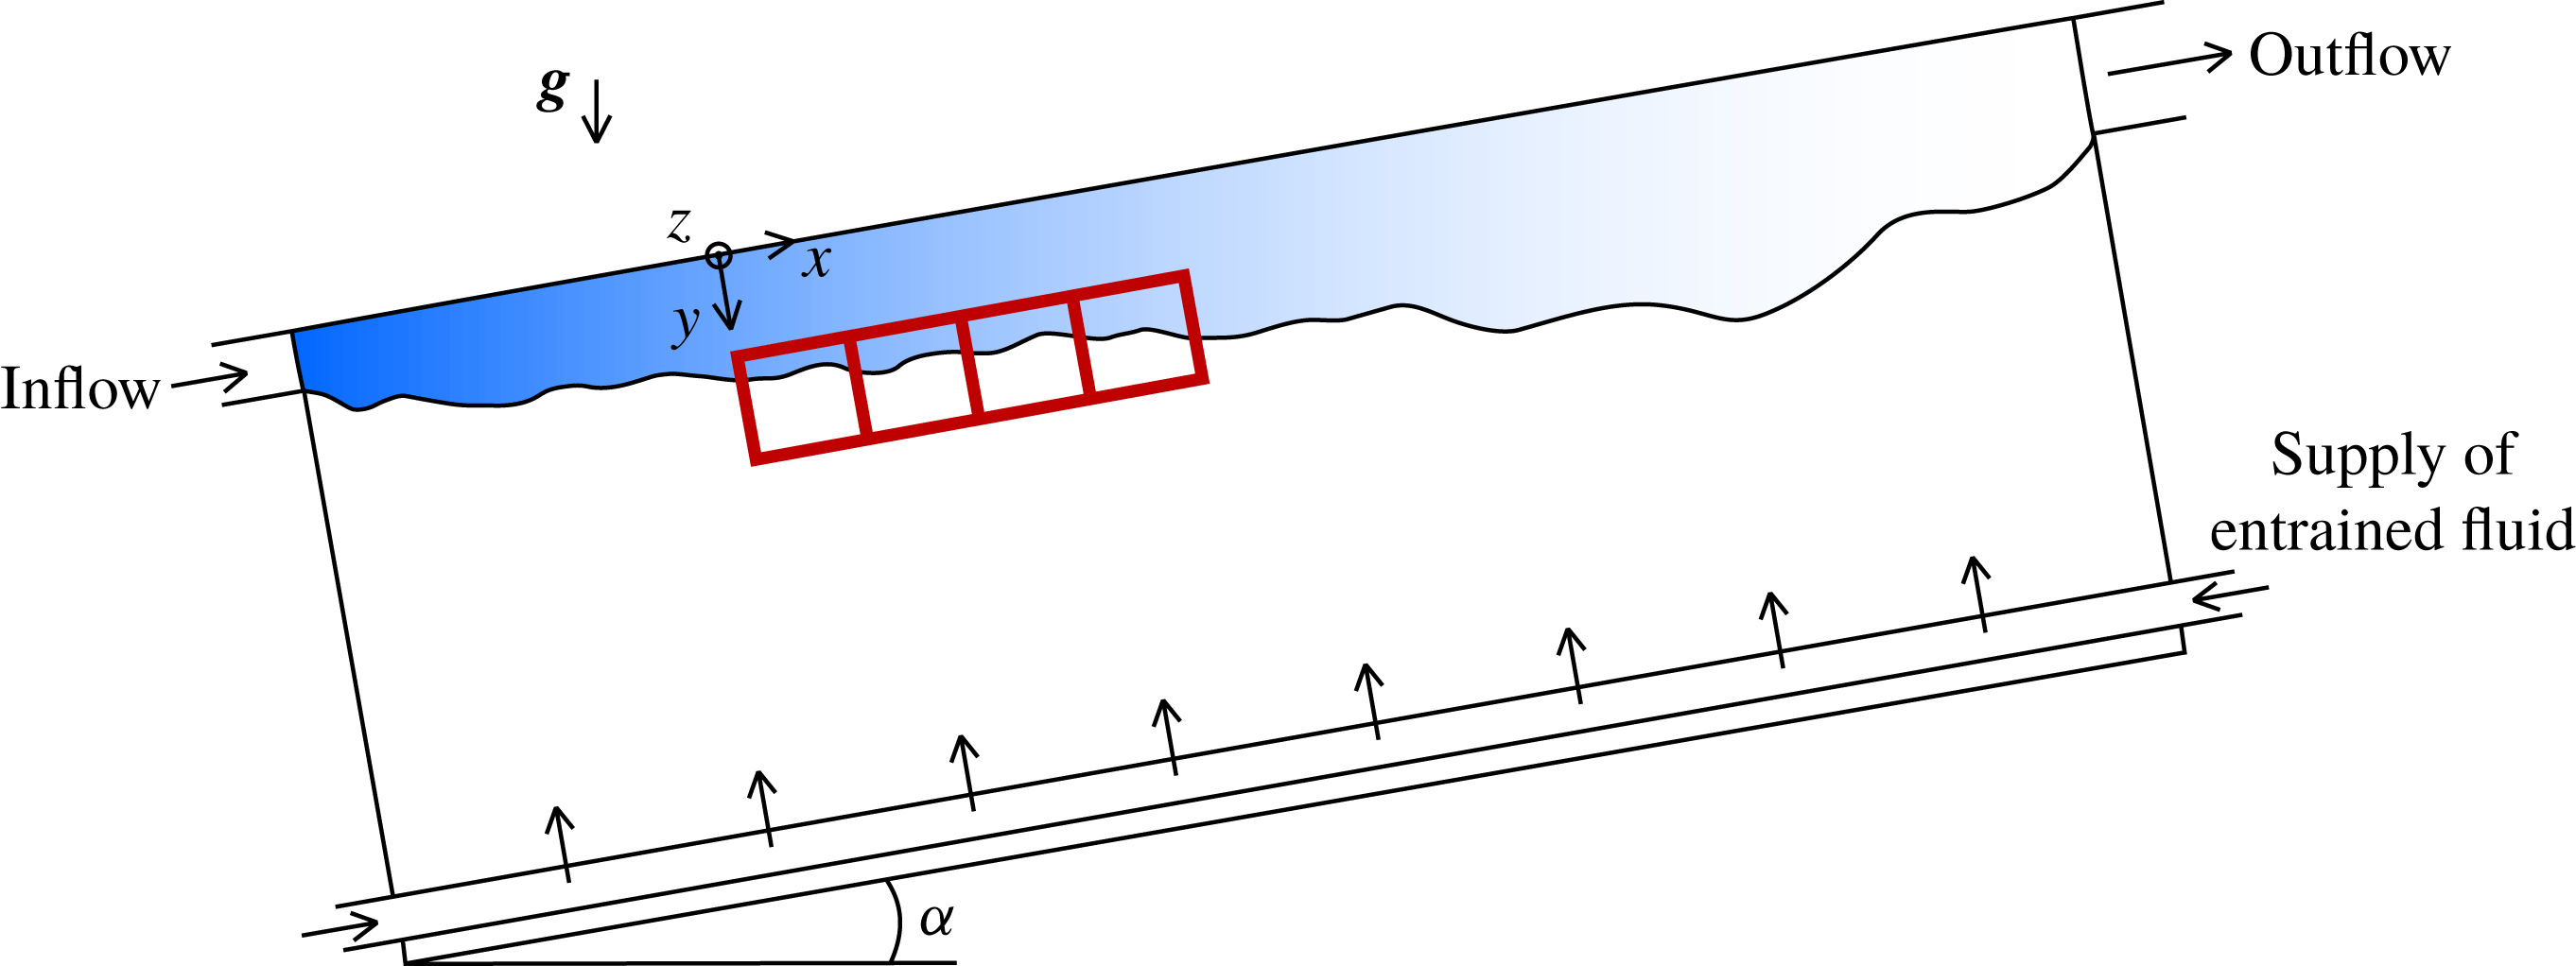
Sketch of the experimental set-up. The blue area indicates the gravity current (lighter turbulent fluid) that flows along the top wall of the tank. At the bottom, heavy fluid is resupplied to make up for the entrained flux, while mixed fluid spills out of the tank through the outlet at the top end of the tank. The four 3-D PTV investigation domains are indicated by red rectangles.

The paper is organized as follows. In § 2 we describe the experimental measurements, together with the TNTI identification and VLCSs eduction methods. Then in § 3 we characterize the VLCSs and analyse their relationship with the TNTI and the entrainment process. The article closes with the discussion and conclusions in § 4.
2 Methods
2.1 Experiments
The gravity current data presented here were collected using the experimental apparatus developed in Krug et al. (Reference Krug, Holzner, Lüthi, Wolf, Kinzelbach and Tsinober2013). This set-up is sketched in figure 1 and was designed to create a gravity current along the top of an inclined glass tank, which can be tilted between 0 and
 $90^{\circ }$
and whose dimensions are 2 m long and 0.5 m wide and high. The gravity current was realized by the continuous injection of a light fluid (a mixture of water and ethanol) along the top wall of the tank into a denser ambient fluid (a mixture of water and sodium chloride). As outlined in detail in Krug et al. (Reference Krug, Holzner, Lüthi, Wolf, Tsinober and Kinzelbach2014), a proper preparation of the solutions provides the desired density difference, while keeping the same refractive index in the two solutions. The latter is a crucial requirement for optical measurement techniques. During the experiment, the flow rate of the light fluid is driven by a water pump, measured via a flowmeter and its feedback is implemented as a closed-loop control. In this way, a constant flow rate is guaranteed throughout the entire experiment. The natural transition to turbulence of the light fluid via Kelvin–Helmholtz instabilities requires an impracticably long tank (for a discussion, see Krug et al. (Reference Krug, Holzner, Lüthi, Wolf, Kinzelbach and Tsinober2013)). It was therefore preferred to force the transition to turbulence at the inlet by means of a diffuser equipped with rotating flapping grids. In previous experimental studies by Krug et al. (Reference Krug, Holzner, Lüthi, Wolf, Kinzelbach and Tsinober2013) and Odier, Chen & Ecke (Reference Odier, Chen and Ecke2014), it was shown that with this system the turbulence characteristics at a location sufficiently ‘far’ from the inlet, as in the case of the present study, are independent of the inflow turbulence. The ambient entrained fluid was gently resupplied along the bottom of the tank to replenish entrained fluid. As noted by Krug et al. (Reference Krug, Holzner, Lüthi, Wolf, Kinzelbach and Tsinober2013), the particular value of the flow rate of the ambient fluid does not influence the entrainment rate; however, a proper choice of it avoids large-scale recirculation within the tank.
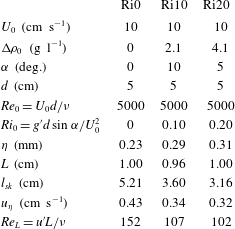
Overview of flow parameters for the three flow cases. The subscript 0 indicates the inflow parameters.

In this paper, we present results for three different flow cases. They differ in the initial density difference between the two solutions
 $\unicode[STIX]{x0394}\unicode[STIX]{x1D70C}_{0}$
and the tank inclination
 $\unicode[STIX]{x1D6FC}$
. An overview of the flow parameters is presented in table 1. To compute the inflow Reynolds number,
 $Re_{0}$
, and the inflow Richardson number,
 $Ri_{0}$
, we used the inlet height
 $d$
and the mean inflow velocity
 $U_{0}$
. Note that the label of the flow cases designates the respective value of
 $Ri_{0}$
. As shown by Ellison & Turner (Reference Ellison and Turner1959), a gravity current adjusts itself to an equilibrium
 $Ri$
number that depends only on the inclination of the tank
 $\unicode[STIX]{x1D6FC}$
. Recently, Negretti, Flòr & Hopfinger (Reference Negretti, Flòr and Hopfinger2017) demonstrated that, for a gravity current at the onset of the turbulence, the equilibrium Richardson number depends also on the inflow interfacial Richardson number. Maintaining a constant inflow velocity
 $U_{0}$
, we varied
 $\unicode[STIX]{x0394}\unicode[STIX]{x1D70C}_{0}$
such that the resulting flow is close to the equilibrium state near the inflow. This was guided by the numerical results of Krug et al. (Reference Krug, Holzner, Marusic and van Reeuwijk2017b
) and van Reeuwijk, Holzner & Caulfield (Reference van Reeuwijk, Holzner and Caulfield2019).
2.2 Measurements
Flow measurements were performed using three-dimensional particle tracking velocimetry (3-D PTV). In order to capture a large investigation volume while maintaining a fine spatial resolution, which is crucial for the VLCS extraction method used here, we performed measurements using four separate 3-D PTV systems. Their individual measurement domains were then stitched together in the streamwise direction. Each 3-D PTV system consisted of one high-speed camera (Mikrotron EoSens) equipped with a four-way image splitter to mimic a classical four-camera set-up, which allowed a continuous recording of 120 s. The light source for illumination was a diode-pumped Nd:YLF laser (Quantronix, Darwin Duo, 527 nm). As flow tracers, we used neutrally buoyant polyamide particles with a mean diameter of
 $100~\unicode[STIX]{x03BC}\text{m}$
(manufactured by Evonik Industries, Germany).
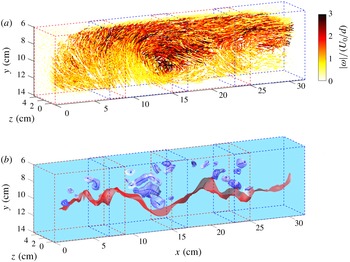
(a) Three-dimensional fluid trajectories colour-coded with the norm of the vorticity for the flow case Ri20. The time period shown here is equivalent to three turnover times (defined in § 2.4) of the largest eddies. The four alternated red and blue rectangular outlines represent the four 3-D PTV observation volumes. (b) The corresponding 3-D VLCSs, represented by blue tubular surfaces (boundaries) surrounding one-dimensional (1-D) curves (centres), and the TNTI of the gravity current (red open surface). The region above the TNTI is turbulent, whereas below the flow is irrotational.

Each single 3-D PTV system covered an observation volume of approximately
 $9~\text{cm}\times 9~\text{cm}\times 4~\text{cm}$
in the
 $x$
(streamwise),
 $y$
(wall-normal) and
 $z$
(spanwise) directions, respectively. The fields of view of the individual PTV systems overlapped for approximately
 $2~\text{cm}$
to track particles continuously across the different observation volumes. The start of the measurement volume was located approximately
 $50~\text{cm}$
away from the inlet and covered roughly
 $31~\text{cm}$
in the streamwise direction (figure 2). For each observation volume, it was possible to track up to 3000 particles simultaneously. This corresponds to a mean interparticle distance of approximately 3.5 mm, equivalent to roughly
 $10\unicode[STIX]{x1D702}$
, with
 $\unicode[STIX]{x1D702}=(\unicode[STIX]{x1D708}^{3}/\unicode[STIX]{x1D716})^{1/4}$
being the Kolmogorov microscale, where
 $\unicode[STIX]{x1D708}$
is the kinematic viscosity and
 $\unicode[STIX]{x1D716}=u^{\prime 3}/L$
is the local dissipation. Here,
 $u^{\prime }$
is the root mean square (r.m.s.) of the velocity fluctuation and
 $L$
is the integral length scale of the turbulence, evaluated as the integral of the autocorrelation function of the streamwise velocity along
 $x$
. The turbulence level was quantified through the integral Reynolds number
 $Re_{L}=u^{\prime }L/\unicode[STIX]{x1D708}$
(table 1). As can be observed, the stable stratification reduces the turbulence level. Reference length and time scales were evaluated at a height of approximately 7 cm from the top wall, a location that is far from the wall but still sufficiently far from the strongly intermittent region close to the TNTI. The spatial resolution achieved in our experiments is not sufficiently accurate to resolve the Kolmogorov scale. However, it was considered adequate for the purposes of the present work and a suitable compromise between a large enough spatial domain and spatial resolution. As shown by Krug et al. (Reference Krug, Holzner, Marusic and van Reeuwijk2017b
), the smallest convolutions of the TNTI are of the order of
 $10\unicode[STIX]{x1D702}$
and the TNTI geometry is therefore sufficiently captured by our measurements. The LCS extraction method explained below is based on vorticity. Given that the vorticity is somewhat under-resolved in our measurements, the extracted VLCSs represent those of a filtered velocity field, where we neglect the effect of Kolmogorov-sized eddies. The time resolution was set to 250 Hz, which oversamples approximately 20 times
 $\unicode[STIX]{x1D70F}_{\unicode[STIX]{x1D702}}$
, with
 $\unicode[STIX]{x1D70F}_{\unicode[STIX]{x1D702}}=(\unicode[STIX]{x1D708}/\unicode[STIX]{x1D716})^{1/2}$
being the Kolmogorov time scale. We applied a temporal Savitzky–Golay filter with a span of 0.5
 $\unicode[STIX]{x1D70F}_{\unicode[STIX]{x1D702}}$
to the velocity data. This reduced experimental noise due to position uncertainty of tracked tracer particles (Lüthi, Tsinober & Kinzelbach Reference Lüthi, Tsinober and Kinzelbach2005; Wolf et al.
Reference Wolf, Lüthi, Holzner, Krug, Kinzelbach and Tsinober2012).
A well-known feature of experimental particle tracking data is that particle trajectories have variable length and may be partly interrupted due to, for example, optical occlusions. However, the LCS extraction method explained below requires un-interrupted trajectories. We therefore interpolated the Lagrangian velocity data on an Eulerian grid with a spacing of
 $5\unicode[STIX]{x1D702}$
. Subsequently we advected fluid particles numerically from these Eulerian velocity fields. A similar procedure has been applied for example by Ouellette (Reference Ouellette2012). In figure 2, we show samples of numerically computed fluid trajectories. To estimate the error of numerically calculated fluid particle trajectories, we used the longest measured trajectories and computed the r.m.s. distance between particle positions at the end of the trajectories. For one full flow-through time of the entire volume, we obtained an acceptable value of approximately one Kolmogorov length scale.
2.3 TNTI identification and local entrainment velocity
Following previous work, the identification of the TNTI was done using a threshold on the enstrophy field,
 $\unicode[STIX]{x1D714}^{2}=\unicode[STIX]{x1D74E}\boldsymbol{\cdot }\unicode[STIX]{x1D74E}$
, where
 $\unicode[STIX]{x1D74E}$
is the vorticity vector (see e.g. Holzner et al.
Reference Holzner, Liberzon, Nikitin, Lüthi, Kinzelbach and Tsinober2008; Krug et al.
Reference Krug, Holzner, Lüthi, Wolf, Kinzelbach and Tsinober2015). The TNTI location is then defined by an isosurface corresponding to a specific
 $\unicode[STIX]{x1D714}_{th}^{2}$
threshold. In the present investigation, the threshold was fixed at
 $\unicode[STIX]{x1D714}_{th}^{2}=2.5~\text{s}^{-2}$
just above the noise level of the data. This value is very close to those chosen by Krug et al. (Reference Krug, Holzner, Lüthi, Wolf, Kinzelbach and Tsinober2015) for the same flow and by Wolf et al. (Reference Wolf, Lüthi, Holzner, Krug, Kinzelbach and Tsinober2012) for a turbulent jet. The local velocity propagation of the TNTI surface with respect to the fluid particles, the entrainment velocity
 $v_{n}$
, was estimated using the direct approach, presented by Wolf et al. (Reference Wolf, Lüthi, Holzner, Krug, Kinzelbach and Tsinober2012). In their approach,
 $v_{n}$
is computed from
 $$\begin{eqnarray}v_{n}=v_{\unicode[STIX]{x1D714}_{th}^{2}}-v_{f},\end{eqnarray}$$
where
 $v_{\unicode[STIX]{x1D714}_{th}^{2}}$
is the local velocity of TNTI and
 $v_{f}$
is the local flow velocity. To determine
 $v_{\unicode[STIX]{x1D714}_{th}^{2}}$
, we used the positions of the
 $\unicode[STIX]{x1D714}_{th}^{2}$
isosurface at consecutive time steps. Similar to the velocity data, we also applied a temporal filter to the measured TNTI interface locations to remove occasional spurious outliers in the irrotational region.
2.4 VLCSs eduction
The detection of the Lagrangian coherent vortices is based on LAVD theory. We recall the definition of LAVD,
 $$\begin{eqnarray}LAVD_{t_{0}}^{t}(x_{0})=\int _{t_{0}}^{t}|\unicode[STIX]{x1D74E}(x(s,x_{0}),s)-\bar{\unicode[STIX]{x1D74E}}(s)|\,\text{d}s,\end{eqnarray}$$
where
 $\unicode[STIX]{x1D74E}$
is the vorticity along fluid trajectories,
 $\bar{\unicode[STIX]{x1D74E}}$
is its spatial average and
 $x(t,x_{0})$
denotes the fluid trajectory starting at
 $x_{0}$
at time
 $t_{0}$
. According to Haller et al. (Reference Haller, Hadjighasem, Farazmand and Huhn2016), a rotational Lagrangian coherent vortex is defined as an evolving material domain filled with a nested family of tubular surfaces of
 $LAVD_{t_{0}}^{t}(x_{0})$
with outward-decreasing LAVD values. The boundary of the VLCS is the outermost tubular level surface, whereas its centre is the innermost member of the LAVD level-surface family. LAVD-based methods have been successfully applied in the past to 2-D data of satellite oceanic velocity fields and direct numerical simulation of forced turbulence, as well as to 3-D data of the ocean model ‘SOSE’ (Haller et al.
Reference Haller, Hadjighasem, Farazmand and Huhn2016). Prior applications of the detection method to 3-D data utilized the physics and geometry of the problem to simplify the extraction of the structures. For example, the 3-D vortex extracted by Haller et al. (Reference Haller, Hadjighasem, Farazmand and Huhn2016) from the ‘SOSE’ model is a single vertically oriented structure. In the present study, we implemented this method for extraction of multiple 3-D vortical structures without prior knowledge on the physics or geometry. Our algorithm can be described as a two-step procedure. In the first step, we compute 1-D curves representing the centre of the structures, and in a second step, we determine the boundaries of the VLCSs.
In Haller et al. (Reference Haller, Hadjighasem, Farazmand and Huhn2016), the centres of VLCSs are defined by 1-D ridges of the LAVD field. In general, the computation of 1-D ridges in three dimensions is a challenging task. In the present work, we address this task by extending the 2-D ‘gradient climbing’ algorithm proposed by Mathur et al. (Reference Mathur, Haller, Peacock, Ruppert-Felsot and Swinney2007) to three dimensions. This algorithm uses the property that trajectories computed on the gradient field of a scalar quantity tend to accumulate along the ridges of the scalar field. The final position of these trajectories can be exploited to determine 1-D candidates for ridge identification. Our ridge extraction algorithm is implemented as follows:
(i) For any initial time
 $t_{0}$
, we determine narrow regions in the neighbourhood of ridges where the magnitude of the
$\unicode[STIX]{x1D735}LAVD$
is higher than a predefined threshold and use points inside these regions as the initial conditions for computing numerically the solutions
$\boldsymbol{x}_{0}(t)$
of the gradient dynamical system: (2.3)where$$\begin{eqnarray}\frac{\text{d}\boldsymbol{x}_{0}}{\text{d}t}=\unicode[STIX]{x1D735}LAVD_{t_{0}}^{t_{0}+T}(\boldsymbol{x}_{0}),\end{eqnarray}$$
$t$
denotes the time and
$\unicode[STIX]{x1D735}$
denotes the spatial gradient with respect to the initial position
$\boldsymbol{x}_{0}$
. The solution
$\boldsymbol{x}_{0}(t)$
takes the initial conditions to the closest ridge along the local gradient field of the LAVD.
(ii) For a given initial condition, the computation of the corresponding solution
$\boldsymbol{x}_{0}(t)$
is stopped if the following two conditions hold: (a) the Hessian matrix
$\unicode[STIX]{x1D6FB}^{2}LAVD_{t_{0}}^{t_{0}+T}(\boldsymbol{x}_{0}(t))$
has at least two negative eigenvalues (a prerequisite for a point to be on a ridge), and (b) the angle between the eigenvector
$\boldsymbol{e}_{t_{0}}^{t_{0}+T}(\boldsymbol{x}_{0}(t))$
corresponding to the smaller-in-norm eigenvalue of the Hessian matrix
$\unicode[STIX]{x1D6FB}^{2}LAVD_{t_{0}}^{t_{0}+T}(\boldsymbol{x}_{0}(t))$
and
$\unicode[STIX]{x1D735}LAVD_{t_{0}}^{t_{0}+T}(\boldsymbol{x}_{0}(t))$
shows no appreciable change (a sign of closeness to a nearby ridge). For large enough
$T$
, the eigenvector
$\boldsymbol{e}_{t_{0}}^{t_{0}+T}(\boldsymbol{x}_{0}(t))$
will be approximately tangent to a ridge.(iii) To determine the ridge candidates, we use the final positions of the solutions
$\boldsymbol{x}_{0}(t)$
and select among them only points with a sufficiently close neighbouring point. To this end, we use a predefined threshold on the distance between two points.(iv) We then group together points belonging to the same ridge and order them. To order the points, we sort them in ascending order with respect to their
$x$
,
$y$
and
$z$
coordinates and select among the three sets the one that minimizes the curve arclength.(v) Finally, we smooth the ridges. By parametrizing their
$x$
,
$y$
and
$z$
coordinates with respect to the arclength, we fit them with a cubic smoothing spline.








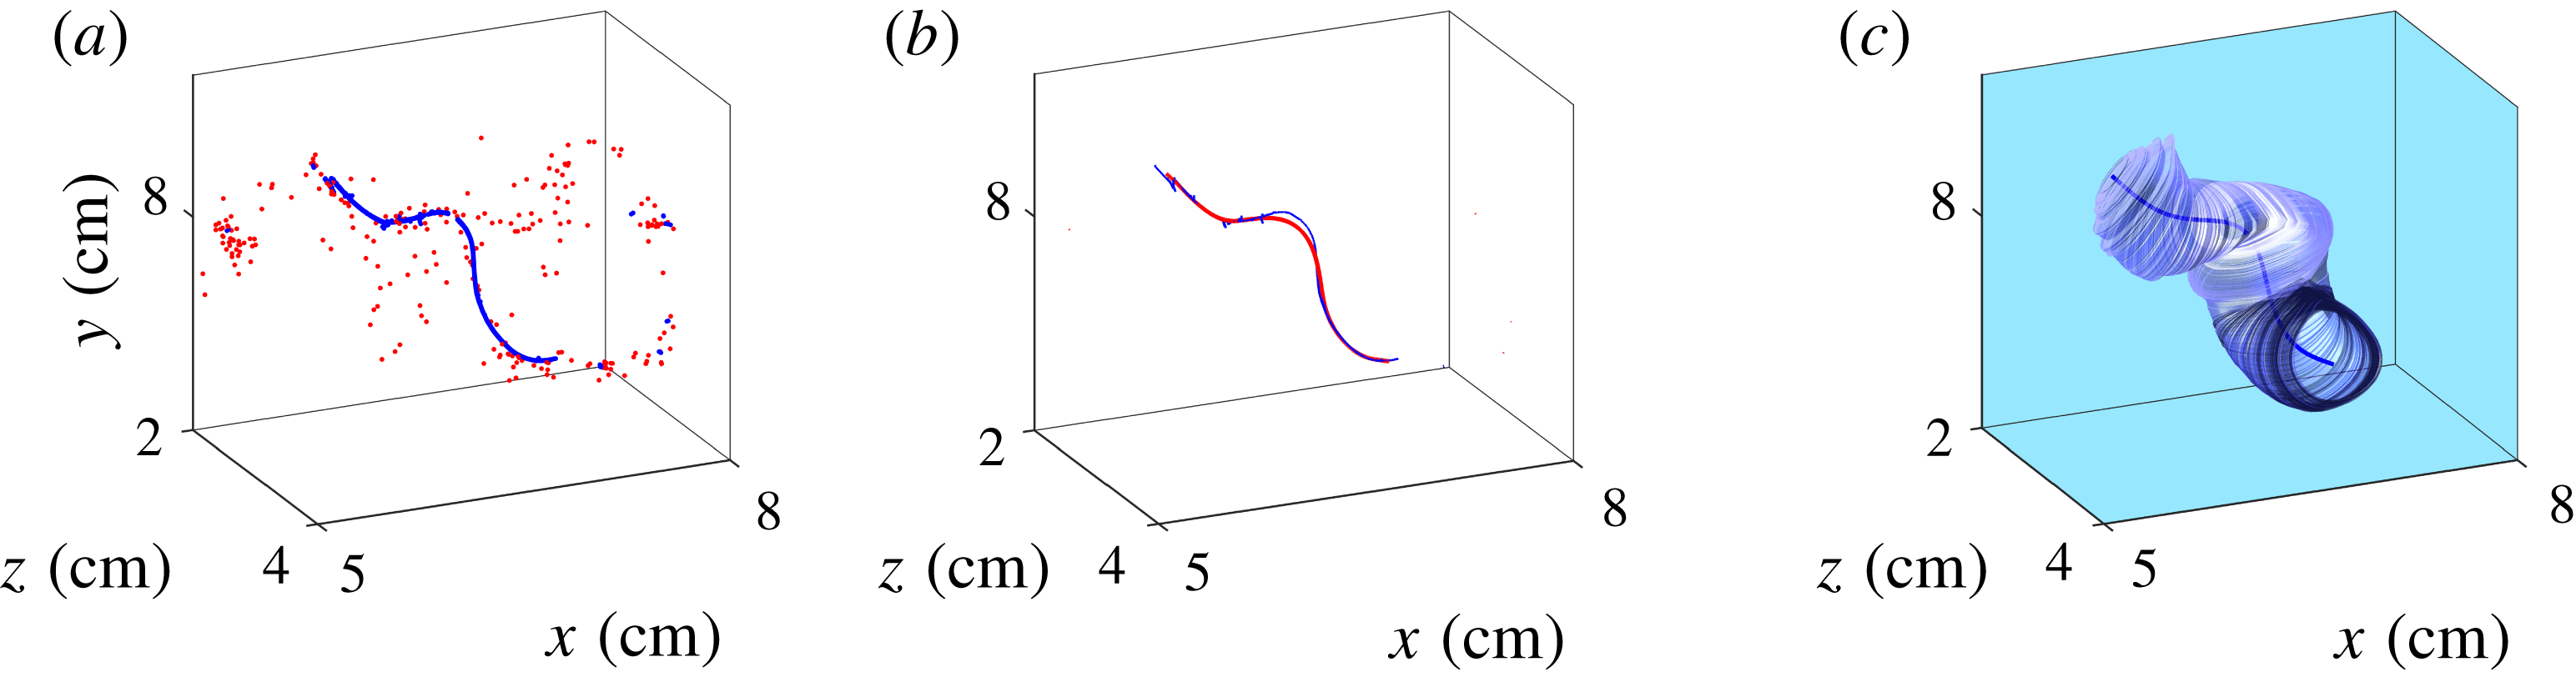
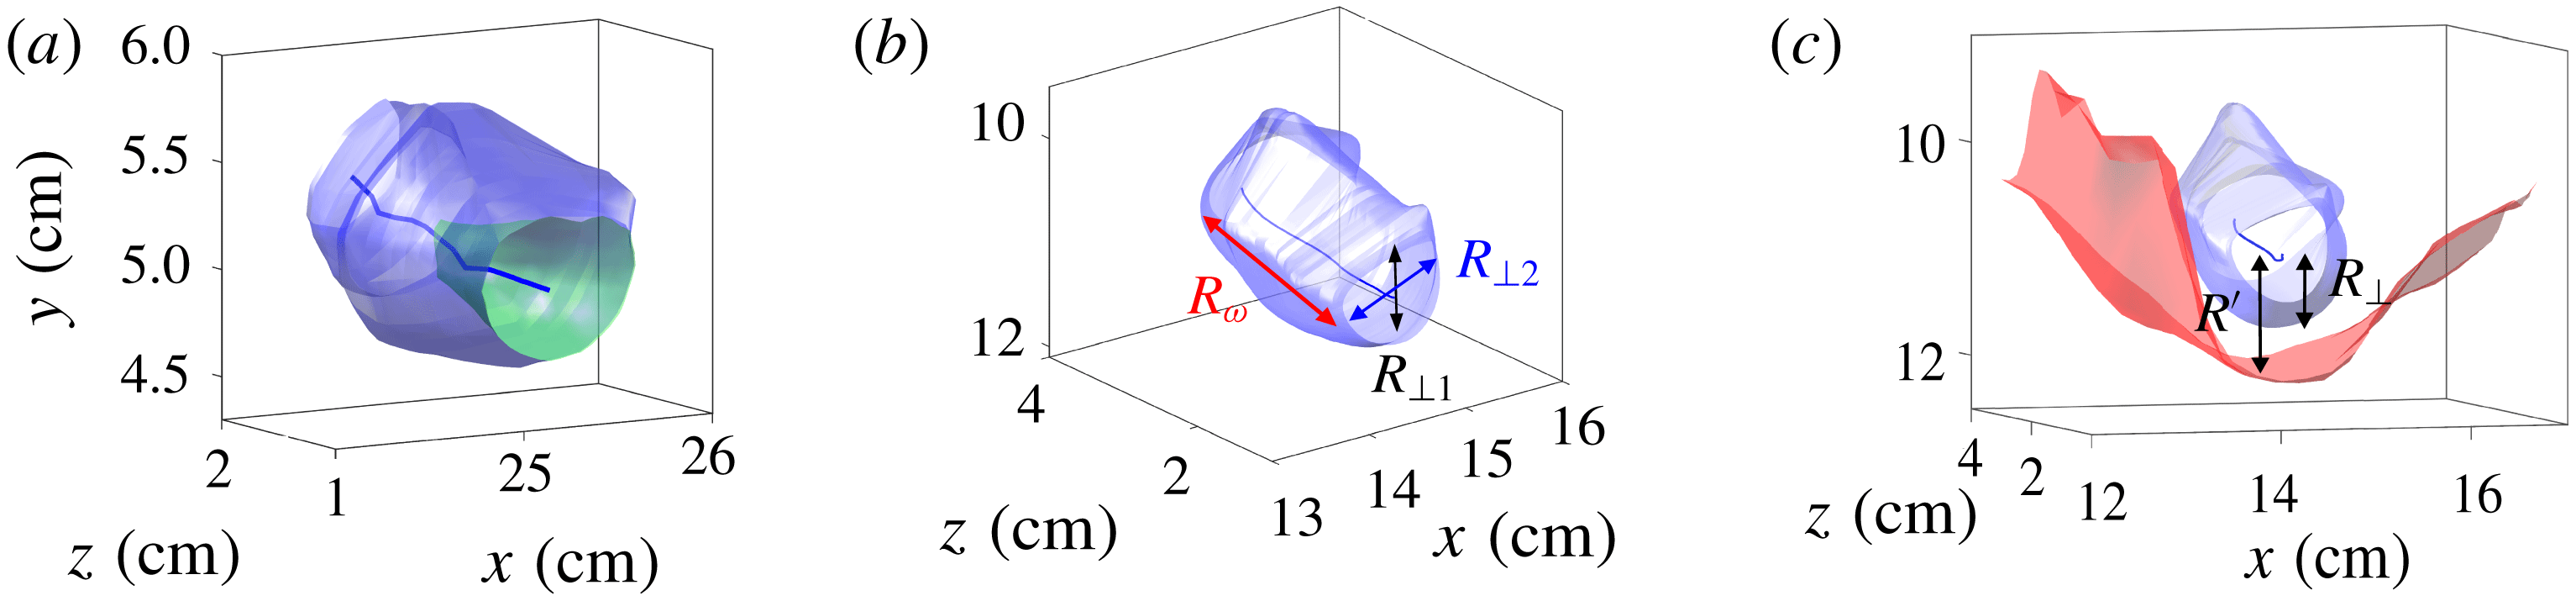
In figure 3, we show an example of the application of the last three steps described above. In this case, part of the points in ridge proximity are not aligned along a 1-D curve (figure 3 a). We therefore select only points with sufficiently close neighbouring points, sort them (blue curve in figure 3 b) and apply a smoothing cubic spline (long blue curve in figure 3 c).
After computing the centres of structures, we determined their boundaries using the following steps:
(i) For each point of a given ridge, we erect pointwise normal planes to the ridge curve and determine the in-plane outermost almost-convex LAVD contour that encircles the point. These curves are 1-D curves in three dimensions.
(ii) We then use these curves to build the VLCSs boundaries. This is achieved for every pair of nearby curves by using the MATLAB function ‘convhull’ to compute the lateral surface connecting them.
In figure 3(c), we show the result of the application of these steps to the ridges shown in figure 3(b). The second step of the construction of the boundaries of the VLCS is slightly different from the one described in Haller et al. (Reference Haller, Hadjighasem, Farazmand and Huhn2016) in that these authors use tubular level surfaces of a fixed LAVD value. We observed that tubular LAVD level surfaces typically enclosed only part of the LAVD ridges. That is, although perfectly aligned to the structure’s centre and enclosed by almost-convex contours, part of the ridge remained outside of the structure (see the example in figure 4 a), which is why we preferred to use the union of almost-convex contours. To give an impression of how the method performs on our data, we show several VLCSs in figure 2(b). These are composed of tubular surfaces enclosing 1-D curves (centres), in the proximity of the TNTI, represented in the form of an open surface. Here, the portion of the volume above the TNTI, where the VLCSs are located, corresponds to the turbulent part, whereas the lower side corresponds to the irrotational flow. While some of the structures lie ‘far’ from the TNTI, others are located close to it. The latter appear to shape the interface locally, as can be gleaned from figure 4(c). This aspect will be investigated further in § 3.2.
Example of VLCS extraction. In (a), the final position of the solution
 $\boldsymbol{x}_{0}(s)$
of (2.3) is shown. The blue dots are selected for the ridge construction, whereas the red ones are discarded. In (b), in blue, the connection of the points selected in (a) and its smooth fitting curve (red) are shown. The corresponding VLCS is shown in (c).

In the following, we discuss the effect of the extraction time
 $\unicode[STIX]{x0394}t$
on the detected VLCSs, to explain how
 $\unicode[STIX]{x0394}t$
was chosen for the present data. We remark that, for short extraction times, in the limit of
 $\unicode[STIX]{x0394}t\rightarrow 0$
, VLCSs tend to their Eulerian counterparts (see Haller Reference Haller2015). In this case, the material coherence is guaranteed only instantaneously, in the sense that there is no certainty that an Eulerian structure remains coherent over any observation time
 $\unicode[STIX]{x0394}t>0$
. On the contrary, for very long extraction times, no coherent structure can survive since the material coherence is limited in time for unsteady flows. For the vortical structures investigated here, the relevant temporal scale is the large eddy turnover time, which can be estimated as
 $t^{\ast }=L/u^{\prime }$
.
For the measurement set-up adopted in this work, there is a natural upper limit for
 $\unicode[STIX]{x0394}t$
. This is related to the residence time of a fluid particle in the observation volume (i.e. the time spent by a particle inside the measurement volume). For the portion of the measurement volume closer to the wall, we observed that the residence time varies between one and four turnover times. In order to set the extraction time in formula (2.2), we tested different
 $\unicode[STIX]{x0394}t$
values between zero (Eulerian proxy) and the maximum (
 $4t^{\ast }$
) and investigated their effect in terms of
 $V_{VLCS}$
, the average volume of a single VLCS. As can be observed in table 2,
 $V_{VLCS}$
is weakly influenced by the extraction time, at least in the range
 $t^{\ast }\leqslant \unicode[STIX]{x0394}t\leqslant 4t^{\ast }$
. The same applies to other properties related to the size, the shape and the orientation of the VLCSs (not shown). The extraction time has a considerable impact on the number of structures that can be extracted using our measurement set-up. As
 $\unicode[STIX]{x0394}t$
increases, the number of trajectories entirely contained in the observation volume decreases drastically. This reduces the available volume for the VLCS extraction and thus the number of structures that can be educed. As a consequence of this and observing that the extraction time appears to influence only weakly the characteristics of VLCSs, we opted to use
 $\unicode[STIX]{x0394}t=t^{\ast }$
. We checked that qualitatively all results and conclusions remain the same for longer extraction times, albeit with reduced statistics.
(a) VLCS reconstruction following the algorithm of Haller et al. (Reference Haller, Hadjighasem, Farazmand and Huhn2016) (green inner surface) and the modified algorithm introduced here (blue outer surface). (b) Schematic of VLCS dimensions. (c) Schematic representation of
 $R_{\bot }$
, VLCS (blue) cross-sectional size and
 $R^{\prime }$
, the distance between VLCS centre and the TNTI (red).

Average volume of the single VLCS,
 $V_{VLCS}$
, for different extraction times of the flow case Ri20.

2.5 VLCS size and orientation
Given the three-dimensionality of VLCSs investigated here, we defined three characteristic dimensions (figure 4
b): one along the VLCS’s rotation axis and two in the cross-section. The two cross-sectional sizes are measured as follows. At each point of the centreline of the structure, we computed the pointwise perpendicular plane to the centreline. We then evaluated the intersection between this plane and the VLCS’s boundary and we fitted an ellipse to the intersection points. By taking the average of the minor and major axes of the fitted ellipses, we assigned to each VLCS:
 $R_{\bot 1}$
(the minor) and
 $R_{\bot 2}$
(the major cross-sectional size). The third dimension,
 $R_{\unicode[STIX]{x1D714}}$
, is given by the length of the axis of rotation. As can be observed in figure 2(b), some of the vortices are truncated in the rotation axis direction by the boundaries of the measurement domain. In such a case, we made an estimation of
 $R_{\unicode[STIX]{x1D714}}$
based on a quadratic fit. The fit was done in one dimension using the average values between
 $R_{\bot 1}$
and
 $R_{\bot 2}$
along the rotation axis and using the zero crossing of the fitted curve. That is, we assumed that
 $R_{\unicode[STIX]{x1D714}}$
is finite and represented by the spatial distance between two cross-sections with zero area.
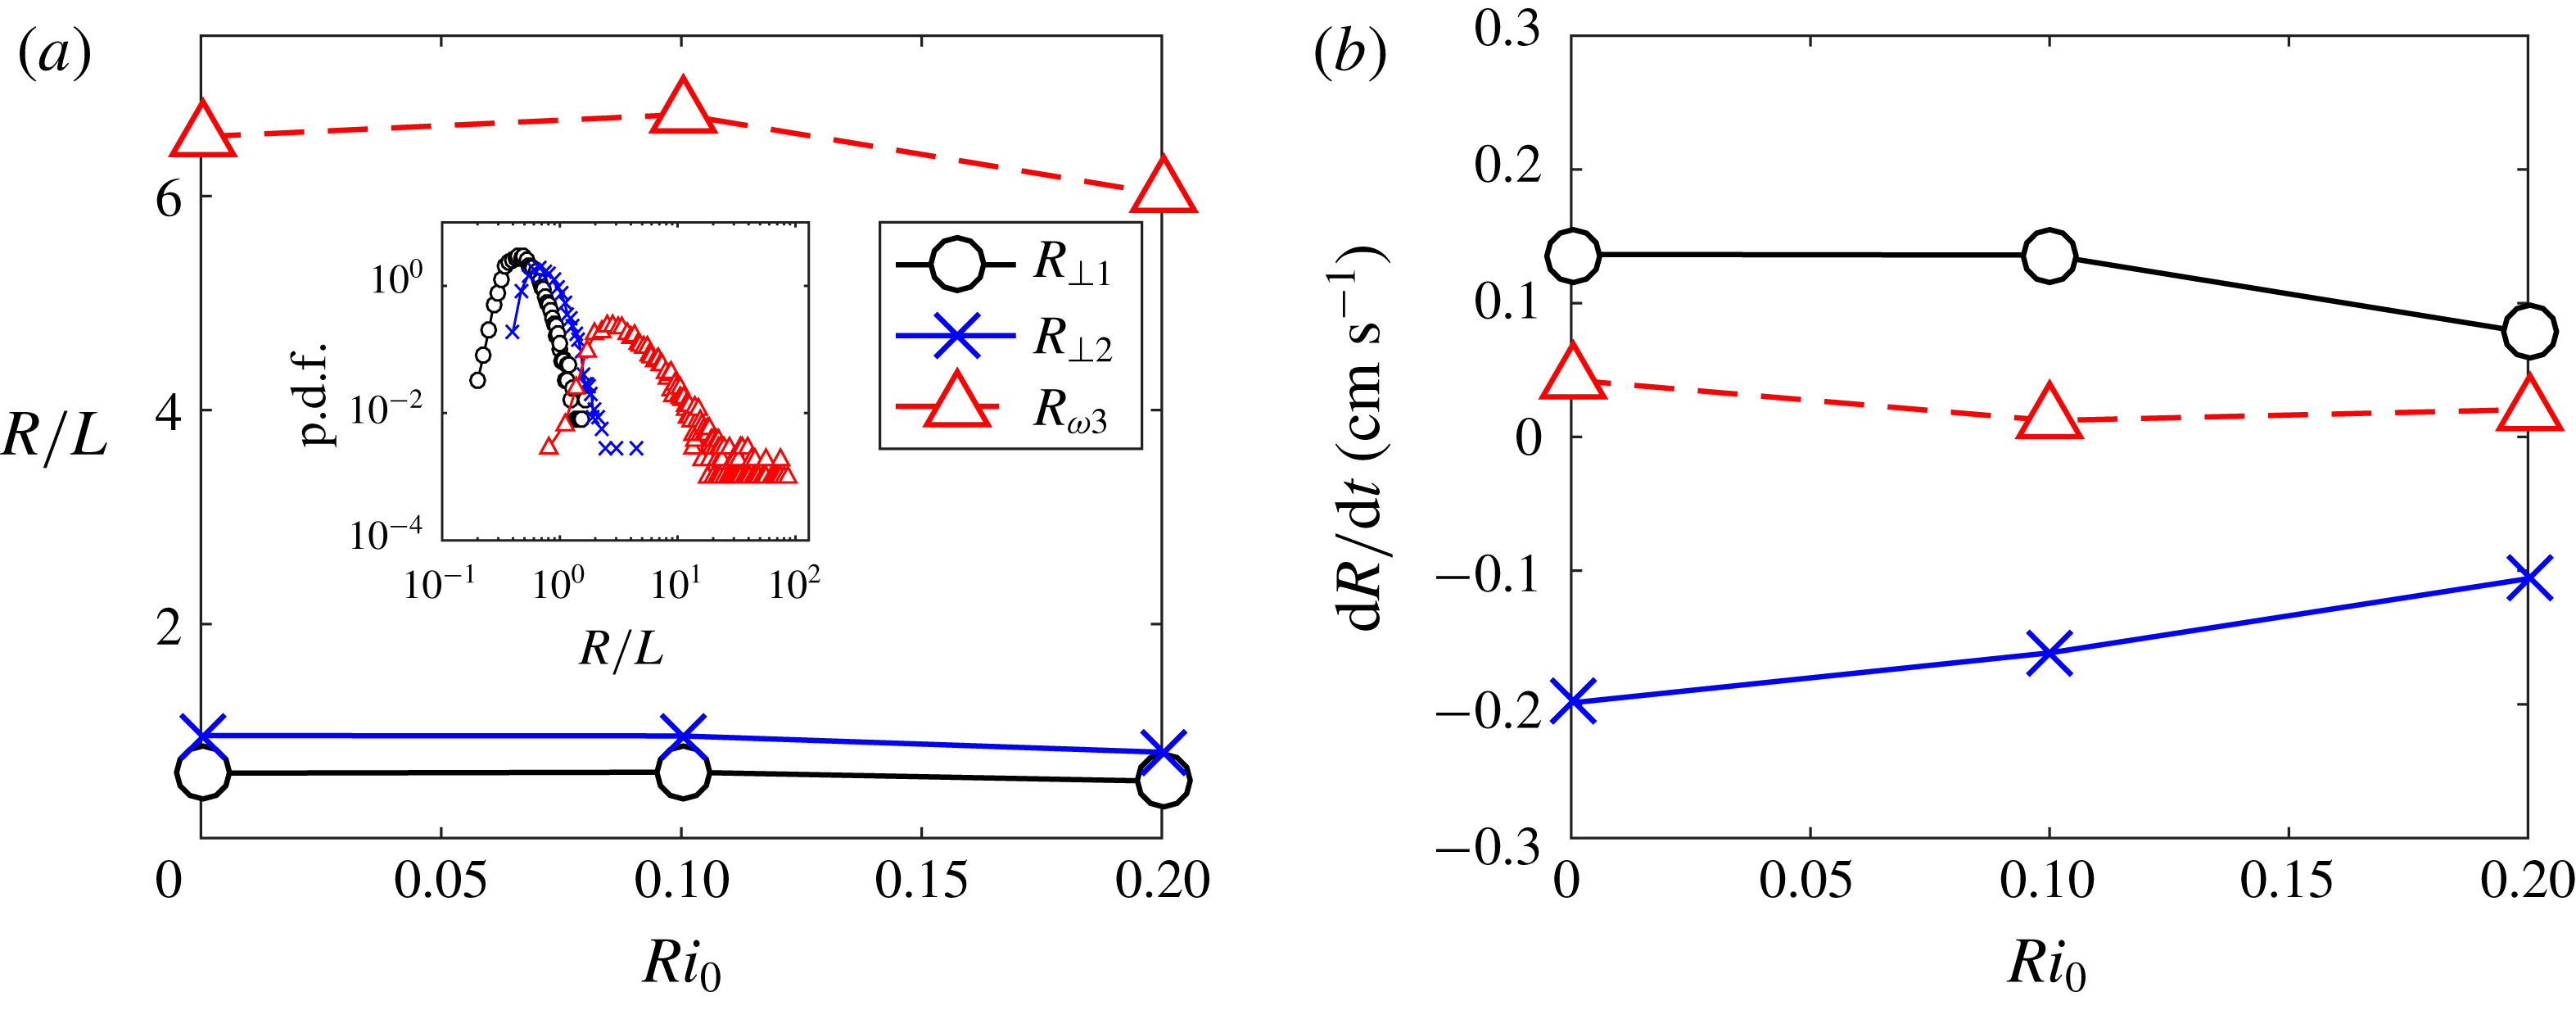
Average VLCS dimensions (a) and their growth rates (b) as functions of the initial Richardson number
 $Ri_{0}$
.

The orientation of the VLCSs was assessed by computing the average unit vector
 $\boldsymbol{n}$
tangent to the axis of rotation.
3 Results
3.1 VLCS geometrical properties
The average size parameters of the VLCSs as a function of the initial Richardson number
 $Ri_{0}$
are presented in figure 5(a). Here, the three dimensions are normalized by the integral length scale of turbulence
 $L$
, which is almost constant for all the flow cases (see table 1). From figure 5(a), together with the observation that
 $L$
is almost constant with
 $Ri_{0}$
, it follows that the mean dimensions of the VLCSs do not vary significantly with the stratification. The cross-sectional average sizes
 $R_{\bot 1}$
and
 $R_{\bot 2}$
are equal to approximately
 $0.6L$
and
 $0.95L$
. This gives an idea of the shape of the cross-section of the structures, which on average is an ellipse with eccentricity of roughly
 $0.6$
. The average size of the third dimension, the axis of rotation
 $R_{\unicode[STIX]{x1D714}}$
, is of order
 $7L$
. If the two cross-sectional sizes are ordered as a consequence of their construction, the third dimension is technically free to vary, i.e. it can be smaller or larger than
 $R_{\bot 1}$
and
 $R_{\bot 2}$
. However, it is evident from figure 5(a) that the rotation axis of the VLCS is on average the longest one. The conclusion from this observation is that most of the structures appear to have a tubular shape. The inset in figure 5(a), in which we show the probability density functions (p.d.f.s) of the three size parameters for Ri20, gives an impression about their distribution.
The VLCS dimensions presented in figure 5(a) are measured at the initial time
 $t_{0}$
of their extraction. Solving the equation of motion between an initial time
 $t_{0}$
and a final time
 $t_{0}+\unicode[STIX]{x1D6FF}t$
for the particles constituting the centres and the boundaries of the VLCSs, it is possible to advect the structures under the flow evolution and to evaluate their final size, and hence their growth rates,
 $\text{d}R/\text{d}t$
. Here,
 $\unicode[STIX]{x1D6FF}t$
was chosen to be equal to the extraction time. The growth rates of the cross-sectional sizes were evaluated computing
 $R_{\bot 1}$
and
 $R_{\bot 2}$
as described in § 2.5 at the final time
 $t_{0}+\unicode[STIX]{x1D6FF}t$
. The growth rate of the axis of rotation was determined by the continuity equation, given that for a material structure
 $\text{d}R_{\bot 1}/\text{d}t+\text{d}R_{\bot 2}/\text{d}t+\text{d}R_{\unicode[STIX]{x1D714}}/\text{d}t=0$
. An alternative way to determine
 $\text{d}R_{\unicode[STIX]{x1D714}}/\text{d}t$
is to compute it by directly estimating
 $R_{\unicode[STIX]{x1D714}}$
as described in § 2.5 at
 $t_{0}$
(respectively
 $t_{0}+\unicode[STIX]{x1D6FF}t$
). However, we preferred the use of the continuity equation in order to avoid the inaccuracies introduced by the estimation approach of
 $R_{\unicode[STIX]{x1D714}}$
when the structure is not fully contained in the observation volume. In figure 5(b), we display the average growth rates of the VLCS dimensions as a function of
 $Ri_{0}$
. The growth rates corresponding to the minor axis and to the rotation axis are positive in sign, and thus these axes increase their sizes in time, whereas the growth rate of the major axis is negative. The positive growth of the rotation axis implies a predominant stretching of the vortical structures along the rotation axis. In general, the picture that emerges is that, under the flow evolution, the VLCSs are typically stretched and their cross-section tends towards a more isotropic shape compared to their initial conditions.
Further, figure 5(b) shows clearly that the growth rates diminish as
 $Ri_{0}$
increases. Thus, the stratification reduces the average VLCS compression (of the intermediate axis) and stretching (of the smallest and the rotation axis dimensions). We also note that for all
 $Ri_{0}$
the magnitude of average growth rates is rather small and of the order of the Kolmogorov velocity scale magnitude
 $u_{\unicode[STIX]{x1D702}}$
(see table 1), meaning that the VLCSs are on average not very strongly stretched. This result confirms our expectations, since by definition VLCSs are materially coherent structures that are not supposed to undergo very significant deformation under flow evolution.
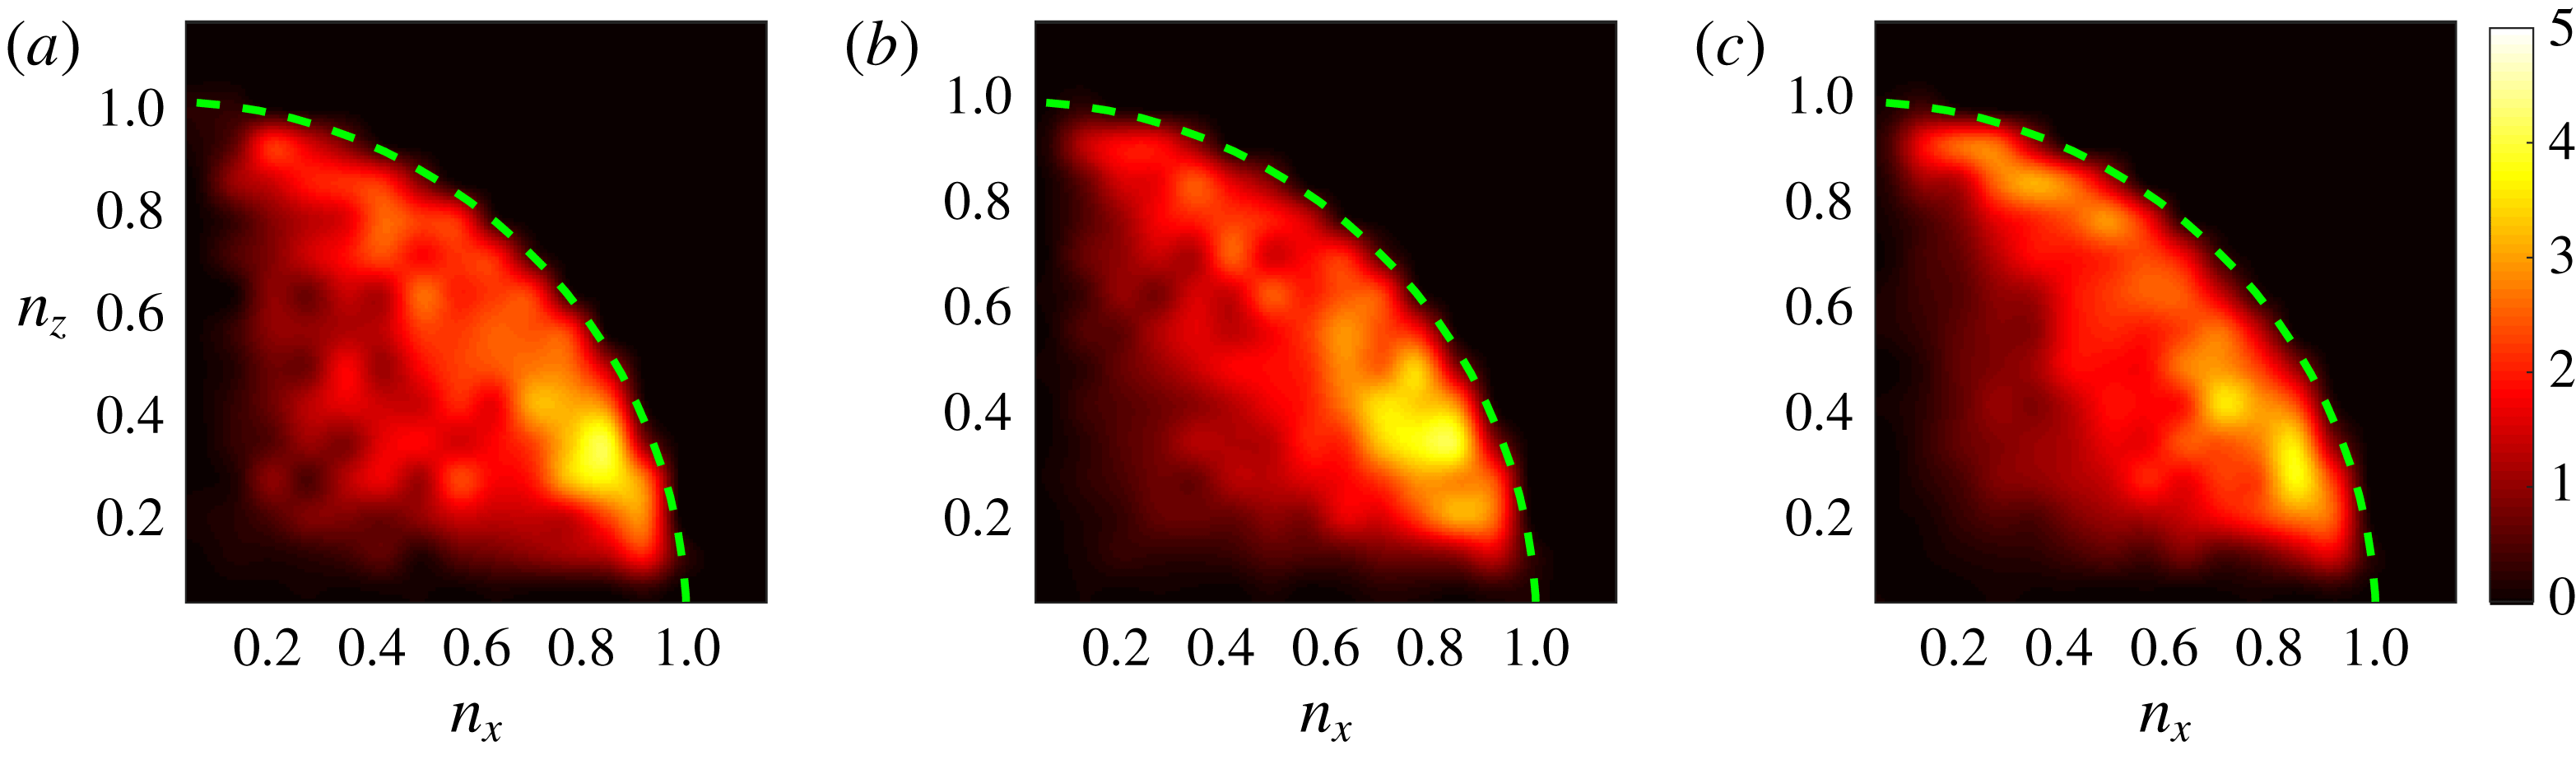
In figure 6, we present the orientation of the rotation axis of the VLCSs. Specifically, we plot the joint p.d.f.s of two components of the unit vector tangent to the axis of rotation of the VLCSs. Since there is no obvious choice in which direction the tangent vector should point, we show the absolute values of the two components.
Joint p.d.f.s of VLCS orientation in the
 $n_{x}$
–
 $n_{z}$
plane at the initial time of the detection of the VLCSs for Ri0 (a), Ri10 (b) and Ri20 (c). The wall-normal component
 $n_{y}$
can be estimated from the joint p.d.f.s, remembering that
 $n_{x}^{2}+n_{y}^{2}+n_{z}^{2}\approx 1$
.

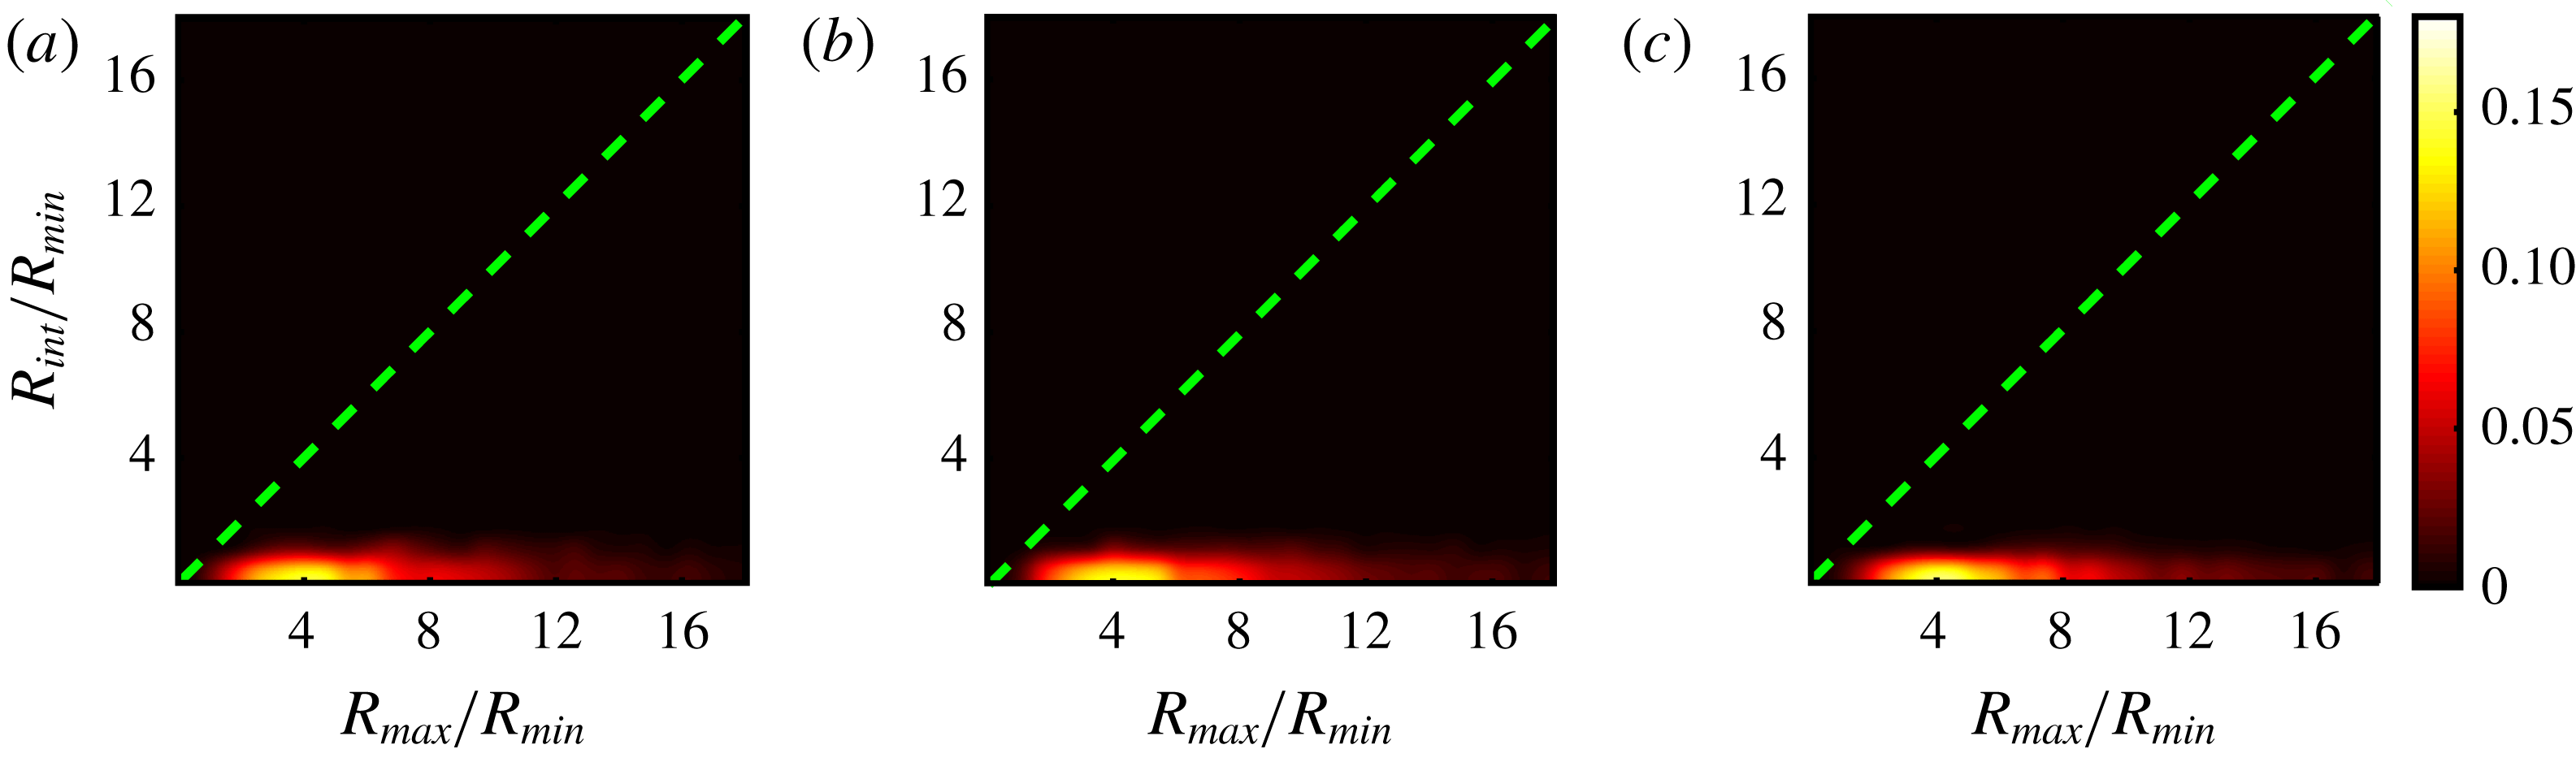
Joint p.d.f.s of VLCS shape in the
 $R_{max}/R_{min}$
and
 $R_{int}/R_{min}$
map at the initial time of the detection of the VLCSs for Ri0 (a), Ri10 (b) and Ri20 (c).

For all the flow cases, the joint p.d.f.s are biased towards values of
 $n_{x}\approx 1$
. That is, the structures exhibit a preferential orientation in the streamwise direction. Similarly, there is a sizeable probability to observe VLCSs oriented along the spanwise direction (
 $n_{z}\approx 1$
), whereas the probability of the wall-normal orientation (
 $n_{x}\approx n_{z}\approx 0$
) is not significant. As the Richardson number increases, the spanwise orientation gains some more importance at the expense of the streamwise one (figure 6
c).
To assess the shape of the structures, one can build a map of
 $R_{max}/R_{min}$
and
 $R_{int}/R_{min}$
, with
 $R_{max}$
,
 $R_{int}$
and
 $R_{min}$
representing, respectively, the major, intermediate and minor VLCS sizes. We should mention here that
 $R_{\bot 1}$
,
 $R_{\bot 2}$
and
 $R_{\unicode[STIX]{x1D714}}$
do not coincide, respectively, with
 $R_{min}$
,
 $R_{int}$
and
 $R_{max}$
for all the structures, although we observed in figure 5 that this is true on average. The map is a useful tool to determine the shape of the VLCSs. In particular, values of
 $R_{max}/R_{min}$
and
 $R_{int}/R_{min}$
close to the origin
 $(1,1)$
represent isotropic, sphere-like, structures. Values lying close to the abscissa denote tubular structures, whereas values in the proximity of the bisector denote sheet-like structures. In figure 7, we show joint p.d.f.s of the shape map. For all the flow cases, there is a clear prevalence of tubular structures, which persists with increasing stratification. The three joint p.d.f.s show qualitatively similar behaviour, with a peak of (
 $R_{max}/R_{min}$
,
 $R_{int}/R_{min}$
) between
 $(3,1)$
and
 $(7,1)$
. The peak position is consistent with figure 5(a), in which we showed that the average value of the rotation axis
 $R_{\unicode[STIX]{x1D714}}$
is approximately seven times larger than
 $R_{\bot 1}$
and
 $R_{\bot 2}$
.
3.2 Interaction between the TNTI and VLCSs
In the following, we present the relationship between the TNTI and nearby VLCSs. Through conditional analysis, we provide evidence that the average interface height and the local entrainment velocity are locally modulated by the presence of VLCSs. As observed in figure 2(b), part of the VLCSs are located in the proximity of the TNTI. We selected VLCSs that are ‘sufficiently’ close to the TNTI by computing the ratio
 $r$
between
 $R^{\prime }$
, the vertical distance of the centre of the VLCS with respect to the TNTI, and
 $R_{\bot }$
, the VLCS cross-sectional average radius, defined as one-half of the mean value between
 $R_{\bot 1}$
and
 $R_{\bot 2}$
. A sample representation of
 $R^{\prime }$
and
 $R_{\bot }$
can be found in figure 4(c). Given that in the non-turbulent region there is no vorticity, the VLCSs cannot cross the TNTI. This implies that
 $r$
cannot be smaller than one. For the following conditional analysis, we selected structures with
 $r$
smaller than a threshold value
 $r_{th}=2.5$
, which was fixed after testing different values and observing qualitatively similar results.
In a second step, for each selected structure we resampled both the instantaneous velocity field at the initial extraction time and the LAVD field around it, onto a uniform grid. For this operation, we positioned the frame of reference at the centre of the VLCS and normalized the three dimensions
 $x$
,
 $y$
and
 $z$
around the structure with the VLCS’s cross-sectional average radius
 $R_{\bot }$
. The rationale was to have a common frame of reference for all VLCSs and to compare flow fields around VLCSs of the same normalized size. Taking the average of the LAVD fields around the VLCSs, we extracted a mean representative VLCS, that is, we applied the extraction algorithm described in § 2.4 to the average LAVD field.
Applying the same coordinate transformation to the TNTI surfaces in the proximity of the VLCSs, we computed the conditional average height of the TNTI. Moreover, at each location of the average height, we evaluated a mean local entrainment velocity
 $\langle v_{n}\rangle$
. To this end, we computed the mean of instantaneous entrainment velocities near the structures. It is worth mentioning here that the high variance of the TNTI for the unstratified case Ri0 did not permit us to include this flow case in our analysis, given that the TNTI is observable in the measurement domain for a limited amount of instances, which did not allow us to obtain a meaningful statistical analysis.
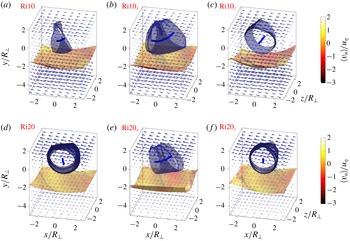
In figure 8, we present the results for Ri10 and Ri20. The centres of the structures are represented by the continuous lines close to the origin of the frame of reference and their boundaries by tubular surfaces enclosing them. Below the structures, the open surfaces represent the average TNTI positions, which we colour-coded with the average local entrainment velocity. Around each structure, we show the direction of the average flow fields with cones that point along the velocity vector with the size representing its magnitude.
Conditional average VLCS and TNTI position for Ri10 (a–c) and Ri20 (d–f). The VLCS centres are represented by the continuous blue lines and their boundaries by the tubular surfaces. The open surface is the conditioned TNTI mean position, colour-coded with the average of the local entrainment velocity. The direction and the size of the vectors represent the conditional average velocity field. In the first column (a,d) the conditional analysis is made for all the structures, whereas in the second (b,e) and the third columns (c,f) the analysis is conditioned also on the orientation of the structures. The structures are oriented prevalently in the streamwise direction in (b) and (e); respectively, in the spanwise direction in (c) and (f).

The first observation that emerges from figure 8 is that the average VLCS is oriented differently for the two flow cases. For Ri10, the average VLCS is oriented in the streamwise direction (figure 8
a), whereas for Ri20, the VLCS is mainly oriented in the spanwise direction (figure 8
d). In both flow cases, the TNTI is positioned at approximately
 $y/R\approx -2$
and the surface is clearly modulated by the nearby structure, having a curvature that follows that of the VLCS’s boundaries. As the stratification increases, the curvature of the TNTI is observed to reduce, which is consistent with a decrease of the mean surface area of the TNTI.
In order to reveal the effect of the orientation of the VLCSs on the shape of the TNTI, we conditioned our analysis to streamwise (figure 8
b,e), respectively spanwise, oriented structures. To this end, we compared
 $n_{x}$
and
 $n_{z}$
, evaluated as described in § 2.5. For a given VLCS, if
 $n_{x}>n_{z}$
, the structure is considered to be oriented approximately in the streamwise direction; otherwise it is considered to be oriented in the spanwise direction. From the second and third columns of figure 8, it appears clearly that the interface shape recalls that of the VLCS boundaries having a larger curvature in the plane orthogonal to the rotation axis of the VLCS. Consider for example figure 8(e), in which we conditioned our analysis to VLCSs of Ri20 oriented in the streamwise direction. The curvature of the average TNTI is almost entirely contained in
 $y$
–
 $z$
planes, which are orthogonal to the central axis of the structure, while they are almost flat in the
 $x$
–
 $y$
planes. Similarly, the curvature of the TNTI near the structures oriented prevalently in the spanwise direction is mostly limited to
 $x$
–
 $z$
planes (see for example figure 8
c). The average entrainment velocity
 $\langle v_{n}\rangle$
is shown in colour on the TNTI surface. As is common practice, we normalized
 $v_{n}$
with the Kolmogorov velocity microscale
 $u_{\unicode[STIX]{x1D702}}$
. Here, negative values of
 $v_{n}$
represent entrainment of dense irrotational fluid from below into the lighter turbulent fluid. The spatial distribution of
 $\langle v_{n}\rangle /u_{\unicode[STIX]{x1D702}}$
on the TNTI shows a similar pattern for the two flow cases in figure 8, with higher negative values downstream with respect to the centre of the structure, that is to say, close to
 $x/R_{\bot }\approx 2$
for the VLCSs oriented in the spanwise direction. For the structures oriented in the streamwise direction,
 $\langle v_{n}\rangle /u_{\unicode[STIX]{x1D702}}$
has higher negative values at the sides of the VLCSs near
 $z/R_{\bot }\approx \pm 2$
. Corresponding to the centre of the VLCS, for
 $(x/R_{\bot },y/R_{\bot })\approx (0,0)$
, higher or even positive values of
 $\langle v_{n}\rangle /u_{\unicode[STIX]{x1D702}}$
are observed (see e.g. figure 8
d). The maximum negative value of
 $\langle v_{n}\rangle /u_{\unicode[STIX]{x1D702}}$
is different between the two flow conditions, diminishing (in terms of absolute value) for increasing stratification, from
 $\langle v_{n}\rangle /u_{\unicode[STIX]{x1D702}}\approx -1$
for Ri10 (figure 8
a) to
 $\langle v_{n}\rangle /u_{\unicode[STIX]{x1D702}}\approx -0.5$
for Ri20 (figure 8
b). As previously observed, just below the centre of the VLCSs, positive values of
 $\langle v_{n}\rangle /u_{\unicode[STIX]{x1D702}}$
can be noticed. The existence of regions of positive
 $\langle v_{n}\rangle /u_{\unicode[STIX]{x1D702}}$
(detrainment) is well known. Wolf et al. (Reference Wolf, Lüthi, Holzner, Krug, Kinzelbach and Tsinober2012) showed that
 $v_{n}/u_{\unicode[STIX]{x1D702}}$
can be positive in regions with positive curvature of the TNTI (concave curvature looking to the interface from the turbulent side). As seen in figure 2, some of these bulges host VLCSs. As shown by others (e.g. Watanabe et al.
Reference Watanabe, Sakai, Nagata, Ito and Hayase2014; Krug et al.
Reference Krug, Chung, Philip and Marusic2017a
), unconditioned averages of
 $\langle v_{n}\rangle /u_{\unicode[STIX]{x1D702}}$
are negative (entrainment), but instantaneous positive (detrainment) values can be observed (Mistry, Philip & Dawson Reference Mistry, Philip and Dawson2019). To interpret the latter, one can take into account the local entrainment velocity decomposition based on the turbulent enstrophy equation introduced by Holzner & Lüthi (Reference Holzner and Lüthi2011). Based on their decomposition,
 $\langle v_{n}\rangle /u_{\unicode[STIX]{x1D702}}$
can be locally positive if the enstrophy destruction outweighs both the enstrophy production, which is comparatively small in the viscous superlayer, and the viscous diffusion, which is mostly positive in the viscous superlayer. This can lead to the reduction of the local enstrophy level below the threshold used for the TNTI identification.
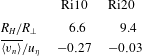
In table 3, we present the mean radius of curvature
 $R_{H}$
of the TNTI surfaces shown in figure 8(a,d). The mean radius of curvature increases from
 $R_{H}/R_{\bot }=6.6$
for Ri10 to
 $R_{H}/R_{\bot }=9.4$
for Ri20. The effectiveness of the VLCSs to contort the average interface reduces with increasing stratification. Although the mean radius of curvature is not a direct measure of the surface area of TNTI, it is clear that higher values of
 $R_{H}$
correspond to lower values of the surface area. It follows thus that the conditioned surface area of the TNTI decreases with increasing stratification, which is consistent with earlier work (see e.g. Krug et al.
Reference Krug, Holzner, Lüthi, Wolf, Kinzelbach and Tsinober2015). Furthermore, in table 3, we report
 $\overline{\langle v_{n}\rangle }/u_{\unicode[STIX]{x1D702}}$
, the average of the local entrainment velocity over the TNTI surfaces in figure 8(a,d). The average of
 $\overline{\langle v_{n}\rangle }/u_{\unicode[STIX]{x1D702}}$
exhibits a higher value for the lower stratification passing from
 $\overline{\langle v_{n}\rangle }/u_{\unicode[STIX]{x1D702}}=-0.27$
for Ri10 to
 $\overline{\langle v_{n}\rangle }/u_{\unicode[STIX]{x1D702}}=-0.03$
for Ri20.
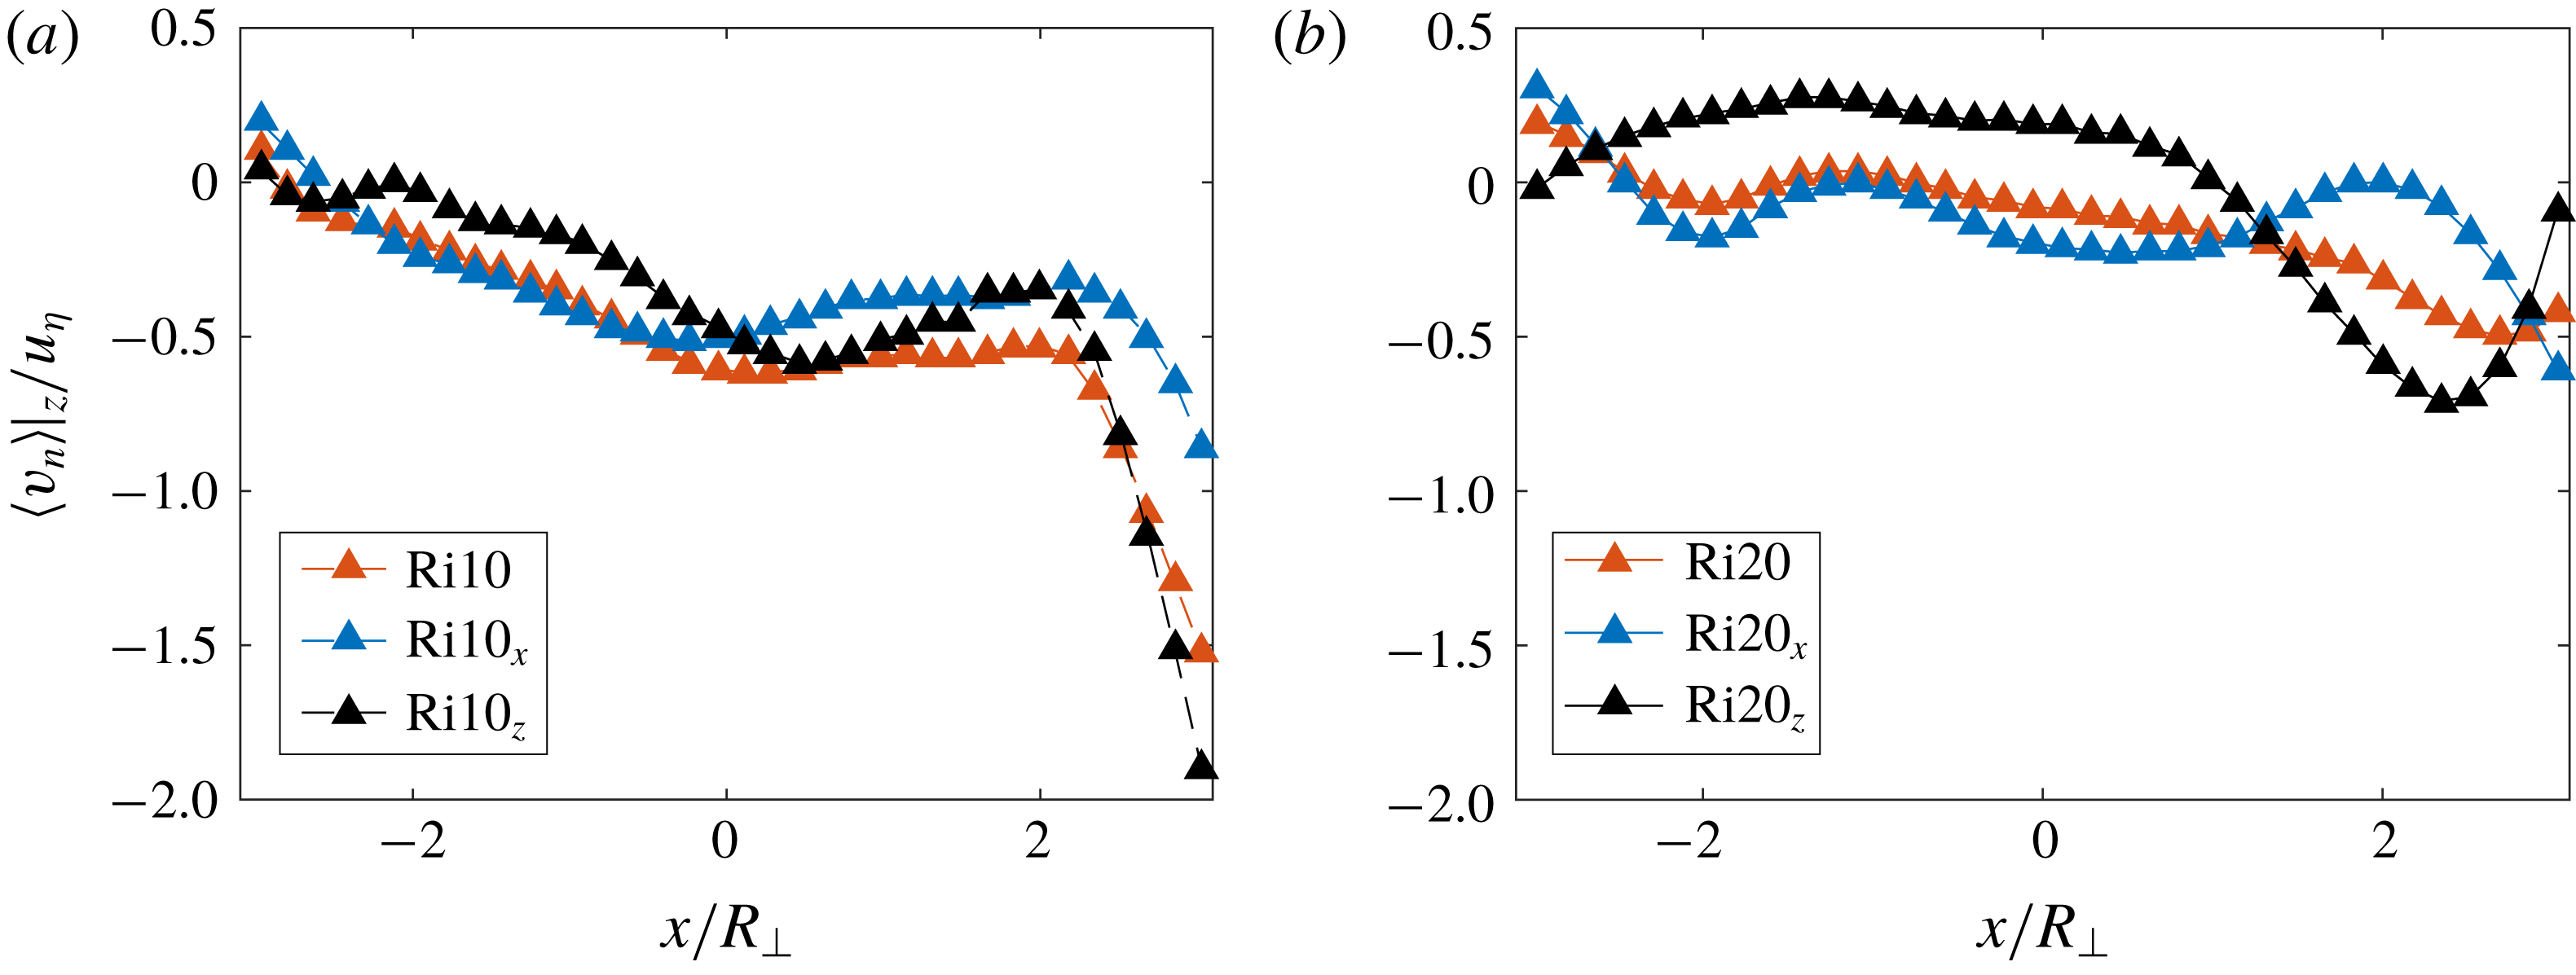
Conditioned spanwise average of the local entrainment velocity in the proximity of the VLCSs related to figure 8(a,d).

Average entrainment velocity and mean curvature radius of the TNTI conditioned on the presence of VLCSs for Ri10 and Ri20.

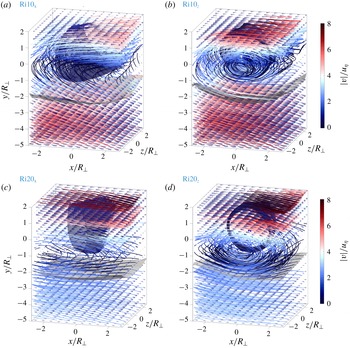
Flow visualization. Streamlines of figure 8, colour-coded with the average velocity magnitude.

In order to further illustrate how the large-scale VLCSs influence the small-scale entrainment, in figure 9 we show the spanwise average of
 $\langle v_{n}\rangle /u_{\unicode[STIX]{x1D702}}$
corresponding to figure 8(a,d). In both cases shown in figure 9, the entrainment velocity is higher in the downstream region (
 $x/R_{\bot }\approx 2$
), and lower or even positive (figure 9
b) in the proximity of the centre of the VLCS (
 $x/R_{\bot }\approx 0$
). In a similar fashion to figure 8, we show the effect of the orientation of the structures on the entrainment velocity. For Ri10 (figure 9
a), it is clear that the entrainment has the same behaviour for the structures oriented both in the spanwise and in the streamwise directions. For Ri20 (figure 9
b),
 $\langle v_{n}\rangle |_{z}/u_{\unicode[STIX]{x1D702}}$
has considerably smaller negative values, and for the structures oriented in the spanwise direction, it has positive values around 0.2 for
 $x/R_{\bot }\approx 0$
.
Finally, we analyse how VLCSs near the TNTI influence the flow around them. The impact of the VLCSs on the mean flow in the proximity of the TNTI surface is different for the two flow conditions shown in figure 8. For Ri10, no clear influence of the VLCSs can be observed (figure 8 a). However, the spanwise-oriented structures (figure 8 c) organize the flow both inside and outside the turbulent zone. Inside the turbulent region, the average flow field revolves around the centre of the structure, giving rise to a rotational motion, whereas outside, it deviates towards the upstream region. In the case of Ri20, this behaviour can be observed without the need of conditioning on the orientation of the VLCSs (figure 8 d). However, this flow pattern is reinforced when only spanwise-oriented structures are considered (figure 8 f).
For a clearer visualization, we display in figure 10 the streamlines of the average flow fields around the conditionally oriented structures shown in figure 8. Here, the streamlines are colour-coded with the local velocity magnitude and the TNTI is represented by the grey transparent open surface, positioned below the VLCS. For the structures oriented in the streamwise direction (figure 10
a,c), the streamlines in the non-turbulent zone appear to be rather horizontal, curving in the proximity of the VLCS (
 $y/R_{\bot }\approx 0$
) and following the direction of the mean flow in the turbulent region. In both cases, the magnitude of the velocity field is higher far from the TNTI, in both the non-turbulent and the turbulent regions. When the spanwise-oriented structures are considered (figure 10
b,d), a different flow organization arises. Outside the turbulent zone, far from the TNTI, the streamlines are again almost horizontal, similar to those close to the streamwise-oriented structures in figure 10(a,c). However, in the turbulent side, they follow the rotational motion induced by the VLCSs, curling up around the structures. This is evident in figure 10(c,d), where the swirling motion due to the presence of the structures can be clearly distinguished. For Ri20 (figure 10
d), the streamlines follow the TNTI almost tangentially. The velocities along the streamlines forming the swirling motion inside the turbulent zone are higher for both Ri10 and Ri20 on the upper side of the structures (
 $y/R_{\bot }\approx \pm 1$
), decreasing in the proximity of the centre of the structures and increasing again in the non-turbulent side.
4 Discussion and summary
In this paper, we focused on the detection and characterization of Lagrangian vortical coherent structures (VLCSs) and their influence on the turbulent/non-turbulent interface (TNTI) and entrainment of a gravity current. Using 3-D PTV data, the VLCSs were educed by means of the so-called Lagrangian-averaged vorticity deviation (LAVD) method. The TNTI was identified using an enstrophy threshold, whereas its entrainment velocity was computed through a direct method described in Wolf et al. (Reference Wolf, Lüthi, Holzner, Krug, Kinzelbach and Tsinober2012).
In § 3.1, we described the geometrical characteristics of the VLCSs. In particular, in figure 5(a) we observed that the average cross-sectional dimensions of the VLCSs are of the order of the integral length scale of the turbulence
 $L$
. By normalizing them with
 $L$
, almost no variation of their size with increasing stratification was noticed. Thus, the size of the VLCSs appeared to scale with integral length scale. A similar observation was made for the largest vortical structures near the TNTI of a turbulent jet by da Silva & dos Reis (Reference da Silva and dos Reis2011). Using a low-pressure isosurface for the structure eduction, the authors found that the radius of what they call large-scale vortical structures is of the order of the Taylor microscale. Furthermore, analysing the growth rates of the dimensions of the VLCSs, we noticed that VLCSs are predominantly stretched and in time their cross-sections tend towards a rather isotropic shape. This is reminiscent of the predominant vortex stretching mechanism (Tsinober Reference Tsinober, Hunt and Vassilicos2000), which has been well known since, for example, the initial studies by Chong et al. (Reference Chong, Perry and Cantwell1990), Cantwell (Reference Cantwell1993) and Soria, Ooi & Chong (Reference Soria, Ooi and Chong1997) on the invariants of the velocity gradient tensor. Through coarse-grained and filtered velocity gradient tensors, Meneveau (Reference Meneveau2011) demonstrated that predominant stretching is discernible also at larger flow scales that are well in the inertial range, as is the case for the ones investigated here.
In figures 6 and 7, we showed that on average the VLCSs are of tubular shape oriented mainly in the streamwise direction. The fact that the structures are prevalently oriented in the streamwise direction is interesting, given that, in our flow, the mean vorticity is oriented in the spanwise direction. A well-known picture in wall-bounded turbulence is that an initially spanwise-oriented vortex, formed near the wall of the boundary layer, is disturbed by an ejection event that raises part of the vortex tube to a height where the mean flow is faster. The mean flow advects this coherent mass faster than the vortex tube near the wall, tilting its legs towards vertical planes, in which they are stretched by the mean shear (Kim & Adrian Reference Kim and Adrian1999). We speculate that a similar mechanism may be at the base of formation of the VLCSs investigated here. In the mixing layer of the gravity current, initial vortices form via a Kelvin–Helmholtz type of mechanism and are then tilted by turbulence and the mean shear. In figure 6, we also noted that, as the stratification increases, more structures tend to be oriented in the spanwise direction. We associate this with the mechanism described before. Indeed, as the stratification increases, the vertical motion of the fluid is known to be reduced. This attenuates sweeps and ejections, with the consequence that the probability to observe spanwise-oriented structures may be higher. Moreover, the orientation of the structures close to the TNTI was shown to be almost horizontal. This is a consequence of the fact that the VLCSs cannot cross the interface and cannot finish or start on it. This is in line with the findings of da Silva & dos Reis (Reference da Silva and dos Reis2011) in the case of a planar turbulent jet.
In § 3.2, we investigated the interaction between large-scale VLCSs and the TNTI, with a focus on both elements constituting the entrainment process, namely, the TNTI area and the local entrainment velocity. We showed that the VLCSs modulate the TNTI height, thereby increasing the TNTI surface area. A similar observation was done by Lee et al. (Reference Lee, Sung and Zaki2017) for the TNTI height of a turbulent boundary layer. Here the authors conducted a conditional analysis based on the position of LSMs, showing that the interface is locally contorted by the LSMs. In both examples, the gravity current and the turbulent boundary layer, it is demonstrated that the large-scale flow structures enhance the TNTI area, thereby augmenting the entrainment flux. Moreover, we showed that the local entrainment velocity at the smaller scales of the turbulence is modulated by the large-scale VLCSs (figure 8). In particular, the local entrainment velocity was seen to be higher downstream with respect to the position of the VLCSs, decreasing and becoming even positive (detrainment) just beneath the centre of the structure. We hypothesize that this might be connected to the presence of the VLCS, which induces a motion tangent to the surface of the TNTI locally reducing the entrainment rate. The visualization of streamlines of the mean velocity field supports this idea. A similar remark was made by Bisset, Hunt & Rogers (Reference Bisset, Hunt and Rogers2002) for the instantaneous streamlines near a bulge of the TNTI of a turbulent wake. Here the authors observed that the streamlines enter it on the turbulent side (high entrainment) only in regions with a convex curvature of the surface as seen from the turbulent side (see figure 15 in Bisset et al. (Reference Bisset, Hunt and Rogers2002)), whereas beneath the bulge the streamlines are almost horizontal (low entrainment or detrainment). In figure 2, we observed that part of these bulges hosts a VLCS, which is compatible with findings in Bisset et al. (Reference Bisset, Hunt and Rogers2002). A more recent work by Mistry et al. (Reference Mistry, Philip and Dawson2019), which discusses the existence of instantaneous detrainment zones in a turbulent jet, further supports our observations on the detrainment near the VLCSs. Here, the authors show that, similarly to our findings, high detrainment is observed when the fluid moves tangentially to the interface on both sides of the TNTI.
Acknowledgements
We are grateful for financial support from DFG priority programme SPP 1881 under grant number HA 7497/1-1.