Over the past half dozen years we have shown that many plastically anisotropic materials, in which dislocations are confined to two-dimensions, outline fully and spontaneously reversible hysteretic stress–strain loops upon cyclic loading. We postulated that the micromechanism for this phenomenon is the formation and annihilation of multiple, co-axial parallel dislocation loops, whose shape guarantees that they only remain open when a load is applied; unloading results in their shrinkage and/or their annihilation.[Reference Frank and Stroh1–Reference Barsoum, Zhen, Kalidindi, Radovic and Murugaiah4] Among others, we have shown that a large number of seemingly unrelated solids such as C-plane ZnO,[Reference Basu and Barsoum5] BaTiO3,[Reference Buchs, Basu, Elshrief, Coward and Barsoum6] sapphire,[Reference Basu, Barsoum and Kalidindi7] LiNbO3,[Reference Basu, Zhou and Barsoum8] LiTaO3,[Reference Anasori, Sickafus, Usov and Barsoum9] Mg, Co, Ti, Zn,[Reference Zhou, Basu and Barsoum10, Reference Zhou, Brown, Vogel, Yeheskel and Barsoum11] graphite,[Reference Barsoum, Murugaiah, Kalidindi, Zhen and Gogotsi12] mica,[Reference Barsoum, Murugaiah, Kalidindi and Zhen2, Reference Basu and Barsoum13] and the MAX phases,[Reference Zhou, Barsoum, Basu, Kalidindi and El-Raghy3] trace fully reversible hysteretic stress–strain loops upon cyclic loading.
Working mostly with single crystals, we showed that when one of the aforementioned materials is indented with a spherical indenter, a linear elastic regime is usually followed, in most cases, by pop-in events, that in some cases are massive, followed, after a few cycles, by fully and spontaneously reversible hysteretic load–displacement curves.[Reference Basu and Barsoum13] During the pop-in events, the strain energy released results in the creation of a multitude of nanodomains and, in the case of LiNbO3 and LiTaO3, twins.[Reference Basu, Zhou and Barsoum8, Reference Anasori, Sickafus, Usov and Barsoum9] When the nanoindenter is reloaded into the same location, we postulated that coaxial dislocation loops nucleate within the domains formed during the pop-ins. The reversible motion, of these dislocations in turn, is believed to result in the energy dissipated per unit volume per cycle, W d. The presence of microdomains—that play the role of grain boundaries in polycrystalline solids—that do not allow the parallel dislocation loops to dissociate into mobile dislocation walls (MDWs) is thus essential for their reversible behavior.[Reference Basu and Barsoum5, Reference Basu, Barsoum and Kalidindi7–Reference Anasori, Sickafus, Usov and Barsoum9]
Previously, we referred to these co-axial, parallel dislocation loops as incipient kink bands (IKBs). Materials that dissipated energy via this mechanism were labeled kinking nonlinear elastic (KNE) solids.[Reference Frank and Stroh1–Reference Barsoum, Zhen, Kalidindi, Radovic and Murugaiah4] In sharp contradistinction to other energy-dissipating mechanisms in crystalline solids, such as microcracking or phase transitions, KNE solids have excellent fatigue resistance. For example, it is possible to indent sapphire single crystals in the same location to stresses of the order of 40 GPa, 24 times and observe no measurable differences in the shape and/or area of the reversible load–displacement loops after the ≈6th cycle.[Reference Basu, Barsoum and Kalidindi7]
The W d values measured for LiTaO3 were some of the highest of any single crystals examined so far.[Reference Barsoum, Murugaiah, Kalidindi and Zhen2, Reference Basu and Barsoum5, Reference Basu, Barsoum and Kalidindi7–Reference Anasori, Sickafus, Usov and Barsoum9, Reference Barsoum, Murugaiah, Kalidindi, Zhen and Gogotsi12, Reference Basu and Barsoum13] The reason for this state of affairs is believed to be the formation of twins [see supplementary Fig. S1(a)]—during the early stages of deformation and/or the pop-in events—that rotate domains into an orientation that is more amenable to reversible dislocation motion (RDM) within the basal planes.[Reference Basu, Zhou and Barsoum8, Reference Anasori, Sickafus, Usov and Barsoum9]
There are also some reports on microcracking as the origin of hysteretic load–displacement loops. Richter et al.[Reference Richter, Wolf, Nowicki, Smith, Usov, Valdez and Sickafus14] ascribed the hysteretic load–displacement loops in MgO single crystals to microcracking. The latter can cause some energy dissipation but typically fades with cycling. Oliver and Pharr[Reference Oliver and Pharr15] reported hysteretic load–displacement loops during the early stages of nanoindentation (NI) in soda lime glass, which also degenerated with cycling.
This work's main goal is to differentiate between RDM and other energy-dissipating mechanisms, such as microcracking or irreversible dislocation pileups. To do so, two diamond hemispherical indenters with radii, R, of 5 and 21 µm, were loaded into the same location—on a C-plane LiTaO3, a plastically anisotropic solid, and a soda-lime glass microscope slide, an amorphous material—100 times to stresses, of the order of 6–9 GPa, while concomitantly recording the load–displacement curves. The loading rate/load ratio was kept constant at 0.1. To maintain contact between the indenter and the specimen, each of the unloading cycles were interrupted at 1% of the maximum load. During some NI runs, and despite waiting for the nanoindenter to settle down, instrumental drift, both positive and negative, were observed. The origin of the instrumental drift can be the result of temperature changes during the test. This was noted despite the fact that the tests were started only when the drift was below 0.05 nm/s. Thus, the maximum drift on each cycle was about ±5 and ±7.5 nm for 5 and 21 µm indenters, respectively. Needless to add, this drift can influence the load–displacement and complicate the analysis. The technique we are proposing here also minimizes the influence of drift.
Typical NI load–displacement cycles obtained when the 5 µm radius tip was indented 100 times into the same location in LiTaO3 and the glass slide are shown in Figs. 1(a) and 1(b), respectively. For the sake of clarity, only select cycles are plotted. In Fig. 1(a), as in all our previous work on KNE solids, the first loop is open; subsequent loops, up to cycle 6, are open, but successively less so. From the 6th to ≈35th cycles, the loops are closed and fully reversible. Cycling beyond 35 times, results in larger, open loops until around cycle 75, after which the loops close and become reversible again. The load–displacement plots are different on the glass sample; the first loop is open and the subsequent loops are small and become smaller up to cycle 10. From the 10th cycle through the end of the test (cycle 100th) the loops are quite small and their areas remain more or less constant.
(a) Select NI load–displacement curves for a given location loaded 100 times to 100 mN with the 5 µm radius indenter on, (a) a C-plane LiTaO3 single crystal, (b) a glass slide. The top inset in (b) shows a schematic of how RD is calculated from each load–displacement loop.

The first cycle load–displacement curves in both samples are quite comparable. In most of our previous NI work, to further analyze the results and differentiate between reversible dislocation motion and other reasons for energy dissipation, we converted the NI results to NI cyclic stress–strain curves. This conversion entailed some assumptions and approximations that some have questioned. Here, to avoid this problem, we define a new parameter, viz. reversible displacement (RD)—shown schematically in the inset in Fig. 1(b)—as:
 $$RD=D_{\rm w} - D_{\rm f}$$
where D w is the maximum width of each loop and D f is the non-reversible displacement at the end of each cycle. It follows that RD is a measure of the reversible energy dissipation during each cycle regardless of its origin. As shown below, plotting RD versus cycle number is a powerful, simple and straightforward method to differentiate between these two damping phenomena.
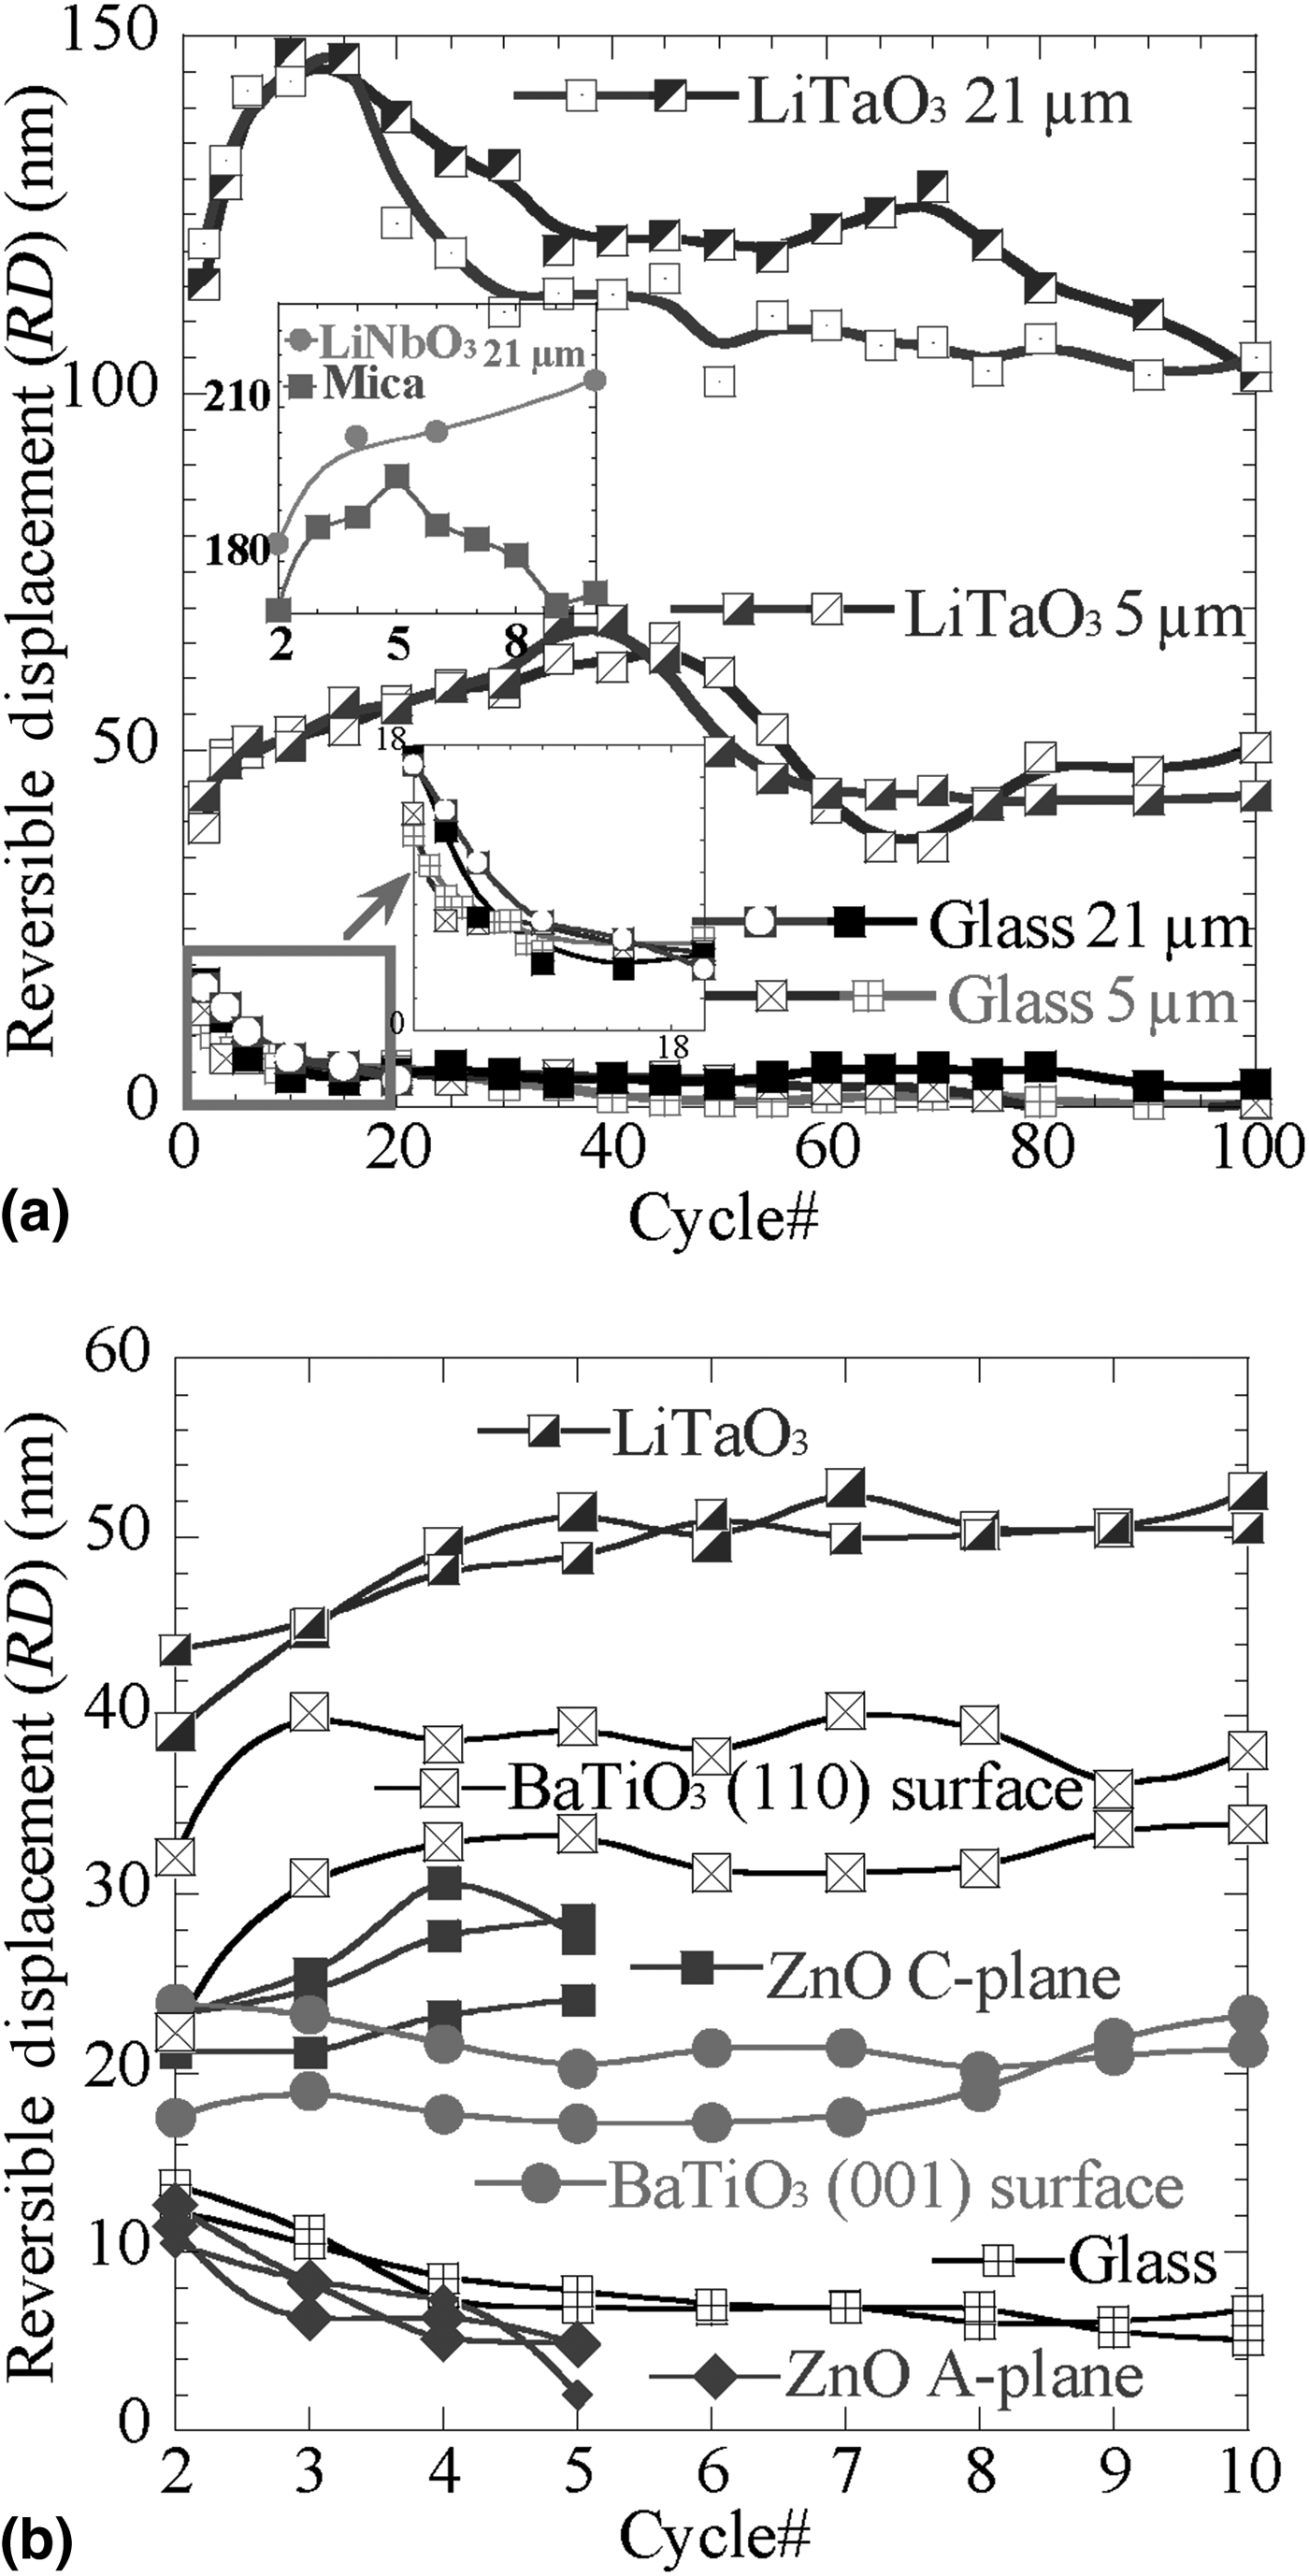
Figure 2(a) plots RD versus cycle number for both the LiTaO3 and the glass samples loaded 100 times to 100 and 550 mN with the 5 and 21 µm indenters, respectively. The results on two different locations are shown for each sample and tip size. At about 13 ± 1 nm, the RD on the glass slide, for the 5 µm tip, has its maximum value during cycle 2, and decreases to ≈3 ± 3 nm after ≈10 cycles and remains constant throughout the rest of the test. For the 21 µm tip, the RD starts around 17 ± 1 nm, and decreases to the same minimum value (≈3 ± 3 nm) as for the 5 µm tip, also after ≈10 cycles. In general, for both indenter sizes and for all the locations the RDs on the glass showed two stages: a decrease from a maximum value at the very beginning to a steady-state regime after ≈10 cycles after which it remained constant at ≈3 ± 3 nm. Note that the steady-state regime is achieved more or less after the same cycle numbers for both indenter sizes.
RD versus cycle number for (a) two different locations on the LiTaO3 and glass surfaces loaded 100 times to 100 mN with the 5 µm indenter and 550 mN with the 21 µm indenter. The top inset shows the RD values for LiNbO3 and mica loaded 10 times to 550 mN with 21 µm tip, (b) up to cycle 10th for two locations on LiTaO3 and the glass sample indented to 100 mN with the 5 µm indenter. Also plotted are the RD values for A- and C-plane ZnO single crystals,[Reference Basu and Barsoum5] (001) and (110) BaTiO3 surfaces,[Reference Buchs, Basu, Elshrief, Coward and Barsoum6] and indented with a 13.5 µm indenter.
In sharp contradistinction to the glass surface, the RD response versus cycle number for LiTaO3—for both indenter sizes in two different locations represented by blue and purple curves, respectively, in Fig. 2(a)—is qualitatively and quantitatively different. Here, the RDs start at a low value, go through a maximum around cycle 40 for the 5 µm indenter tip (blue and purple curves in center of Fig. 2(a)) and ten cycles for the 21 µm indenter tip [top blue and purple curves in Fig. 2(a)] before gradually decreasing to the 100th cycle. When the RDs for LiNbO3 are plotted for cycles 2–10, a similar trend is observed [top inset in Fig. 2(a)].
The two diametrically opposite responses of RD with cycling [Fig. 2(a)], for the glass and LiTaO3, are fully consistent with our understanding of the nature of the energy dissipated in each material. In the glass, microcracking and the concomitant friction between the crack surfaces is the only possible energy-dissipating mechanism. Since cycling would tend to wear and smoothen cracked surfaces, it is not surprising that friction between these surfaces decreases with cycling which in turn leads to a reduction in the RD and W d values. Note that another factor could be the reduction in stress under the indenter as the microcracks increase in size with cycling. Scanning electron microscopy (SEM) micrographs of the indentation in the glass after 2, 10, and 100 cycles (see Fig. S3, in supplementary material) suggest that if the area changes with cycling, such changes are quite small. This comment notwithstanding, in either case, RD decreases with cycling. It is thus quite significant that the RDs for LiTaO3 initially increase with cycling. The latter implies that although microcracks exist around the indentation mark in LiTaO3 even after a few cycles [see Fig. S1(a) in supplementary material] the mechanism responsible for the RD in LiTaO3 cannot be solely due to microcracking; another mechanism, that is much more dissipative, must be invoked.
Over the years, we have made the case that a possible second mechanism is in the form of IKBs. The results shown in Fig. 2(a) support this notion. We have shown in our previous NI work that in both LiTaO3[Reference Anasori, Sickafus, Usov and Barsoum9] and LiNbO3[Reference Basu, Zhou and Barsoum8] during the pop-in stage (10 $\overline 1 $2)[10
 $\overline 1 $1] twins form [see Figs. S1(a) and S1(b) in supplementary material]. The latter rotate the basal planes in orientations that are more amenable to dislocation movement (see supplementary Fig. S2) that in turn result in the largest reversible NI loops we have ever measured.[Reference Basu, Zhou and Barsoum8, Reference Anasori, Sickafus, Usov and Barsoum9] The initial increase in RD with cycling can thus be ascribed to this reorienation and its cyclic dependence.
Note that the conclusion that RDM results in hysteretic loops does not neccesarily rule out microcracking. It is reasonable to assume that the reduction in RD past its peak values for both indenters [Fig. 2(a)] is related to the nucleation and growth of microcracks. Indeed, post-SEM micrographs of indented regions more often than not show a plethora of microcracks, especially after 100 cycles [see Fig. S1(d) in supplementary material].
To test the general validity of this conclusion we revisited our results on the cyclic loading of LiTaO3,[Reference Anasori, Sickafus, Usov and Barsoum9] LiNbO3,[Reference Basu, Zhou and Barsoum8] (110) and (001) BaTiO3,[Reference Buchs, Basu, Elshrief, Coward and Barsoum6] mica,[Reference Basu and Barsoum13] and A- and C-plane ZnO surfaces.[Reference Basu and Barsoum5]Figure 2(b) plots the RD versus cycle number for these diverse solids. The RD values for mica and LiNbO3 are plotted in Fig. 2(a). Also plotted, for comparison, are the results obtained on glass obtained here. A perusal of these results quickly establishes that with the exception of the glass and ZnO A-plane—in which the RDs decrease with cycle number—for all of the other surfaces, the RDs either increase, or remain constant as in the case of the (001) BaTiO3 surface with cycle number. Gratifyingly, the latter surfaces were all classified as KNE based on our analysis of their NI stress–strain curves.
The results on the ZnO A-plane are noteworthy. Based on our NI results[Reference Basu and Barsoum5] and, more importantly, those of others[Reference Coleman, Bradby, Jagadish and Phillips16] we concluded that in this orientation, irreversible dislocation pileups and not IKBs nucleated under the indenter. The latter were seen in cross-sectional transmission electron microscopy (TEM) micrographs.[Reference Basu and Barsoum5, Reference Coleman, Bradby, Jagadish and Phillips16] Clearly, the RD result for this ZnO orientation is more reminiscent of the glass surface. However, in this case, the energy dissipation cannot be ascribed to microcracks for the simple reason that none were observed in post-indentation SEM observations of the indentation marks.[Reference Basu and Barsoum5] This is an important result because it suggests that pileup reversibility also fades with cycling, presumably as a result of work hardening. It is worth re-emphasizing here that cracks were not observed when the C-plane ZnO surfaces were cyclically indented (see Fig. S4 in supplementary materials) which rules out microcracking in that case.
The advantages of measuring RD are that only the raw load–displacement data are used. There are also some reports on measuring the full-width at half-maximum (FWHM) of the load–displacement loops during cyclic indentation.[Reference Buchs, Basu, Elshrief, Coward and Barsoum6, Reference Saraswati, Sritharan, Mhaisalkar, Breach and Wulff17] We believe that RD is more accurate and powerful than FWHM because, (a) the D w does not always occur at half maximum, and (b) during high cycle indentation tests, the drift can be problematic. By subtracting the D f from D w the effect of the drift is minimized (see supplementary material).
In conclusion, here, we define a new parameter, RD, which is related to, and indirectly measures, the reversible deformation of a region below a spherical nanoindenter. By plotting the RD versus the number of cycles two different responses were observed. The first was a gradual decrease in RD with cycling; the second was an initial gradual increase or a constancy with cycle number. The former was correlated with microcracking or irreversible dislocation pileups; the latter with RDM, most likely in the form of IKBs. By using this technique, we re-confirmed that LiTaO3, LiNbO3, BaTiO3, C-plane ZnO, and mica single crystals are KNE solids. More importantly, we also show that the energy dissipation in glass and A-plane ZnO decrease or fade with cycling, and are thus not due to RDM. Finally, it is important to note that the conclusions reached here are not contingent on the existence of IKBs; the conclusions reached, apply to any form of RDM.
Supplementary materials
For supplementary material for this article, please visit http://dx.doi.org/10.1557/mrc.2013.39
Acknowledgment
This work was supported by the Army Research Office (grant no. W911NF-11-01-0525).