Dairy production of milk is affected by a number of factors (Wiggans et al. Reference Wiggans, VanRaden, Bormann, Philpot, Druet and Gengler2002; Mansfeld et al. Reference Mansfeld, Sauter-Louis and Martin2012). The length of the non-lactating period between successive lactations is one of the factors. The non-lactating period involves involution, a process of mammary gland remodelling, and is followed by a period of mammary epithelial cell proliferation and differentiation (Capuco et al. Reference Capuco, Akers and Smith1997). The industry adopted the period of 50–60 d as the optimum for most cows to maximise their lactational performance based upon research findings (O`Connor & Oltenacu, Reference O`Connor and Oltenacu1988).
During the later stages of pregnancy and generally overlapping the traditional dry period, the mammary gland epithelial cells of the dairy cow first differentiate to conduct colostrogenesis that results in the secretion of colostrum (Baumrucker & Bruckmaier, Reference Baumrucker and Bruckmaier2014). Colostrum immunoglobulin content is critical for the newborn because the transfer of these proteins in utero does not occur in ruminant species.
Colostrum feeding and timing of the feeding is critical for lowering the risk of disease (Donovan et al. Reference Donovan, Dohoo, Montgomery and Bennett1998; Quigley & Drewry, Reference Quigley and Drewry1998; Weaver et al. Reference Weaver, Tyler, VanMetre, Hostetler and Barrington2000). Colostrum quality has been traditionally determined by IgG content, but both protein concentration (11·8–74·2 mg/ml; Kehoe et al. Reference Kehoe, Jayarao and Heinrichs2007) and mass (30 g to >2 kg; Baumrucker et al. Reference Baumrucker, Burkett, Magliaro-Macrina and Dechow2010) is highly variable among animals. Poor colostrum quality is one of the contributors to the risk of intestinal disease (McGuire et al. Reference McGuire, Pfeiffer, Weikel and Bartsch1976; Quigley & Drewry, Reference Quigley and Drewry1998). Industry standard guidelines describe the feeding of high-quality colostrums (>50 mg/ml IgG) within the first few hours of birth (Tyler et al. Reference Tyler, Hancock, Parish, Rea, Besser, Sanders and Wilson1996, Reference Tyler, Steevens, Hostetler, Holle and Denbigh1999).
Recent studies have explored the possibility of shortening the dry period (Annen et al. Reference Annen, Collier, McGuire, Vicini, Ballam and Lormore2004; Klusmeyer et al. Reference Klusmeyer, Fitzgerald, Fabellar, Ballem, Cady and Vincini2009) or eliminating the dry period between lactations resulting in continuous milking (Fitzgerald et al. Reference Fitzgerald, Annen-Dawson, Baumgard and Collier2007; Madsen et al. Reference Madsen, Nielsen, Andersen and Ingvartsen2008; Schlamberger et al. Reference Schlamberger, Wiedenmann, Viturro, Meyer and Kaske2010; Collier et al. Reference Collier, Annen-Dawson and Pezeshki2012). Colostral IgG concentration has been reported to be similar for cows with short dry periods compared with cows with conventional dry periods (Annen et al. Reference Annen, Collier, McGuire, Vicini, Ballam and Lormore2004; Rastani et al. Reference Rastani, Grummer, Bertics, Gumen, Wiltbank, Mashek and Schwab2005; Watters et al. Reference Watters, Guenther, Brickner, Rastani, Crump, Clark and Grummer2008; Klusmeyer et al. Reference Klusmeyer, Fitzgerald, Fabellar, Ballem, Cady and Vincini2009). Cows with no dry period, however, were reported to have decreased IgG concentration in colostrum compared with cows with a conventional dry period (Annen et al. Reference Annen, Collier, McGuire, Vicini, Ballam and Lormore2004; Rastani et al. Reference Rastani, Grummer, Bertics, Gumen, Wiltbank, Mashek and Schwab2005; Klusmeyer et al. Reference Klusmeyer, Fitzgerald, Fabellar, Ballem, Cady and Vincini2009). The variance in IgG concentrations have been attributed to many factor (Baumrucker & Bruckmaier, 2014). To our knowledge, studies which describe the IgG content in late gestation of continuously milked cows are absent. The objective of this study was to determine the appearance of IgG in mammary secretions pre- and post partum in dairy cows that were continuously milked and compare them with those in animals experiencing a 60-d dry period.
Material and methods
Animals and design
The Institutional Animal Care and Use Committee of Wageningen University and Research centres approved the experimental protocol. Sixteen Holstein-Friesian dairy cows from Wageningen University were used in the study. Two groups of cows with comparable milk production in previous lactation (10 057±285 kg/305 d) were composed of: continuously milked cows (Dry0; n=8) and cows that experienced a 60-d dry period (Dry60; n=8). Cows were housed in a freestall and during lactation, cows were milked twice daily (5·00 and 16·30). The drying-off protocol for cows with the Day60 dry period consisted of a transition to the far-off ration at day 7 before drying-off, and milking once daily at day 4 before drying-off cows. At drying-off, Day60 cows were treated with an intramammary antibiotic (Supermastidol; Virbac Animal Health, Barneveld, The Netherlands). Overall milk yield on day 1 following parturition was 21·7±1·7 kg/d for the Dry60 and 13·11±8·0 kg/d for the Dry0 group. During the experimental period of –day 7 pre-partum to day 3 post partum a daily morning secretion sample was collected from machine-milked animals. Ration composition was described earlier (Van Knegsel et al. Reference van Knegsel, Remmelink, Jorjong, Fievez and Kemp2013). In short, pre-partum feeding for dry cows consisted of a dry cow ration; lactating cows received a lactating cow ration supporting a milk yield of 25 kg/d. From 10 d before the expected calving date, all cows were fed a glucogenic concentrate and, when lactating, cows received in the milking parlour 1 kg/d of standard lactation concentrate. Forage composition consisted pre-partum of grass silage, corn silage, wheat straw and a protein source (rapeseed meal or soyabean meal) in a ratio of 39 : 25 : 25 : 11 (dry matter basis). Post partum, forage consisted of grass silage, corn silage, straw, and a protein source in a ratio 51 : 34 : 2 : 13 (dry matter basis).
Blood sampling
Tail vein blood samples were taken in 9-ml vacuum tubes coated with EDTA and kept on wet ice and centrifuged at 2500 g at 4 °C for 15 min to harvest plasma. Plasma was subsequently stored at −20 °C until analysis. Mammary secretions were sampled once a day (5 ml) and stored at −20 °C until analysis.
Plasma analyses
Plasma prolactin (Prl) was determined by radioimmunoassay as described previously by Bruckmaier et al. (Reference Bruckmaier, Schams and Blum1992). For the analysis of plasma progesterone (P4), a radioimmunoassay kit (no. IM1188, Beckman Coulter GmbH, Krefeld, Germany) was used.
Colostrum analysis
Colostral IgG concentration was determined with a modified enzyme-linked immunosorbent assay (Bovine IgG ELISA Quantitation Set; Cat. No. E10-118; Bethyl Laboratories Inc., Montgomery TX, USA) as described by Baumrucker et al. (Reference Baumrucker, Stark, Wellnitz, Dechow and Bruckmaier2014). Results were expressed as IgG concentration in mg/ml. Mass of IgG secreted by the mammary gland was calculated by multiplying respective concentrations by the corresponding milk yields.
Statistical analysis
Data were analysed using SAS Proc Mixed procedure (SAS, 2007) that included treatment (dry period length), sampling time-point and their interaction as fixed effects. Sampling points were treated as repeated factor within animals. Analysis of peak IgG concentrations between treatment groups was conducted with Proc GLM with IgG=Treatment.
Results
Secretions
Figure 1 shows the milk secretion occurring in the two treatment groups. Cows that were continuously milked were producing 8·28±3·52 kg/d before parturition. At the first milking following parturition, the secretion weight increased to 10·4±8·03 kg/d. The Dry60 group produced less secretion weight at the day 0 (6·07±3·7 kg/d) when compared with the Dry0 group. While the Dry60 group increased secretion dramatically in the day 2 milking (29·4±1·17 kg/d) the Dry0 cows increased at a lower rate reaching 13·95±8·5 kg/d at day 2 milking.
Milk secretion in dairy cows around the time of parturition that had a 60-d dry period (Dry60) or were continuously milked (Dry0). Data are the LSMEANS±sem.

Blood hormones
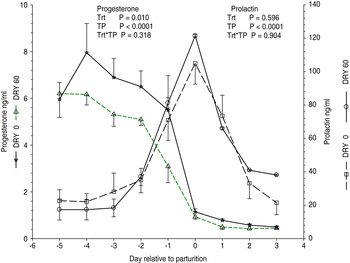
Blood plasma P4 and Prl concentrations occurring during the experimental period are shown in Fig. 2. Plasma P4 was different between Dry0 and Dry60 during the pre-partum period with the Dry60 group exhibiting higher concentration than the Dry0 group during the period day −4 to day 0 (Trt; P=0·01). While both treatments declined in P4 around the same day to parturition, that was different at day 0 when compared with previous days (P<0·01) and there was no treatment*time to parturition interaction (Trt*TP; P=0·34). While the Dry0 cow plasma was different than that of the control group (Dry60) during the period from day −4 to day −1, at parturition P4 concentrations for the two treatment groups were not different. Analysis of area under the curve of progesterone indicated a treatment effect (P<0·01) with Dry0 showing greater amount of P4 in the plasma.
Concentration of progesterone and prolactin in dairy cows secretions around the time of parturition (TP) that had a 60-d dry period (Dry60) or were continuously milked (Dry0). Data are the LSMEANS±sem. Trt=Dry period length (Dry0 or 60); TP=time to parturition; Trt*TP=interaction between Trt and TP.

Blood plasma Prl concentrations are also shown in Fig. 2. At no time was the prolactin concentration different between the two treatment groups (Trt; P=0·60). Increase in Prl was observed at day −1 (TP; P<0·01), peaked at parturition (day 0) and declined rapidly in the days following parturition. There was no Trt*TP interaction (P=0·90). Analysis of area under the curve for Prl indicated a difference between the two treatment groups with Dry60 showing greater amount of Prl in the plasma (P=0·01).
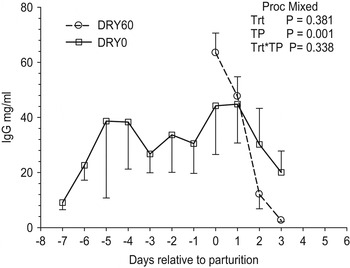
Figure 3 shows the concentration of IgG occurring in the secretions between the two groups. The Dry0 group had low IgG concentration of ∼9 mg/ml at day −7 but then significantly increased in the secretions to a mean of 35·4±6·3 mg/ml across the period from day −5 to day −1. The first milking after parturition with the Dry0 group showed a concentration of 44·2±17·6 mg/ml with a concentration decline following parturition. The Dry60 group had a concentration of 66·86±16·8 mg/ml at the first milking after parturition (day 0) and then showed a concentration decline to 45·12±7·6 mg/ml at day 1 and continued to decline. Treatment groups were not different in concentration after parturition (P=0·36), but the high variation in the Dry0 group shown in Fig. 3 contributed to this finding. While time to parturition changes in IgG concentration was significant (P<0·001), there was no treatment*time to parturition interaction (P=0·34). Interestingly, the Dry0 group treatment cows expressed high variation in the IgG concentration at any one time point around parturition after the initial increase.
Immunoglobulin G (IgG) concentration in dairy cow secretions around the time of parturition (TP) that had a 60-d dry period (Dry60) or were continuously milked (Dry0). Data are the LSMEANS±sem. Trt=Dry period length (Dry0 or 60); TP=time to parturition; Trt*TP=interaction between Trt and TP.

Timing of peak IgG concentrations
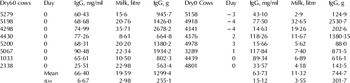
Table 1 shows the timing of IgG peak concentrations between the two groups. While the Dry60 group all exhibited the highest IgG concentration at day 0, the Dry0 group had variable highest concentration days that ranged from −4 d to +3 d relative to parturition. The average of the peak concentrations of the Dry0 group was 63·73±42·77 and was not different than the Dry60 group peak concentration average of 66·86±16·8 (P=0·83). However, this is an artificial comparison in that it compares peak IgG concentrations that for the Dry0 cows appear on different days. Furthermore, two cows within the Dry0 group (4341 and 4978) were clearly deficient in IgG concentration relative to calf feeding and reduction of infection risks (Quigley & Drewry, Reference Quigley and Drewry1998). Conversely, only one cow within the Dry60 group (2338) had below the IgG concentration recommended for optimal calf health (Tyler et al. Reference Tyler, Steevens, Hostetler, Holle and Denbigh1999).
Timing of peak IgG concentration and mass occurring in the continuously milked cows (Dry0) compared with cows dry for 60 d (Dry60)

Secretions of the Dry0 cows
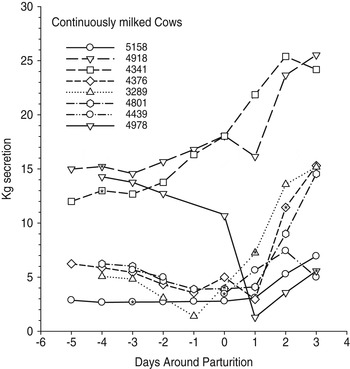
Figure 4 shows the variance in milk secretion among the Dry0 cows from day −5 to day 3. The asterisk (*) in Fig. 4 indicates the day of maximal IgG concentration that corresponds with Table 1 data. Most cows maintained a rather constant secretion rate until around parturition when milk secretion increased. Only one cow (4978) had a decline in milk secretion that plummeted after parturition and then began a gradual increase.
Milk secretion in Dry 0 cows around the time of parturition. Data are the LSMEANS±sem. * indicates the day of maximal IgG concentration.

IgG mass in pre-partum secretions
Figure 5 shows the mass recovered in the secretions following parturition. The Dry0 group showed an average mass of 255±101 g during the four collection days and was not different between the days sampled (days 0–3). The Dry60 group was significantly greater in IgG mass at days 0 and 1 (P<0·01) when compared with the Dry0 group, but the two were not different in mass at days 2 and 3 of milking. There was a significant time to parturition effect (TP, P=0·01) due to the drastic decline in the Dry60 treatment group. Interestingly, the sum of IgG mass in the four milkings after parturition was 1028±104 g compared with 2693±557 g for Dry0 and Dry60, respectively. Thus, less mass of IgG was produced after parturition in the Dry0 cows. However, if the pre-parturition mass is taken into consideration for the Dry0 cows (35·4 mg/ml×6070 l/d×6 pre-partum days), then an additional 1289 g IgG was produced by the Dry0 group. Adding the known post parturition 1028 g to the theoretical 1289 g from the pre-partum calculation suggests that these cows produced an average of 2317 g of IgG during their colostrogenesis period. This appears to be similar to the 2793 g produced for the Dry60 cows.
Immunoglobulin G (IgG) mass in dairy cow secretion around the time of parturition (TP) that had a 60-d dry period (Dry60) or were continuously milked (Dry0). Data are the LSMEANS±sem Trt=Dry period length (Dry0 or 60); TP=time to parturition; Trt*TP=interaction between Trt and TP. *=IgG mas at the same day are different (P<0·02)

Discussion
Colostrum quality is important for the newborn dairy calf. Provision of adequate mass of IgG gives the newborn the least risk of disease (Quigley & Drewry, Reference Quigley and Drewry1998). Shortened dry periods or continuous milking with alterations in the time of the dry period are under investigation (Swanson, Reference Swanson1965; Annen et al. Reference Annen, Collier, McGuire, Vicini, Ballam and Lormore2004; Kuhn et al. Reference Kuhn, Hutchison and Norman2006; Fitzgerald et al. Reference Fitzgerald, Annen-Dawson, Baumgard and Collier2007; Madsen et al. Reference Madsen, Nielsen, Andersen and Ingvartsen2008; Klusmeyer et al. Reference Klusmeyer, Fitzgerald, Fabellar, Ballem, Cady and Vincini2009; Schlamberger et al. Reference Schlamberger, Wiedenmann, Viturro, Meyer and Kaske2010) but the effect of a shortened dry period on the production of colostrum is controversial with some reports of lower colostrum IgG concentrations and some reports of no change.
It is surprising that although milked twice daily, the Dry0 cows recovered approximately the same concentration of IgG in their subsequent secretions after the initial increase occurring at day −5. Gross et al. (Reference Gross, Kessler, Bjerre-Harpoth, Dechow, Baumrucker and Bruckmaier2014) showed that the transcytosis of IgG into mammary secretions can be very rapid when the gland is emptied during the pre-partum period.
The continuously milked cows were producing ∼8·28 kg/d of secretions prior to parturition. Considering that a newborn calf can consume approximately 2 kg of colostrum in the first drinking, sufficient is present pre and post parturition in the continuously milked cows (Dry0) to provide the calf with an adequate volume. However, the IgG concentration of the Dry0 cows averaged below the recommended values (50 mg/ml; Tyler et al. Reference Tyler, Steevens, Hostetler, Holle and Denbigh1999) and two of the Dry0 cows had very poor IgG concentrations.
The initiation and termination of colostrum formation has been thought to occur with the decline in P4 concentration in the blood and to be further inhibited by the increased appearance of Prl (Guy et al. Reference Guy, McFadden, Cockrell and Besser1994; Barrington et al. Reference Barrington, Besser, Gay, Davis, Reeves, McFadden and Akers1999, Reference Barrington, McEwen, Huyler and Besser2000). Our finding that pre-partum P4 is at a lower concentration in the blood of the continuously milked cows (Dry0) may be explained by the appearance of P4 in pre-partum mammary secretions. Keller et al. (Reference Keller, Chew, Erb and Malven1976) showed that pre-partum mammary secretions contain ∼1 μg/ml of P4 and this could account for the lower concentrations occurring in the blood pre-partum. Because milk removal was not occurring in the Dry60 cows, the P4 was at a higher concentration (∼7 ng/ml vs. ∼5·8 ng/ml). This also could be an explanation for the higher area under the curve for Prl in the Dry60 cows.
We showed that the neither the timing of the decline in P4 nor the timing of the increase in Prl has any effect upon the appearance of IgG concentration or mass in the secretions of continuously milked cows. While the concentration of IgG in the post-partum secretions of Dry0 and Dry60 cows declines, the mass continues to appear at a constant rate in Dry0 cows that either hormone seems to affect.
The variation in the appearance of peak of IgG concentration among the continuously milked cows is interesting. On average, somewhere around 6 d pre-partum, colostrum concentration appears to increase in the Dry0 cows. As a consequence of continuous milking, the range in peak IgG concentration for each cow was large (days −4 to +3) indicating that each animal seemed to reach its peak concentration at different times during the experiment, one reaching that peak on day 3 following parturition. This suggests that each animal initiated maximal colostrum transfer rates at different time independent of parturition and P4 and Prl changes. This finding also suggests that a standard collection time either pre- or post partum for continuously milked animals would be difficult to establish. Nevertheless, because these cows are continuously milked and the IgG is actively removed, perhaps providing a day or two of non-milking prior to parturition would allow for the IgG to accumulate so that the IgG concentration and mass would be higher following parturition. Gross et al. (Reference Gross, Kessler, Bjerre-Harpoth, Dechow, Baumrucker and Bruckmaier2014) showed rapid recovery of IgG concentrations and mass within a short period prior to parturition.
When considering IgG mass, we showed that the sum of post-partum mass and pre-partum mass from the Dry0 cows was 2317 g. This sum appears to be equal to that of the Dry60 group production of IgG (2793 g). However, the mass of IgG secreted by Dry0 cows following parturition is less that of the Dry60 cows on days 0 and 1. Based upon this finding, it appears that the colostrogenesis capacity of continuously milked cows is not mass transfer impaired; rather the timing of the mass transfer is altered.
Conclusions
The lack of a dry period (continuous milking) resulted in the first detected increase occurring around 6 d before parturition. Furthermore, the first milked colostrum following parturition of the Dry0 cows averaged a lower IgG concentration than that of the traditional Dry60 cows, but owing to high variation among Dry0 cows, this was not statistically different in concentration. However IgG was different in total mass between Dry0 and Dry60 cows. We attribute the Dry0 cow colostrum lower concentration at parturition to continuous removal of IgG, the variance of peak IgG concentration (day −4 to +3), and the variance of IgG concentrations among the Day0 animals. We conclude that the typical timing of the peak IgG concentration in Dry0 cows is disrupted by the milking process (removal and replacement of the secretions), but not linked to changes in P4 or Prl concentration changes in the blood.
The authors thank the Dutch Dairy Board (PZ, the Netherlands), Product Board Animal Feed (PDV; the Netherlands) and CRV (the Netherlands) for financing the experiment.