I. INTRODUCTION
Multifunctional materials possess multiple desirable attributes concurrently such as improved thermal, mechanical, electrical, chemical properties, etc. Several research studies have highlighted the benefits of utilizing nanoparticles, including carbon nanotubes (CNT), dispersed in a polymer matrix to fabricate multifunctional materials.Reference Breuer and Sundararaj1–Reference Harris3 Such nanocomposites can possess improved mechanical, electrical, and/or thermal properties and have numerous applications as sensors,Reference Li, Thostenson and Chou4–Reference Hu, Karube, Arai, Watanabe, Yan, Li, Liu and Fukunaga6 electrodes,Reference Li, Zhao and Shimizu7,Reference Zhou, He, Zhou, Huang, Li, Wu and Li8 actuators,Reference Tahhan, Truong, Spinks and Wallace9–Reference Bartholome, Derre, Roubeau, Zakri and Poulin11 structural materials,Reference Allaoui, Bai, Cheng and Bai12,Reference Bekyarova, Thostenson, Yu, Kim, Gao, Tang, Hahn, Chou, Itkis and Haddon13 adhesives,Reference Saeed and Zhan14,Reference Yurdumakan, Raravikar, Ajayan and Dhinojwala15 etc.
Piezoresistance is a passive phenomenon that can be used for sensing of load/pressure through variations in a material's electrical resistance. The mechanisms of piezoresistance can vary between materials, and through various design configurations, these materials can be used for force, pressure, and flexure sensing. One mechanism is found in conventional metallic strain gages commonly used in structural strain monitoring. These sensors rely on resistance change because of a changing geometry (definable by their Poisson's ration) due to external strain.Reference Webster16 Metallic strain gages possess appreciable linearity and sensitivity, measurable by gage factors (change in resistance: change in strain) as high as 2, however, they are limited to measuring strains less than 2%. Another piezoresistance mechanism is found in semiconductor-based pressure sensors where deformation of a doped semiconductor lattice will result in a change of the charge carrier's mobility and the material's resistance. The gage factors for these devices are around 200 (recently shown to be as high as 843Reference Rowe, Donoso-Barrera, Renner and Arscott17). However semiconductor-based pressure sensors are also limited to small strain ranges, which are around 0.5%.
A third piezoresistance mechanism, which is the focus of this study, is found in composites containing conductive fillers. These composites consist of a soft material (e.g., polymers, rubbers) filled with a conductive filler. The interparticle distances of the filler must be such so as to allow for formation of conductive paths across one measurement surface to the other. These conductive paths form when the concentration of fillers reaches a critical threshold value described by percolation theory.Reference Bloor, Donnelly, Hands, Laughlin and Lussey18,Reference Bauhofer and Kovacs19 Deformation of the conductor filled composite will change the mean particle distance and therefore change the material's resistivity. Such materials possess appreciable sensitivities with gage factors in the range of 2–10. Although conductive polymer composites suffer from the disadvantages of nonlinearity, hysteresis, and temperature drifts, they are operational over large strains (±100% for elastomers) and are simple and cost-effective to manufacture.Reference Webster16 These advantages make them potential sensing elements for applications requiring compliant materials such as electronic textiles, artificial skins, and other large deformation measurements.Reference Carpi and De Rossi20
Several recent studies have investigated the piezoresistance of conductive nanoparticle composites. Bautista-Quijano et al.Reference Bautista-Quijano, Aviles, Aguilar and Tapia21 examined the piezoresistance of composites of polysulfone and multiwall carbon nanotube (MWNT), fabricated using solvent casting. The composites, containing only 0.5 wt% MWNT, were applied as strain gages for failure testing of aluminum and evaluated against conventional metallic strain gages. Loh et al.Reference Loh, Lynch, Shim and Kotov22 fabricated thin-film strain sensors by dispersing single-wall carbon nanotubes (SWNT) into poly(sodium 4-styrenesulfonate) and poly(vinyl alcohol) by layer-by-layer processing. The nonlinearity, decay, and hysteresis observed in the piezoresistance were predicted using an equivalent RC-circuit model. Hu et al.Reference Hu, Karube, Yan, Masuda and Fukunaga23 have modeled the piezoresistance of epoxy-MWNT composites using Monte–Carlo simulations of 3D resistor networks. Investigations by Knite et al.Reference Knite, Tupureina, Fuith, Zavickis and Teteris24 and by Wichmann et al.Reference Wichmann, Buschhorn, Gehrmann and Schulte25 have compared the strain sensing capability between carbon black and MWNT in poly(isoprene) composites. Studies by Chen et al.Reference Chen, Chen and Lu26 and Stubler et al.Reference Stubler, Fritzsche and Kluppel27 have examined hysteresis issues in piezoresistance of conductive composites.
Lu et al.Reference Lu, Lu, Bermak and Lee28 have found the gage factor of PDMS–MWNT composites to be as high as 12. They also demonstrated the applicability of these composites to MEMS through lithography-assisted fabrication of micropressure sensors. Hwang et al.Reference Hwang, Jang, Hong, Kim, Han, Shin and Park29 have investigated the effect of surface modification of MWNT for better dispersion in PDMS and found improvements in piezoresistance sensitivity. Dang et al.Reference Dang, Jiang, Xie, Yao, Zhang and Bai30 have fabricated piezoresistive PDMS–MWNT composites using high and low aspect ratio MWNTs.
Further property enhancements of polymer nanocomposites can be achieved by imparting a cellular morphology in them with the aid of a compatible solvent. Inducing a porous structure in composites can dramatically alter their physical properties, where the degree of change is influenced by the quality of the pore structure. These porous composites offer the benefit of higher specific properties resulting in weight and cost savings for final components.Reference Klempner and Frisch31 There is also the possibility of achieving enhanced mechanical properties of these porous composites by orienting the MWNTs along cell walls during the manufacturing process as demonstrated recently with organo-modified nanoclay particulates dispersed in polystyrene.Reference Strauss and D'Souza32
The objective of this study is to investigate the effect of MWNT concentration and porous structure on the properties of TPU–MWNT composites prepared by high shear melt mixing. The thermal, electrical, piezoresistive properties of the composites and porous composites are investigated and correlated with the observed morphology of the composites.
II. EXPERIMENTAL
A. Materials
A polyester-type thermoplastic polyurethane (TPU) was used as the matrix phase (Desmopan 385E, Bayer, Leverkusen, North Rhine-Westphalia, Germany). The TPU has a density of 1.2 g/cm3. The glass transition temperature and the melt temperature of the TPU were −50 and 200 °C, respectively. MWNTs were used as the nanoparticle filler phase in this study (NC7000, Nanocyl, Sambreville, Belgium). The MWNT had a reported diameter of 10 nm, average length of 1.5 μm giving them an approximate aspect ratio of 150. The reported carbon purity of the MWNT was 90%, and the surface area was approximately 250 m2/g.
B. Nanocomposite preparation
Nanocomposites between TPU and MWNT were prepared by a high shear mixing process on a 15 mL benchtop twin screw microcompounder (DSM 15, DSM Xplore, Geleen, Netherlands). The MWNT powder (in concentrations between 0 and 10 wt%) and TPU pellets were added to the microcompounder simultaneously. The high shear mixing process was performed at a temperature of 200 °C and mixing speed of 200 rpm for 10 min under an inert nitrogen gas purge environment. The extruded material was then cut into pellets and compression molded (12 Ton Carver Hot Press) into a disc shape geometry (20-mm diameter, 0.5-mm thick) at a pressure of 1.3 MPa and a temperature of 200 °C for a melt time of 5 min and press time of 5 min.
C. Porous nanocomposite fabrication
Porous nanocomposites were prepared through the phase separation of a TPU nanocomposite-CO2 solid solution in a temperature-quenched batch process.Reference Rizvi, Kim and Naguib33 The single-phase solid solution was prepared by saturating the nanocomposite inside a high pressure vessel filled with CO2 gas at 4.13 MPa (600 psi) for 22 h. The time required to form a saturated single phase polymer–solvent solution can be determined by estimating the characteristic diffusion length (cm) given in Eq. (1):
 $$L_d = \sqrt {4Dt} \quad ,$$
where D is the solvent diffusivity (cm2/s) in the polymer and t is the time (s) allowed for saturation. This length characterizes the distance where half of the surface (maximum) concentration is reached in a specified time during the gas sorption process. Due to the variety of thermoplastic polyurethane chemistry available, acquiring accurate carbon-dioxide diffusivity values is very challenging. However, a review of two literature sourcesReference Matsunaga, Sato, Tajima and Yoshida34,Reference Ito, Matsunaga, Tajima and Yoshida35 suggests that the diffusivity of carbon dioxide in various TPUs between temperatures of 25–40 °C is in the range of 0.9 × 10⁻⁷ to 38.9 × 10⁻⁷ cm2/s. Based on a saturation time of 22 h and the literature diffusivity values, the characteristic diffusion lengths are in the range of 1.7–11.1 mm. These values are much larger than the sample half-thickness length (0.5/2 = 0.25 mm); therefore, 22 h was deemed a sufficient enough period for saturating 0.5-mm-thick TPU samples with carbon dioxide.
After saturation, the vessel was rapidly depressurized causing a thermodynamic instability and a driving force for gas–polymer phase separation. This phase separation, in the form of pore nucleation, cannot be initiated unless the polymer viscosity is lowered, which is done by exposing the material to elevated temperatures. Immersion of the saturated TPU–MWNT nanocomposites in a heated water bath at 95 °C for 10 s was found to be sufficient to cause the gas–polymer phase separation. During phase separation carbon-dioxide gas bubbles nucleate and grow. The gas bubble nucleation and growth process were ceased by lowering the material's temperature through immersion in a cold water bath.
D. Characterization methods
Morphology of the freeze-fractured and platinum-sputtered composite and porous composite cross-sections was observed using a JSM 6060 (JEOL Corp., Tokyo, Japan) scanning electron microscope (SEM). The pore sizes were estimated by measuring and averaging the lengths of at least 50 porous features in a contained area. The number density of the porous features was estimated using Eq. (2) (Ref. Reference Naguib, Park, Reichelt and Panzer36).
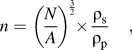 $$n = \left( {{N \over A}} \right)^{{3 \over 2}} \times {{{\rm{\rho }}_{\rm{s}} } \over {{\rm{\rho }}_{\rm{p}} }}\quad ,$$
where N is the number of pores counted in a contained area A. The pore density with respect to the initial sample volume is desired; therefore, a ratio of the solid (ρs) and porous (ρp) material densities, assuming a constant mass, has to be factored.
The thermal properties and decomposition behavior of the TPU–MWNT nanocomposites were determined using a Q2000 (TA Instruments, New Castle, DE) differential scanning calorimeter (DSC) and a Q50 (TA Instruments) thermal gravimetric analyzer (TGA), respectively. The DSC was operated at 10°C/min in a heat–cool–heat procedure between the limits of −80 and 220 °C. Glass transition and melting information was obtained from analysis of the second heating run, whereas crystallization information was acquired from the first cooling run. The TGA was operated at 20 °C/min up to 600 °C, and the onset of thermal decomposition and residual mass were obtained.
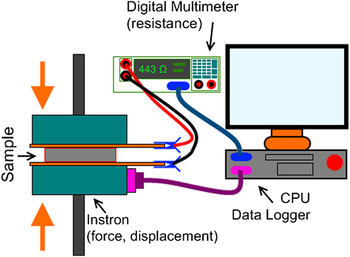
The electrical conductivity and permittivity of the TPU–MWNT nanocomposites were obtained in a dielectric impedance analyzer (Alpha-N Analyzer, Novocontrol Technologies, Hundsangen, Germany) operated at 1 Vrms scanning between a frequency of 10−1–105 Hz. The piezoresistance behavior of the TPU–MWNT nanocomposites was captured using a custom-made force–resistance measurement setup (Fig. 1). The setup consisted of a high precision source meter (model 2400, Keithley Instruments Inc., Cleveland, OH) in a two-wire resistance measurement configuration coupled with a micromechanical testing system (model 5848, Instron, Norwood, MA) reading resistance and stress–strain information to a National Instrument's LabView data acquisition system. Starting from a preload of 50 N, the disc samples for piezoresistance characterization were compressed between two copper electrodes (insulated on the opposite side) in a quasistatic condition at a rate of 0.1 mm/min (0.003 s−1) until a final force of 10 kN was reached. Three or more samples were used for all electrical and piezoresistance testing and averaged, and prior to testing, the samples were cleaned with ethanol, dried, and platinum sputter-coated to ensure adequate electrical contact.
Schematic of piezoresistance characterization setup.

III. RESULTS AND DISCUSSIONS
A. Morphology of TPU–MWNT nanocomposites
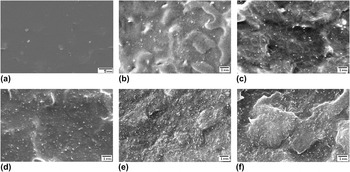
Fundamental to any understanding of composite properties is the study of its internal structure and the structure of its constituent phases. Particular importance must be given to the study of the smallest feature sizes as they possess the highest interfacial area and potential for interaction between the constituent phases. The morphology of the processed TPU–MWNT nanocomposites was analyzed using a SEM, and the obtained morphologies are shown in Fig. 2. Thermoplastic polyurethane has a flat surface free from any fine-sized features that are not attributable to the fracture process. With the addition of just 0.25 wt% MWNT [Fig. 2(b)], fine-sized (<0.1 μm) features are visible, which are attributed to MWNT. These features appear brighter suggesting that they are more conductive than their surroundings. Further addition of MWNT [Figs. 2(c)–2(f)] results in an increased MWNT density in the nanocomposites. At higher concentrations of 4, 6, and 10 wt%, some aggregation of MWNT is observed but to a large extent, individual MWNT dispersion is evident and their network remains intact.
SEM cross-sections of (a) TPU and TPU–MWNT nanocomposites showing the MWNT dispersion in (b) 0.25, (c) 1, (d) 4, (e) 6, and (f) 10 wt% MWNT nanocomposites.

B. Fabrication of porous TPU–MWNT nanocomposites
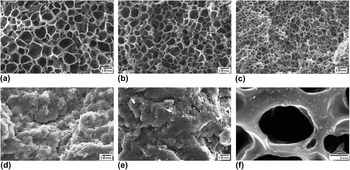
Introducing porosity in the nanocomposite results in significantly contrasting morphologies (Fig. 3), which depend on the amount of MWNT present. Thermoplastic polyurethane [Fig. 3(a)] displays significant volume expansion (3.8x) and results in a morphology with large-sized pores (6.9 μm) and a pore density of 8.7 × 10⁹ pores/cm3. Introducing MWNT has the effect of decreasing pore size and increasing pore density. At a low MWNT content of 1 wt% MWNT [Fig. 3(b)], the pore size is 4.1 μm and the pore density is 2.7 × 10¹⁰ pores/cm3. An optimally small pore size (2.7 μm) and maximum pore density (6.7 × 10¹⁰ pores/cm3) is achieved in nanocomposites containing 4 wt% MWNT [Fig. 3(c)]. At the composition of 6 wt% MWNT, the porosity is no longer homogenous throughout the material which now consists of regions devoid of any pores. Despite the average pore size being 1.8 μm, the discontinuous porosity in the material results in a low pore density of 1.0 × 10⁹ pores/cm3.
SEM morphologies of porous (a) TPU and TPU–MWNT nanocomposites containing (b) 1%, (c) 4, (d) 6, and (e) 10 wt% MWNTs. High magnification (f) image of 4 wt% nanocomposite reveals concentrated MWNT features surrounding pores.

The significant variation in pore morphology as a result of MWNT addition can be understood by considering the competing effects of MWNT influence on (i) heterogeneous pore nucleation and (ii) nanocomposite viscosity on the foaming process which consists of pore nucleation, growth, and coalescence. The existence of a finely dispersed MWNT phase provides interfaces which reduce the critical pore diameter thereby increasing the probability of heterogeneous pore nucleation occurring.Reference Shen, Zeng and Lee37 Therefore, a fine dispersion of MWNT in polymeric composites is desired for achieving a high pore density and the associated advantages. At the same time, addition of fine-sized solid particles like MWNT causes a significant increase in the nanocomposite viscosity and imparts the material with an elastic (load bearing) character.Reference Rizvi, Kim and Naguib33,Reference Rizvi, Khan and Naguib38 This increased viscosity hinders the pore growth phenomenon and limits the final pore size that is achieved. If the viscosity of the material is low enough and the pore growth phenomenon is allowed to continue further, then pores impinge each other and begin to coalesce. Pore coalescence is evident by large pore sizes and broader size distributions.
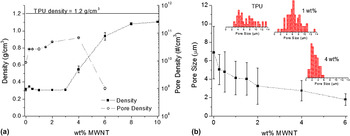
The density and pore density (# of pores/cm3) of the TPU–MWNT nanocomposites are plotted in Fig. 4(a), whereas the average pore size and pore size distributions are plotted in Fig. 4(b). At low MWNT amounts, the density of the nanocomposites is quite low at 0.26 g/cm3, which is similar to that of TPU. Although addition of low amounts of MWNT promotes a slightly higher pore density [Fig. 4(a)], there is a concomitant decrease in pore size [Fig. 4(b)] resulting in a nanocomposite with a density similar to TPU. Such marginal gains in pore density and reduction in pore size, at low MWNT content, can be explained by the possibility of pore coalescence occurring, as the viscosity of the nanocomposites is low. At higher MWNT amounts, the viscosity of the nanocomposites is significantly higher as a result of MWNT networks formed and percolation being achieved. A consequence of rheological percolation is the pseudo-solid (elastic) behavior of the nanocomposites,Reference Rizvi, Khan and Naguib38 which assists in restricting pore growth and pore coalescence explaining the increasing pore density and decreasing pore size beginning at 2 wt% MWNT [Figs. 4(a) and 4(b)]. The maximum pore density and minimum pore size for a fully homogenous porous nanocomposite are achieved at an MWNT content of 4 wt%. A narrowing pore size distribution [Fig. 4(b)] as the MWNT content is increased provides further credence to MWNTs restricting pore growth and coalescence.
Plots of (a) bulk density, pore density, and (b) pore size of porous TPU–MWNT nanocomposites and their dependence on MWNT content.

C. Thermal properties of TPU–MWNT nanocomposites
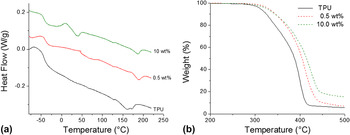
The thermal properties of the TPU–MWNT composites were investigated through DSC and TGA experiments. The glass transition, melting, and crystallization behaviors were observed using a heat–cool–heat procedure in the DSC. The second heat runs for TPU and TPU nanocomposites containing 0.5 and 10 wt% MWNT are illustrated in Fig. 5(a). The addition of only 0.5 wt% MWNT increased TPU's apparent glass transition temperature from −50.6 to −44.3 °C. Also the addition of 0.5 wt% MWNT increased the melting and crystallization temperatures and narrowed their respective peaks. Further addition of MWNT (up till 10 wt%, shown) does not seem to have any noticeable effect on the melting or crystallization behavior of TPU. A slight decrease in the glass transition temperature was observed in composites with higher MWNT (4 wt% and more) content. This corresponded with the emergence of another step-transition behavior [Fig. 5(a)] in these composites at approximately 20 °C.
Thermograms plotting the (a) DSC heat flow and (b) TGA weight loss for TPU–MWNT nanocomposites.

The decomposition behavior of the composites was improved with the addition of MWNT. The addition of 0.5 wt% MWNT improved the peak decomposition point of TPU (400 °C) by 11–411 °C. Further MWNT additions up to 2 wt% resulted in increasing the peak decomposition temperature up to 424 °C, after which no further improvements were observed. A similar observation can be made for the glass transition temperature in the DSC experiments. At high compositions (>2 wt%), only marginal gains in thermal properties are noted because further MWNT addition does not significantly contribute to the dispersed MWNT phase. Rather most MWNT addition exists in the form of aggregates which have significantly reduced interfaces for interaction with the polymer and therefore have a smaller effect on the polymer's thermal properties.
D. Electrical properties of TPU–MWNT nanocomposites
The electrical properties of solid and porous TPU–MWNT nanocomposites were investigated using alternating current dielectric impedance spectroscopy (DIS). Impedance spectroscopy consists of applying a voltage (1 V) at various frequencies and measuring the output current, from which impedance can be determined. The impedance information can be used to estimate its conductivity (Fig. 6) and permittivity (Fig. 7) through fitting the data to an R–C circuit in parallel.Reference Barsoukov and Macdonald39 The conductivity and permittivity information can be described in real (in phase) and imaginary (out of phase) components of which the real component at low frequencies describes a more direct-current (DC)-based interpretation. At any particular frequency, ω, the complex conductivity, σ*, of a material is related to its complex permittivity, ε*, by Eq. (3) (Ref. Reference Zhihua, Jingcui, Yanfeng, Yangyu and Yantao40).
 $$\sigma ^* = \sigma \prime - i\sigma \Prime = i\omega \varepsilon _0 \varepsilon ^* = i\omega \varepsilon _0 (\varepsilon \prime - i\varepsilon \Prime)\quad ,$$
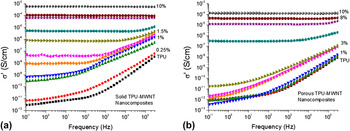
where σ′ is the in-phase and σ″ is the out-of-phase component of conductivity, whereas ε′ is the in-phase and ε″ out-of-phase component of permittivity, and ε0 is the permittivity of free space. The real component of electrical conductivity of solid and porous TPU–MWNT composites with respect to applied frequency is plotted in Figs. 6(a) and 6(b), respectively. The electrical conductivity of solid TPU [Fig. 6(a)] is dependent on applied frequency, and at a low frequency of 0.1 Hz, it is 2.8 × 10⁻¹² S/cm, which is the range of insulating materials. Addition of 0.25 wt% increases the conductivity to 6.6 × 10⁻¹² S/cm; however, the frequency dependence is maintained suggesting insulative behavior. This behavior is evident until an MWNT composition of 1.5 wt%, where frequency independence is exhibited at low frequencies. This behavior is also followed with a large increase in conductivity (7.4 × 10⁻⁹ S/cm at 0.1 Hz), which is caused by networking of MWNT particles. The electrical charge transport is now supported by MWNT particles in the network, which can be either by (i) electron tunneling between particles or (ii) interparticle contacts. Further, MWNT addition to the nanocomposites promotes MWNT networking and increases the conductivity of the composites. At 10 wt% MWNT, the electrical conductivity is 5.8 × 10⁻⁴ S/cm, which is within the minimum range of 10−5 S/cm required for electrostatic discharge (ESD) material applications.Reference Ikkala, Laakso, Vakiparta, Virtanen, Ruohonen, Jarvinen, Taka, Passiniemi and Osterholm41,Reference Pud, Ogurtsov, Korzhenko and Shapoval42
Electrical conductivity-frequency dependence for (a) solid and (b) porous nanocomposites containing various amounts of MWNTs.

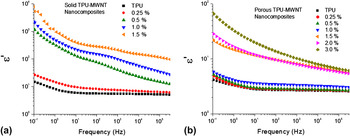
Permittivity-frequency dependence for (a) solid and (b) porous nanocomposites containing various amounts of MWNTs.

The electrical conductivity of porous TPU–MWNT nanocomposites is shown in Fig. 6(b). In general, imparting a porous morphology on the nanocomposite has the effect of reducing the conductivity. At low MWNT compositions (up till 3 wt%), a frequency dependent insulating behavior is observed. There is a large increase in conductivity at 4 wt% MWNT (3.1 × 10⁻⁷ S/cm), and frequency independence is observed, suggesting the establishment of an interconnected network of MWNT. Further addition of MWNT results in an increase in conductivity (1.3 × 10⁻⁴ S/cm); however, the overall values of the porous nanocomposites are lower than that of their solid counterparts.
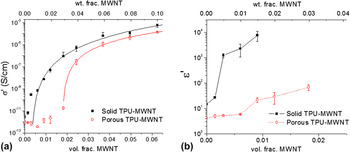
To understand the transition from an insulative material to an electrically conductive one, the conductivity can be plotted with reference to the particulate volume fraction content [Fig. 8(a)]. An “S-curve” transition from an insulating to conducting material for TPU–MWNT solid and porous nanocomposites is apparent in this plot. The statistical percolation threshold for a conductive-networked system can be described using the following power law in Eq. (4) (Ref. Reference Bauhofer and Kovacs19).
 $${\rm{\sigma }} = {\rm{\sigma }}_0 \left( {\phi - \phi _0 } \right)^t \quad ,$$
where σ is the conductivity of the system,  $\phi$ is the filler volume fraction,
 $\phi _0$ is the fitted percolation threshold, and σ0, t are fitting constants. The percolation threshold value can be obtained by linear regression of the logarithmic form of Eq. (4). A percolation threshold of 0.301 vol% (0.501 wt%) was obtained for solid nanocomposites with an R 2 of 0.993, while a threshold of 1.795 vol% (2.965 wt%) was obtained for porous nanocomposites with an R 2 of 0.999. The lower conductivity values and higher percolation point of porous nanocomposites can be explained by two consequences of foaming: (i) larger path for electrons to travel due to the existence of pore obstacles and (ii) increase of interparticle MWNT distance in the pore wall material during the pore growth process. Incorporating homogenously distributed pores (Fig. 3) in the nanocomposites would provide obstacles for electron transport from one electrode to another. A larger path for electron transport increases the likelihood of electron scattering to occur and would result in a reduced conductivity. Also, the pore growth process involves biaxial expansion of pore walls which will increase the interparticle distance between MWNT surrounding the pores. Therefore, a greater amount of MWNT (3 wt%) is required to reduce the interparticle distance and completely achieve interconnectivity (percolation) between the filler phase in the porous nanocomposites allowing for sufficient electron conduction to occur.
Composition dependence of (a) electrical conductivity and (b) dielectric permittivity of TPU–MWNT nanocomposites measured at 0.1 Hz.

The dielectric permittivity is an important material property, which is a measure of the capacity to store electrical charges. Figures 7(a) and 7(b) are plots of permittivity at various frequencies and MWNT content. The permittivity of solid TPU is frequency dependent and is 14.9 at 0.1 Hz. The increase in permittivity at low frequencies corresponds to interfacial polarization (Maxwell–Wagner) effect,Reference Kremer and Schonhals43 which results from charge build-up and its contribution to the electric field, at either the (i) inner-boundary layers or (ii) electrode–sample interface. In TPU, this effect is from charge build-up at the electrode–sample interface, since a sample size (0.5 mm) would facilitate charge migration and accumulation at the electrode at low frequencies. The addition of 0.25 wt% MWNT into TPU increases the permittivity to just 27.3 indicating that the majority of the interfacial polarization is still at the electrodes. A large increase in permittivity to 1240 is observed [Fig. 7(a)] at 0.5 wt% MWNT, which can be attributed to the greater contribution of interfacial polarization at MWNT–polymer interfaces as opposed to just at the electrode–sample interface for TPU and 0.25 wt% MWNT nanocomposite. This effect becomes more pronounced as more MWNTs (up till 1.5 wt%), hence more interfaces, are incorporated in the nanocomposites. Beyond 1.5 wt% MWNT, the nanocomposites lose their dielectric character because of the complete formation of an interconnected network of conductive MWNT particles.
The frequency and composition dependence on dielectric permittivity of porous TPU–MWNT nanocomposites are plotted in Fig. 7(b). Introducing porosity into TPU has the effect of reducing the material's apparent permittivity to 4.2 at 0.1 Hz. Interfacial polarization is still present in porous TPU indicating the presence of a build-up of charge at the electrode–sample interface despite the presence of homogenously distributed pores throughout the material. Addition of low amounts of MWNT (up till 1.0 wt%) provides only marginal improvements in permittivity suggesting minimal interfacial polarization at MWNT–polymer interfaces. A significant improvement in permittivity to 219 is observed at 1.5 wt% MWNT, which continues with further MWNT addition of 2 and 3 wt%.
Figure 8(b) compares MWNT composition dependence of real component of permittivity of solid and porous TPU–MWNT nanocomposites. For both, solid and porous nanocomposites, a unique composition can be identified, 0.5 wt% for solid and 1.5 wt% for porous, where there is a significant increase in permittivity due to the contributions of MWNT–polymer interfaces in storing charge. For the same composition, the porous nanocomposites have a reduced permittivity in comparison to their solid counterparts. Similar to the observation noted with conductivity [Fig. 8(a)], the reduction in permittivity can be explained by the biaxial expansion of the pore wall material during the foaming process, which would increase the interparticle distances between MWNT. The increased interparticle distances in the porous nanocomposites result in reduced interconnectivity and interfacial area at active sites for charge polarization thereby decreasing permittivity.
E. Piezoresistance of solid and porous nanocomposites
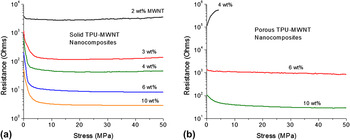
The piezoresistance (resistance–stress) relationship for solid land porous TPU-MWNT nanocomposites was observed on a custom-made force–resistance setup (Fig. 1) and the averaged behavior for the two types of materials is depicted in Fig. 9. The solid samples were compression molded discs, approximately 20 mm in diameter and 0.5 mm in thickness. The porous samples were flexible discs, approximately 13 mm in diameter and 0.6–0.9 mm in thickness depending on their degree of expansion. The piezoresistance of solid TPU–MWNT nanocomposites is illustrated in Fig. 9(a). Compositions of nanocomposites less than 2 wt% MWNT did not exhibit sufficient conductivity for piezoresistance characterization. The piezoresistance behavior can be described in terms of two compression regions, (i) an initial contact region and (ii) elastic compression region. During the initial contact region (stress < 3 MPa), the resistance of all solid nanocomposite decreases as contact is being established between the electrodes and the sample. The least decrease is exhibited by 2 wt% MWNT, whereas the most decrease is observed for higher MWNT compositions of 6 and 10 wt%. At intermediate stress levels (3–25 MPa), contact is well established and the nanocomposites undergo elastic compression. During elastic compression, the resistance remains steady with respect to change in stress. At higher stresses (>25 MPa), nanocomposites with a low MWNT content (2, 3, and 4 wt%) exhibit an increase in resistance, whereas those with a high MWNT content (6 and 10 wt%) continue to exhibit a steady resistance, with respect to change in stress.
Absolute resistance–stress plots depicting the piezoresistance behavior for (a) solid and (b) porous TPU–MWNT nanocomposites.

The piezoresistance of porous TPU–MWNT nanocomposites is depicted in Fig. 9(b). Compositions less than 4 wt% MWNT were insufficiently conductive for piezoresistance characterization. The piezoresistance response of porous nanocomposites was dependent on the type of pore morphology present in the nanocomposite. Porous nanocomposites containing 4 wt% MWNT had a high initial resistance of 106 kΩ, which continued to increase with application of stress. A final value of approximately 550 kΩ was achieved beyond which the samples had compressed such that electrodes were in direct contact with each other. The nanocomposites containing 6 wt% MWNT maintained a steady resistance response with respect to change in stress. Porous nanocomposites with 10 wt% MWNT content exhibited a response similar to their solid counterpart albeit with a higher resistance and a smaller resistance decrease with respect to change in stress [Fig. 9(b)].
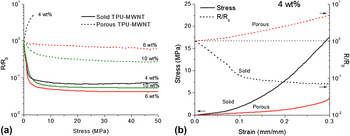
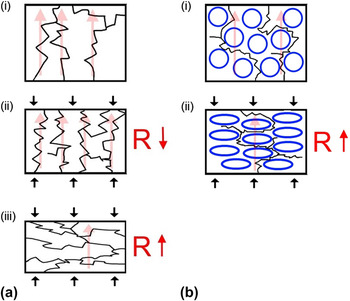
The resistance relative to the initial resistance is a useful quantity for analyzing the degree of piezoresistance exhibited by the nanocomposites during the compression process. Figure 10(a) depicts the relative resistance–stress relationship of solid and porous TPU–MWNT nanocomposites at various MWNT compositions. The shape of the piezoresistance curves in Fig. 10(a) can provide useful insights into the nature of the MWNT network and the mechanisms of electrical conduction in the nanocomposites at a particular stress level. The solid nanocomposites (4, 6, and 10 wt% MWNT) exhibit most of the resistance decrease in the initial contact region. During the initial stages of elastic compression, the resistance undergoes a slight decrease due to a decreasing interparticle distance and more interconnectivity between MWNT particles. At a low MWNT content of 4 wt%, the resistance begins to increase at higher stress levels (>25 MPa). A similar increasing resistance trend is observed for 2 and 3 wt% MWNT nanocomposites [Fig. 9(a)] and is attributed to MWNT network disruption. During high stress compression, the MWNT can become oriented in the plane transverse to the direction of compression. This reorientation, schematized in Fig. 11(a), serves to disrupt the interconnectivity between the MWNT particles in the TPU resulting in a higher resistance at later stages of compression. A similar increase in resistance at later stages of compression is not evident in 6 and 10 wt% MWNT nanocomposites, which could be explained by the large quantity of individual and aggregated MWNTs present in these compositions. Although, the filler particulates can still reorient in the transverse plane at high stresses, the high MWNT content ensures that the interconnectivity is maintained because of a large number of contact nodes within the filler network.
Plot of (a) relative resistance–stress plot for solid and porous TPU–MWNT nanocomposites and (b) stress–strain and relative resistance–strain for a single MWNT composition of 4 wt%.

Illustration of piezoresistance mechanisms proposed for (a) solid and (b) porous nanocomposites.

Porous TPU-MWNT nanocomposites containing 4 wt% MWNT exhibit an increase in resistance (5x) with applied stress. This increase in resistance begins to occur immediately at the beginning of the compression process suggesting a different mechanism of piezoresistance in homogenously porous TPU-MWNT nanocomposites. In contrast to 4 wt%, the 6 and 10 wt% MWNT porous nanocomposites display a piezoresistive behavior similar to their solid counterparts [Fig. 10(a)], although with a lesser degree of sensitivity to stress. The porous structure in these nanocomposites is not homogeneous and consists of sporadically distributed pores within the material, with 6 wt% nanocomposites [Fig. 3(d)] having more evidence of pores than 10 wt% [Fig. 3(e)].
The stress–strain and relative resistance–strain response for solid and porous TPU–MWNT nanocomposites containing 4 wt% MWNT content are plotted in Fig. 10(b). Porous TPU–MWNT nanocomposites containing 4 wt% MWNTs had a homogenous distribution of pores [Fig. 3(c)], with a density of 0.547 g/cm3, average pore size of 2.7 μm, and a pore density of 6.7 × 10¹⁰ pores/cm3. The immediate increase of resistance with compression of porous nanocomposites is in stark contrast to the initial contact and elastic compression-related decrease of resistance for solid nanocomposites. The increase can be understood from consideration of pore compression and its effect on the electron conduction paths throughout the nanocomposites; schematized in Fig. 11(b). During pore compression, MWNT particle networks existing along the pore walls get disrupted resulting in lesser interconnectivity between particles and larger electron conduction paths due to compressed pore obstacles.
IV. CONCLUSIONS
Pressure sensitive solid and porous TPU–MWNT nanocomposites were fabricated and characterized. Porosity was introduced to the composites through the phase separation of a TPU-carbon-dioxide gas solution. The density of the porous nanocomposites was found to be dependent on the amount of MWNT present, with greater amounts (>4 wt%) restricting the degree of pore expansion. The smallest pore size (2.7 μm) and greatest pore density (6.7 × 10¹⁰ pores/cm3) were obtained at an MWNT content of 4 wt%. Interactions between MWNT and TPU were elucidated through calorimetry and gravimetric decomposition, where a small MWNT amount (0.5 wt%) was sufficient to improve the apparent glass transition, crystallization, and decomposition temperatures. In general, the conductivity and permittivity of the porous nanocomposites was lower than their solid counterparts whereas their percolation threshold was higher. The deterioration in electrical properties of the porous nanocomposites was attributed (1) to an increased interparticle distance between MWNT during pore expansion and (2) to the pores acting as obstacles, thereby increasing the charge conduction paths. The piezoresistance (pressure–resistance) behavior of the solid and porous nanocomposites was investigated and found to be dependent on MWNT concentration and nanocomposite microstructure. The resistance in solid nanocomposites with low MWNT content (2, 3, and 4 wt%), increases at high stresses as a result of MWNT network disruption. The resistance remains steady in nanocomposites with high MWNT contents (6 and 10 wt%) as MWNT network disruption is mitigated because of the availability of a large number of interparticle contacts. The resistance in porous nanocomposites containing 4 wt% MWNT underwent an increase with the application of stress, which indicated that pore compression was responsible for disrupting the filler particle network.
ACKNOWLEDGMENTS
The authors would like to acknowledge assistance of Jonathan Yu and Dan Grozea (both of Material Science and Engineering, University of Toronto) with electrical and piezoresistance testing. Financial support for this study is provided by Natural Science and Engineering Research Council (Canada), Canada Research Chairs Program, Canada Foundation for Innovation, and the Ontario Government.