Introduction
Intensive agriculture is characterized by a low fallow ratio, high input of agrochemicals into farming systems, and the intensive tillage of soil designed to maximize crop yields and land-use efficiency. Although intensive agriculture increases crop yields, it also results in many negative problems, such as the reduction of soil organic matter, environmental pollution, residual toxicity, biodiversity loss, and the emergence of resistant pests (Johnson and Villumsen Reference Johnson and Villumsen2018; Matson et al. Reference Matson, Parton, Power and Swift1997; Powles et al. Reference Powles, Preston, Bryan and Jutsum1996; Vandermeer et al. Reference Vandermeer, Van Noordwijk, Anderson, Ong and Perfecto1998). The increasing reliance on agrochemicals in agricultural production has thus proven to be unsustainable and cost-ineffective (Berg Reference Berg2002; Berg and Tam Reference Berg and Tam2018). Finding sustainable ways to produce sufficient food with minimal agrochemical inputs has attracted widespread attention. According to the principle of mutual benefit symbiosis, establishing farming systems with crop–economic animal coculture systems may be an effective way to solve some of the problems caused by intensive agriculture (Wolfe Reference Wolfe2000; Xie et al. Reference Xie, Hu, Tang, Wu, Li, Yuan, Yang, Zhang, Luo and Chen2011). Recently, novel species-diversified farming systems, such as rice–duck, rice–fish, grain–vegetable–pig, and crop–earthworm coculture farming systems, have been gaining in popularity in some Asian countries (Zheng et al. Reference Zheng, Lv, Song, Li, Zhang, Bai and Zhang2018).
In recent years, the ecological and economic value of earthworms has been recognized by farmers. The practice of introducing earthworms into fields has become popular in Shanghai urban agriculture. Zheng et al. (Reference Zheng, Fan, Zhang, Shuang-Xi, Wang, Zhang, Wang, Bin and Wei-Guang2015) reported a significant positive effect of crop–earthworm coculture farming on microbial community activity, which increased the soil microbial metabolic ability of six types of carbon sources. With the extension of crop–earthworm coculture years, the diversity indices of microbial communities were significantly higher than those of the control (Bao et al. Reference Bao, Gui and Tian-shou2000).
For more than 10 yr, corn–earthworm coculture (CE) farming has been applied in Shanghai urban agriculture with good economic effect (Ren and Zhao Reference Ren and Zhao2011). CE farming is the coupling of earthworm breeding and corn (Zea mays L.) cultivation, where growers usually introduce 750 to 1,500 kg ha−1 of juvenile Pheretima guillelmi Kinberg into fields before planting corn. Earthworms function as “ecosystem engineers” (Jones et al. Reference Jones, Lawton and Shachak1994) and are regarded as reliable indicators of soil health (Elmer Reference Elmer2009). They generally have a positive influence on soil structure, the decomposition of litter, and mineralization and cycling of nutrients (Piearce and Lee Reference Piearce and Lee1987), and their activities are important in the rehabilitation, maintenance, or improvement of soil physical and chemical conditions (Hauser Reference Hauser1993). However, populations of earthworms have been reported to be relatively low under modern intensive farming systems (Amador and Avizinis Reference Amador and Avizinis2013; Frazão et al. Reference Frazão, de Goede, Brussaard, Faber, Groot and Pulleman2017). Previous studies showed that intensive tilling and the use of agrochemicals generally reduced earthworm populations in fields (Chan Reference Chan2001; Kladivko et al. Reference Kladivko, Akhouri and Weesies1997). A similar result was reported by Mele and Carter (Reference Mele and Carter1999), who found that conservation-tillage practices that left crop residue on the soil surface tended to support a higher density of earthworms. Moreover, widely used herbicides like glyphosate, 2,4-D butylate, bentazon, butachor, bromoxynil, and atrazine were found to be moderately toxic to earthworms and are not good for earthworm survival (Martin Reference Martin1982; Pizl Reference Pizl1988; Springett and Gray Reference Springett and Gray1992).
Earthworms are important seed dispersers and predators. Studies on earthworm–seed interactions date back to Charles Darwin (Grant Reference Grant1983) and have attracted recent interest as well (Forey et al. Reference Forey, Barot, Decaëns, Langlois, Laossi, Margerie, Scheu and Eisenhauer2011). Earthworms can translocate plant seeds into deep soil layers (Eisenhauer et al. Reference Eisenhauer, Marhan and Scheu2008; Willems and Huijsmans Reference Willems and Huijsmans1994), which prevents seedlings from emerging when seeds are buried below a critical depth (Traba et al. Reference Traba, Azcárate and Peco2004). Earthworms selectively feed on seeds depending on their size, shape, texture, surface structure, and taste (Eisenhauer et al. Reference Eisenhauer, Schuy, Butenschoen and Scheu2009; Piearce et al. Reference Piearce, Roggero and Tipping1994; Shumway and Koide Reference Shumway and Koide1994). A considerable fraction of ingested seeds are digested or lose their germinability within an earthworm’s gut passage (Aira and Piearce Reference Aira and Piearce2009; Decaëns et al. Reference Decaëns, Mariani, Betancourt and Jiménez2003; Laossi et al. Reference Laossi, Noguera, Bartolomé-Lasa, Mathieu, Blouin and Barot2009; Milcu et al. Reference Milcu, Schumacher and Scheu2006). Earthworms can thus influence plant community dynamics. A small-scale field experiment conducted by McTavish and Murphy (Reference McTavish and Murphy2020) showed that grass biomass in their field plots inoculated with earthworms decreased by 28% compared with a control. Frelich et al. (Reference Frelich, Hale, Scheu, Holdsworth, Heneghan, Bohlen and Reich2006) found that earthworm activities reduced the abundance of herbs in a forest.
According to the previous literature, we hypothesized that CE farming possibly reduces the occurrence of weeds in cornfields. In eastern China, weeds are a major constraint to the successful production of corn (Qian and Jiang Reference Qian and Jiang2004). If CE farming exerts a positive role in reducing the occurrence of weeds, the coculture system may reduce herbicide inputs in cornfields and improve environmental quality in agricultural landscapes. CE farming has been practiced in Shanghai for more than 10 yr; however, no studies have been conducted on the effects of CE farming on weed composition and population dynamics. Although some studies support that earthworms can change plant communities through affecting the composition and dynamics of soil seedbanks (Eisenhauer and Scheu Reference Eisenhauer and Scheu2008; Laossi et al. Reference Laossi, Noguera, Bartolomé-Lasa, Mathieu, Blouin and Barot2009; Wurst et al. Reference Wurst, Langel and Scheu2005), most of this research was conducted solely under laboratory conditions. Studies regarding the effects of earthworms on plant communities under natural conditions are rather scarce, none of them focusing specifically on weed composition, species, and population dynamics in cornfields. To fill this knowledge gap, we designed a 5-yr successive field experiment to assess the effects of CE on the composition and diversity of weed communities by introducing earthworms into cornfields.
Materials and Methods
Earthworm Species
Pheretima guillelmi is a native species of China. It is large in size, with a body length of 90 to 250 mm and a width of 5 to 10 mm. The average biomass of adult individuals is about 5 g, and large ones can reach more than 10 g. This species is photophobic and likes to live in warm (optimum temperature of 15 to 25 C), moist (suitable soil moisture content is 25% to 30%), and breathable soils. Its diet is omnivorous and mainly consists of decaying organic material (e.g., stalk waste). It lives in the soil during the day and crawls out of the ground at night to find food. Pheretima guillelmi usually breeds every 3 mo and lays eggs three to four times a year (Zheng and Li Reference Zheng and Li2009).
Study Site
A field experiment was established at the Shanghai Lanhui Eco-agricultural Science and Technology Company Limited in Sanxing Town, Chongming Island, China. The site is located at 31.781°N, 121.255°E with an average elevation of 4 m. The site occurs in a subtropical monsoon climate with an annual mean precipitation of 1,003.7 mm, an annual average temperature of 15.3 C, an annual mean accumulated temperature of 2,559.6 C for days with a temperature ≥10 C, a frost-free period of 229 d, and an annual sunshine duration of 2,104 h (Zheng et al. Reference Zheng, Lv, Song, Li, Zhang, Bai and Zhang2018). The soil is silty saline with a pH of 8.7, total K of 10.2 g kg−1, total P of 0.6 g kg−1, total N of 1.0 g kg−1, and total organic matter (OM) of 10 g kg−1 (1%) at a depth of 20 cm.
Before initiating this study, a rotation system with corn (early spring) and cauliflower (Brassica oleracea L. var. botrytis L.) (autumn) was practiced, and the field was plowed to a depth of approximately 20 cm, disked, and harrowed. Major weeds during the corn-growing season were large crabgrass [Digitaria sanguinalis (L.) Scop.], barnyardgrass [Echinochloa crus-galli (L.) Beauv.], green foxtail [Setaria viridis (L.) P. Beauv.], goosegrass [Eleusine indica (L.) Gaertn.], figleaf goosefoot (Chenopodium ficifolium Sm.), and purple amaranth (Amaranthus blitum L.). Topramezone (Arietta®, 300 g ai L−1, BASF SE, Shanghai, China) was applied at the 3- to 5-leaf stage of corn to control the weeds.
Experimental Design
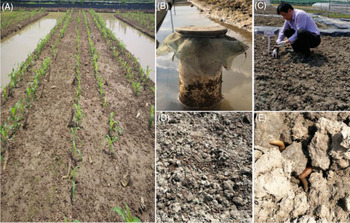
In the spring of 2010, eight field plots (6 m by 50 m) were established in a randomized block design with four replicate blocks (Figure 1). Each block contained two plots, one for CE farming (treatment) and the other for corn monoculture farming (CM, control). In 2010, earthworms (1.5 ± 0.03 g per individual) were introduced into plots at a density of 100 individuals m−2 in the CE treatment (Figure 2C). In the CM treatment, no earthworms were introduced. The initial earthworm density in the soil of the experimental site was 5 individuals m−2. The introduced earthworms were placed directly on the soil surface before planting corn, which allowed them to crawl into the soil by themselves (Figure 2D and E). The earthworms were purchased from Shanghai Yingxi Fruit and Vegetable Professional Cooperative.
A sketch of the experimental design. (A) Overview of experimental treatments that consisted of eight plots surrounded by water ditches, with four plots for corn–earthworm coculture (CE) farming and four plots for corn monoculture (CM) farming; (B) The profile of CE plots. Juvenile earthworms were introduced at a density of 100 individuals m−2. (1) Ditch (0.6-m upper opening width and 0.6-m depth); (2) experimental plot (6 m by 50 m); (3 and 4) Corn plants (planted with 75-cm row spacing); (5) individual earthworm; and (6) water surface (15 to 25 cm lower than the soil surface).

Field photos of the experiment. (A) The corn–earthworm coculture plot; (B) drainage pipe installed in ditch; (C) earthworms were introduced into a plot; (D) earthworms were placed on the soil surface; and (E) earthworms crawled into the soil by themselves.

To prevent earthworms from crawling among the plots, ditches were dug around each plot (Figure 2A), and then filled with irrigation water. Each ditch was 60 cm in depth, with an upper opening of 60 cm in width and two sloping sides (with an inclination of 60° relative to the ground). Drainage pipes were laid in the ditches to prevent waterlogging in plots. The top of the drainage pipe is 15 to 25 cm lower than the soil surface (Figure 2B). Corn seeds (‘Huyunuo 3’) were sown in late April each year with 75-cm spacing. Mechanical weeding using a disk harrow was conducted before sowing the seeds. All plots received the same amount of fertilizers: 18,000 kg ha−1 of commercial organic fertilizer (consisting of 413.4 g kg−1 OM, 17.1 g kg−1 nitrogen, 12.4 g kg−1 phosphorous pentoxide, and 12.3 g kg−1 potassium oxide) was used as the base fertilizer, and 375 kg ha−1 of compound fertilizer (consisting of 15% nitrogen, 15% phosphorus, and 15% potassium; 90% as base fertilizer and 10% as topdressing material) was evenly sprayed onto the plots’ surface. Chlorantraniliprole (Kangkuan, 200 g ai L−1, DuPont, Shanghai, China), recommended by the Shanghai Agricultural Technology Extension and Service Center, was applied to control pests in all plots. No fungicides or herbicides were used in any of the field plots during the experiment. After sampling each year, mechanical weeding using a disk harrow was performed to manage the weeds.
In early April of each year, the number of earthworms in each plot was assessed by hand sorting of soil blocks (30 cm by 30 cm by 30 cm depth) (Bohlen et al. Reference Bohlen, Parmelee, Blair, Edwards and Stinner1995; Schmidt Reference Schmidt2001), with 10 soil blocks sampled in each plot. The initial density of earthworms was maintained for each plot by adjusting the earthworm number (removing or adding earthworm individuals according to the density of the focal plot).
Weed Sampling
Weed samples were collected in late May during 2015 to 2019 (Table 1). Weeds were in the vegetative growth stage at the time of sampling. Ten 1-m2 samples were randomly taken from each plot per year. The sampling quadrats were located along an “M” shape itinerary (Thomas Reference Thomas1985). Quadrats were at least 1 m away from the plot borders and were placed at intervals of 4 m. All weed individuals in each quadrat were cut at the soil surface and taken to the laboratory for sorting and counting. Weeds were identified to the species level using the reference book Flora of China (Shanghai Academy of Sciences 1999). The species number, density, and biomass (oven-dried at 70 C for 72 h) of the weeds were recorded.
Hybrid variety of corn and planting and sampling dates in the experiment.

a ‘Huyunuo 3’, a hybrid variety, was bred by Shanghai Academy of Agricultural Sciences. Its average plant height, growth period, and yield are about 210 cm, 90 d, and 11,250 kg ha−1, respectively.
Data Analysis
The normal distribution and homoscedasticity of all data were checked by the Kolmogorov-Smirnov test and Levene’s test, respectively. Based on the individual weeds, three diversity indices—Pielou’s evenness index, Shannon diversity index, and Simpson’s dominance index—were calculated for each plot to reveal the changes in species composition and the diversity of the weed communities from 2015 to 2019. These indices were calculated as follows. Simpson’s dominance index (Simpson Reference Simpson1949):
 $$D = 1 - \sum\limits_{i = 1}^s {{{({n_i}/N)}^2}} $$
Shannon diversity index (Shannon and Weaver Reference Shannon and Weaver1949):
 $$H' = - \sum\limits_{i = 1}^s {({n_i}/N)/{\rm{In}}({n_i}/N)} $$
and Pielou’s evenness index (Pielou Reference Pielou1967):
 $$E = {{H'} \over {{\rm{In}}\,S}}$$
where S is the total number of species, N is the total number of individuals of all the species, and n i is the number of individuals of the ith species.
A two-way ANOVA with a general linear model was performed to reveal the interactive effects of culture years and farming types (CE and CM) on species number, density, biomass, and the three diversity indices of the weed communities. The data were presented as the mean ± SE. All statistical analyses were performed using SPSS v. 20 software (SPSS, Chicago, IL, USA). The significance level concerning the difference of relevant indices between CE and CM was set at P < 0.05.
Results and Discussion
This is one of the few studies quantifying the effects of earthworm activities on weed occurrence in crop fields (Smith et al. Reference Smith, Gross and Januchowski2005; Stinner et al. Reference Stinner, Mccartney, Blair, Parmelee and Allen1997; Zarea et al. Reference Zarea, Ghalavand, Goltapeh and Rejali2010). CE significantly reduced weed species richness and diversity and weed density and biomass, thus suppressing weed occurrence in corn.
General Aspects
A total of 11 weed species, including D. sanguinalis, C. ficifolium, S. viridis, E. indica, E. crus-galli, A. blitum, common purslane (Portulaca oleracea L.), eclipta [Eclipta prostrata (L.) L.], horseweed [Conyza canadensis (L.) Cronquist], black nightshade (Solanum nigrum L.), and Asian copperleaf (Acalypha australis L.), were recorded in CM plots during the study period. Among them, C. canadensis and S. nigrum were found only in CM but not in CE. Digitaria sanguinalis, S. viridis, E. indica, C. ficifolium, and A. blitum were the dominant species in CM, while C. ficifolium and A. blitum were the dominant species in the CE plots.
CE farming significantly reduced the number of weed species compared with CM. The 5-yr mean number of weed species per plot was 8.4 ± 0.2 in CE and 10.7 ± 0.2 in CM. The two-way ANOVA showed that the number of weed species in CE was significantly lower than in CM. There existed a marginally significant control effect of study duration on weed richness, but no significant interaction of the study year by farming type on weed species number was detected (Table 2; Figure 3A).
Summary of the ANOVA testing the effects of culture years and farming types (corn monoculture farming and corn–earthworm coculture farming) on the indicators.

Comparisons of weed species number, density, and biomass between corn–earthworm coculture (CE) plots and corn monoculture (CM) plots during 2015 to 2019. Vertical bars denote SEs. (A) Weed species number; (B) total weed density; and (C) total weed biomass.

Total Weed Density and Biomass
CE farming significantly reduced total weed density and biomass compared with CM. The 5-yr mean density and biomass of total weeds in CE decreased by 59.2% and 66.6%, respectively. The two-way ANOVA showed that total weed density and biomass in CE were both significantly lower than in CM (Table 2). Additionally, coculture year and the interaction of year by farming type also significantly influenced the total weed density and biomass (Table 2; Figure 3B and C). Therefore, the 5-yr successive CE practice exerted a significant control effect on weeds. Figure 3C also shows that the total weed biomass in CE continuously decreased with coculture years. Werth et al. (Reference Werth, Keenan, Thornby, Bell and Walker2017) reported that rainfall has a significant effect on weed emergence; with an increase in rainfall, the emergence of weeds increases. The accumulated rainfall during the period from corn planting to weed sampling for 2015, 2016, 2017, 2018, and 2019 was 68, 74, 105, 96, and 154 mm, respectively, with the highest rainfall in 2019. This may be the reason for the relatively high total weed density and biomass in 2019.
Even though earthworms rarely eat weed seedlings, they are important predators of weed seeds and likely use weed seeds as a high-quality food source (Eisenhauer et al. Reference Eisenhauer, Schuy, Butenschoen and Scheu2009). Previous literature shows that some seeds are digested or lose their germinability after earthworm gut passage (Decaëns et al. Reference Decaëns, Mariani, Betancourt and Jiménez2003; Grant Reference Grant1983; Piearce et al. Reference Piearce, Roggero and Tipping1994). Therefore, the control effect of CE on weeds was perhaps partially due to earthworms ingesting and digesting substantial numbers of weed seeds, reducing the number of viable weed seeds in soils under long-term CE.
Additionally, earthworms are recognized as important dispersers of seeds (Decaëns et al. Reference Decaëns, Mariani, Betancourt and Jiménez2003; Eisenhauer et al. Reference Eisenhauer, Marhan and Scheu2008; Grant Reference Grant1983; Laossi et al. Reference Laossi, Noguera and Barot2010; Milcu et al. Reference Milcu, Schumacher and Scheu2006; Regnier et al. Reference Regnier, Harrison, Liu, Schmoll, Edwards, Arancon and Holloman2008; Willems and Huijsmans Reference Willems and Huijsmans1994), and earthworm activities facilitate seed burial. For example, earthworms have been shown to bury the seeds of giant ragweed (Ambrosia trifida L.) from 0.5 to 22 cm deep (Regnier et al. Reference Regnier, Harrison, Liu, Schmoll, Edwards, Arancon and Holloman2008). Translocation of seeds into deeper soil layers by earthworms plays an important role in vertical seed movement (Laossi et al. Reference Laossi, Noguera and Barot2010). When seeds are buried below emergence depth limits, they may fail to form seedlings. Moreover, biological tillage is implicated in weed suppression (Teasdale et al. Reference Teasdale, Beste and Potts1991). The mixing of soil layers (bioturbation) by earthworms is considered high-intensity biological tillage and significantly impacts seedbank dynamics and seedling establishment (Eisenhauer et al. Reference Eisenhauer, Schuy, Butenschoen and Scheu2009). The suppression of weeds in the present study may also be due to the mixing of soil layers by earthworms.
Influence of CE on the Diversity, Dominance, and Evenness Indices of Weeds
CE farming significantly reduced the Shannon diversity index and Simpson’s dominance index, but increased Pielou’s evenness index of weed species compared with CM (Figure 4). The two-way ANOVA showed that farming type and study year both exerted significant effects on the three indices (Table 2). A significant interaction between study year and farming type was detected for Pielou’s evenness index but not for the other two indices (Table 2). CE not only significantly reduced weed abundance but also reduced the dominance of major weeds and increased the evenness of weed occurrence, which is helpful for weed management and crop production (Travlos et al. Reference Travlos, Cheimona, Roussis and Bilalis2018).
Comparisons of the diversity index, evenness index, and dominance index of weed communities between corn–earthworm coculture (CE) plots and corn monoculture (CM) plots during 2015 to 2019. Vertical bars denote SEs. (A) Shannon diversity index; (B) Pielou’s evenness index; and (C) Simpson’s dominance index.

Control Effect of CE on the Occurrence of Different Weed Species
The control effect of CE on weed occurrence varied among weed species. CE farming significantly reduced the density and biomass of D. sanguinalis, S. viridis, E. indica, and P. oleracea compared with CM, but it did not affect the occurrence of E. crus-galli, C. ficifolium, A. blitum, and E. prostrata (Table 2; Figure 5). The 5-yr mean density of D. sanguinalis, S. viridis, E. indica, and P. oleracea in CE decreased by 94.5%, 78.1%, 75.0%, and 45.8%, and their biomass decreased by 96.2%, 80.8%, 76.9%, and 41.4%, respectively (Figure 5). Additionally, study year and the interaction between study year and farming type also had a significant effect on weed density and biomass for all the noted species, except P. oleracea (Table 2). Earthworms selectively feed on seeds depending on seed size and shape, surface structure, and feeding habits (Eisenhauer et al. Reference Eisenhauer, Schuy, Butenschoen and Scheu2009; Piearce et al. Reference Piearce, Roggero and Tipping1994; Shumway and Koide Reference Shumway and Koide1994). Our studies showed that the effect of CE on weed occurrence was species specific, which is consistent with the previous findings of selective seed ingestion and digestion by earthworms.
Comparisons of density and biomass between corn–earthworm coculture (CE) plots and corn monoculture (CM) plots for Digitaria sanguinalis (A and B), Setaria viridis (C and D), Eleusine indica (E and F), and Portulaca oleracea (G and H) during 2015 to 2019. Vertical bars denote SEs.

Previous studies have indicated that earthworm activities can improve soil physical and biological characteristics (Milleret et al. Reference Milleret, Le Bayon, Lamy, Gobat and Boivin2009), enhance the availability of nutrients (Dobson et al. Reference Dobson, Blossey and Richardson2017; Edwards and Bohlen Reference Edwards and Bohlen1996; García-Pérez et al. Reference García-Pérez, Alarcón-Gutiérrez, Perroni and Barois2014; Li et al. Reference Li, Wang, Lu, Zhang, Chen, Li and Cao2019; Scheu Reference Scheu2003; Subler et al. Reference Subler, Baranski and Edwards1997), improve crop yield and quality (Nurhidayati et al. Reference Nurhidayati, Ali and Murwani2016; Scheu Reference Scheu2003; Zarea et al. Reference Zarea, Ghalavand, Goltapeh and Rejali2010), and decompose crop wastes (Bertrand et al. Reference Bertrand, Barot, Blouin, Whalen, de Oliveira and Roger-Estrade2015; Waqar et al. Reference Waqar, Shah, Bakhat, Shahid, Aslam, Ashraf, Hafeez, Murtaza and Rashid2019). However, reports on the effects of earthworm activities on weed occurrence in crops are lacking. CE farming is an ecological agricultural practice based on the principle of mutually beneficial symbiosis. On the one hand, earthworms benefit corn by improving the soil, increasing soil fertility, and suppressing weeds. On the other hand, corn benefits earthworms by providing a suitable habitat and food source in the form of stalk waste. Additionally, P. guillelmi is an important medicinal material with thrombolytic and anticoagulant effects (Commission of the PPRC 2010). Its market price could reach as high as US$3.5 to US$6.5 kg−1 (Zheng et al. Reference Zheng, Lv, Song, Li, Zhang, Bai and Zhang2018). CE farming can not only increase corn yields by improving soil environments and suppressing weed occurrence, but can also produce 2,250 kg ha−1 earthworms each year, thus resulting in a high income for growers. Subsequent reduction of herbicide inputs in CE systems could also improve environmental quality in agricultural landscapes.
Although the practice of CE farming has been applied in Shanghai urban agriculture for more than 10 yr, its role in weed management has not received much attention. Our study suggests that long-term CE farming suppresses weed occurrence. Regardless of their economic value, earthworms function as ecosystem engineers (Jones et al. Reference Jones, Lawton and Shachak1994) and have important ecological values in agricultural systems. Our study suggests that the practice of augmenting soil with earthworms can contribute to integrated weed management in agriculture. Moreover, weed seed predation by earthworms may be a method to manage some herbicide-resistant weeds by managing the weed seedbank (Chauhan and Johnson Reference Chauhan and Johnson2010). The suppression of weed occurrence by earthworm activities depends on a high individual density of earthworms. Therefore, the application of CE in controlling weed occurrence and subsequent reduction of herbicide inputs is only recommended where earthworms can be harvested as a co-product. Future research should focus on the effects of long-term CE farming on the composition and dynamics of soil weed seedbanks to clarify the mechanism behind CE farming suppressing weeds. Additionally, the specific effects (e.g., seed ingestion, digestion, and seed germination after earthworm gut passage) of earthworms on the seeds of major weed species in cornfields must also be explored.
Acknowledgments
This work was supported by the SAAS Program for Excellent Research Team [2017 (A-03)], the Shanghai Agriculture Applied Technology Development Program, China (grant no. T20180414), the China National Major Program of Science and Technology (grant no. 2017ZX07202004-004), and the CIMMYT–China Specialty Maize Research Center, Agriculture Research System of Shanghai, China (grant no. 201710). Thanks are also due to Xianqing Zheng and Xiaobin Tao for their assistance in conducting this research. No conflicts of interest have been declared.