





Impact statement
Our understanding of mass extinctions in Earth’s history has largely been dependent on large global databases of fossils. These large data compilations enable the identification, quantification and duration of mass extinction events. These same databases, however, fail to adequately capture the structure of the stratigraphic record, thereby providing limited information on how fossil communities are distributed through time and space. Understanding the true nature of mass extinctions requires a consideration of the stratigraphic record to assess whether perceived changes in diversity and taxonomic composition that define mass extinction events result from true extinction, including local extirpation or apparent extinction driven by facies changes, especially during times of major environmental change. Taking this approach, we test for evidence of a mass extinction event during the mid-Carboniferous period at the global type locality for the mid-Carboniferous boundary at Arrow Canyon in southern Nevada, US. Focusing on brachiopods, we observe an apparent extinction of up to 39% of genera between the Serpukhovian (Uppermost Mississippian) and Bashkirian (lowermost Pennsylvanian), consistent with an estimated global extinction magnitude of 26–28% for marine animal genera during this interval. This apparent extinction at Arrow Canyon occurs below the time boundary, at the contact between two geologic units that differ largely in their terrigenous silt content. Assessing the global stratigraphic ranges of these brachiopod genera, we find that all but two extend into the Bashkirian globally, suggesting that they tracked their preferred environment elsewhere. These results indicate no evidence of a Serpukhovian mass extinction event in Arrow Canyon, consistent with other North American studies. This study demonstrates the importance of untangling biotic patterns from stratigraphic ones to accurately interpret mass extinction events in the fossil record.
Introduction
Clusters of fossil last occurrences are used to delineate the placement and timing of extinction horizons at the outcrop scale. Complicating this approach is the effect of incomplete sampling, which can create the appearance of gradual extinction during an abrupt extinction event, known as the Signor-Lipps effect (Signor and Lipps, Reference Signor, Lipps, Silver and Schultz1982), and the structure of the stratigraphic record, which controls where clusters of last occurrences are found (Holland, Reference Holland1995). These complications can significantly influence how extinction horizons are interpreted from field observations (Holland and Patzkowsky, Reference Holland and Patzkowsky2015; Zimmt et al., Reference Zimmt, Holland, Finnegan and Marshall2021), and ultimately from large fossil databases. It is not surprising, then, that major extinction horizons have been identified during times of fluctuating eustatic sea level, resulting in a stratigraphic record marked by abrupt facies changes that affect both where fossils are sampled and where clusters of last occurrences are found (Holland and Patzkowsky, Reference Holland and Patzkowsky2015). Accurately defining and constraining extinction horizons in the field requires stratigraphic assessment to determine how the structure of the stratigraphic record influences the interpretation of biotic signals (Patzkowsky and Holland, Reference Patzkowsky and Holland2012), including instances in which a single process both shaped the record and drove extinction (Peters, Reference Peters2005).
The Serpukhovian (Upper Mississippian, Carboniferous) mass extinction is a lesser-known event attributed in part to fluctuations in eustatic sea levels, and limited understanding of this event is likely influenced by interpretations of the stratigraphic record. The Serpukhovian mass extinction event is estimated as the sixth-largest of the Phanerozoic (McGhee et al., Reference McGhee, Clapham, Sheehan, Bottjer and Droser2013), with 26–28% genus extinction (Sepkoski, Reference Sepkoski, Raup and Jablonski1986, Reference Sepkoski and Wallister1996), and the fifth-largest in terms of ecological severity, leading to major turnover among crinoids and rugose corals (McGhee et al., Reference McGhee, Sheehan, Bottjer and Droser2012) and selective extinction against larger-bodied brachiopods (Powell, Reference Powell2008). This extinction event coincides with the onset of the Late Paleozoic Ice Age (LPIA), which is characterized by high-frequency, high-amplitude glacioeustasy that began as early as the uppermost Visean and persisted through the Serpukhovian (Fielding et al., Reference Fielding, Frank, Isbell, Fielding, Frank and Isbell2008; Rygel et al., Reference Rygel, Fielding, Frank and Birgenheier2008; Montañez and Poulsen, Reference Montañez and Poulsen2013). Whereas this extinction event has generally received less attention, it is considered important in shaping macroevolutionary patterns during the late Paleozoic, from major turnover of ecologically important groups, such as crinoids and rugose corals, to the start of a sluggish macroevolutionary regime with depressed extinction and origination rates (Stanley and Powell, Reference Stanley and Powell2003; Powell, Reference Powell2005; Bambach, Reference Bambach2006; Stanley, Reference Stanley2007; McGhee et al., Reference McGhee, Clapham, Sheehan, Bottjer and Droser2013).
Several field-based studies that incorporate stratigraphic analyses from the midcontinent of the US indicate that this extinction event may be far less severe than it appears from global data compilations. Studies from the Illinois Basin demonstrate that true extinction is muted across the onset of the LPIA, with apparent turnover and decrease in richness attributed to a change in the geometry of the carbonate ramp (Bonelli and Patzkowsky, Reference Bonelli and Patzkowsky2008). This change in ramp geometry weakened the environmental gradient, leading to an increase in eurytopic and migrant taxa, with stenotopic taxa tracking their preferred habitats elsewhere (Bonelli and Patzkowsky, Reference Bonelli and Patzkowsky2008, Reference Bonelli and Patzkowsky2011). Similarly, Heim (Reference Heim2009) compared brachiopod assemblages between the uppermost Mississippian (Serpukhovian) and the lowermost Pennsylvanian (Bashkirian) in the Ozark Highlands of Arkansas and Oklahoma, US, using a combination of additive diversity partitioning and multivariate methods. Results indicate that diversity remained stable across the mid-Carboniferous boundary but was characterized by high taxonomic turnover, with an apparent 63% loss of Mississippian taxa and a 50% increase in Pennsylvanian taxa (Heim, Reference Heim2009). Global stratigraphic ranges of sampled taxa, however, reveal that most taxa persisted across the mid-Carboniferous boundary but were extirpated from the region, with new apparent originators migrating in, thereby sustaining the brachiopod diversity structure (Heim, Reference Heim2009).
Here, we further assess the nature of the Serpukhovian mass extinction event by documenting brachiopod assemblages across the mid-Carboniferous boundary at the Global Boundary Stratotype Section and Point (GSSP) for the base of the Bashkirian Stage at Arrow Canyon in southern Nevada, US (Lane et al., Reference Lane, Brenckle, Baesemann and Richards1999). Assessing a single stratigraphic section, we test for evidence of a mass extinction of brachiopods across the Serpukhovian–Bashkirian boundary at Arrow Canyon using multivariate approaches within a well-defined facies framework.
Arrow Canyon is located in the northern portion of the Arrow Canyon Range, approximately 75 km northeast of Las Vegas in southern Nevada (Figure 1A). The well-exposed, Devonian–Permian section at Arrow Canyon (~1.5 km thick) consists primarily of tropical carbonate successions deposited near the paleoequator (Langenheim et al., Reference Langenheim, Carss, Kennerly, McCutcheon and Waines1962; Langenheim and Langenheim, Reference Langenheim and Langenheim1965; Lane et al., Reference Lane, Brenckle, Baesemann and Richards1999; Richards et al., Reference Richards, Lane, Brenckle, Hills, Henderson and Bamber2002; Bishop et al., Reference Bishop, Montanez, Gulbranson and Brenckle2009, Reference Bishop, Montanez and Osleger2010). Deposition occurred in the epeiric sea that filled the remnants of the Antler Orogeny retroarc foreland basin, which stretched across most of the western interior of the North American craton during the Carboniferous (Poole and Sandberg, Reference Poole, Sandberg, Cooper and Stevens1991; Ross, Reference Ross, Cooper and Stevens1991). The Carboniferous succession at Arrow Canyon consists of the Monte Cristo Group, Battleship Wash Formation, Indian Springs Formation and Bird Spring Formation.
Geographic location and geologic context of Arrow Canyon. (A) Location of Arrow Canyon in southern Nevada, with the inset showing the topographic map of Arrow Canyon that includes the location of the global boundary stratotype section and point (GSSP) for the base of the Bashkirian stage (Brand and Brenckle, Reference Brand and Brenckle2001). The contour intervals on the topographic map are in feet. A photo of the exposed GSSP section is provided in the Supplementary Materials (Supplementary Figure S1. (B) Chronostratigraphic chart of the mid-Carboniferous section at Arrow Canyon (Bishop et al., Reference Bishop, Montanez and Osleger2010). Abbreviations for chronostratigraphic chart: N.A. Stage – North American regional stage; Faunal Zone – S-M Sinuatus-Minutus. (C) Facies model of the study interval at Arrow Canyon. The numbers below each depositional environment represent the total number of culled samples from each facies for each geologic stage included in this study, with the numbers in parentheses indicating the total number of samples. SL: sea level; FWWB: fair-weather wave base; SWWB: storm-weather wave base; Bash.: Bashkirian; Serp.: Serpukhovian.

Figure 1. Long description
Panel A: A map of the United States highlights Nevada. An inset shows a topographic map of Arrow Canyon with contour lines in feet. A G S S P marker is located at approximately North 36 degrees 44 minutes and West 114 degrees 46 minutes. A scale bar indicates 1 kilometer.
Panel B: A vertical chronostratigraphic chart. The Subsystem column shows Mississippian at the bottom and Pennsylvanian at the top. The Global Stage column transitions from Visean to Serpukhovian to Bashkirian. The N. A. Stage column lists Meramecian, Chesterian, and Morrowan. The Faunal Zone includes S-M Sinuatus-Minutus. The Formation column identifies Battleship Wash Fm. at the base, followed by Indian Springs Fm., and Bird Spring Fm. at the top. A bracket indicates the study interval spans from the upper Indian Springs Fm. through the lower Bird Spring Fm.
Panel C: A facies model cross-section. From left (proximal) to right (distal), the environments are: Peritidal (orange), Restricted Shallow Subtidal or Lagoon (light teal), Shoal (light blue), Shallow Subtidal (medium blue), Deep Subtidal (dark blue), and Offshore (gray). Horizontal lines mark S L (sea level), F W W B (fair-weather wave base), and S W W B (storm-weather wave base). Below the model, sample counts are listed for Bash. and Serp. stages. For Bash.: 0, 1(2), 0, 9, 4, 0. For Serp.: 0, 0, 0, 10, 2, 2(3).
This study focuses on the Indian Springs and Bird Spring Formations (Figure 1B). The Indian Springs Formation is Serpukhovian (Uppermost Mississippian) and 65 m thick, consisting primarily of siliciclastic sediments characterized by thin (~10 m) shallow-subtidal sequences. Using grain size, sedimentary structures, bed thickness and the degree of bed amalgamation, these sequences are interpreted as thin intervals of offshore shales and mudstones, deep-subtidal siltstones interbedded with thin beds of packstones and coarsening upward into shallow-subtidal medium-to-thick amalgamated beds of skeletal grainstones capped with paleosols. Fourth-order glacioeustatic change drove the sedimentological changes throughout the entire Indian Springs Formation and signifies the early stages of the LPIA at Arrow Canyon (Bishop et al., Reference Bishop, Montanez, Gulbranson and Brenckle2009). The Bird Spring Formation conformably overlies the Indian Springs Formation, is more than 1,000 m thick, and spans the Uppermost Mississippian (uppermost Serpukhovian) to the lower Permian (Asselian; Bishop et al., Reference Bishop, Montanez and Osleger2010). The Bird Spring Formation consists mostly of fossiliferous, shallow-subtidal parasequences and sequences that are thicker than those in the Indian Springs Formation (upwards of 50 m). Sequences consist mostly of offshore marls, deep-subtidal marls interbedded with thin-bedded skeletal packstones, shallow-subtidal medium- to thick-bedded skeletal packstones and grainstones, occasional thin-bedded restricted shallow-subtidal wackestones and packstones and thin-to medium-bedded stromatolitic and dolomitized peritidal facies alternating with sandstones, with rare paleosols capping sequences above sequence boundaries (Bishop et al., Reference Bishop, Montanez and Osleger2010). Despite the widespread occurrence of a glacioeustatic-driven unconformity at the mid-Carboniferous boundary (Saunders and Ramsbottom, Reference Saunders and Ramsbottom1986), there is no evidence to suggest that a similar unconformity exists at the boundary at Arrow Canyon (Ellwood et al., Reference Ellwood, Tomkin, Richards, Benoist and Lambert2007; Bishop et al., Reference Bishop, Montanez and Osleger2010).
Methods
To test for evidence of a mass extinction at Arrow Canyon, we focus on brachiopods from the Indian Springs Formation and the lower Bird Springs Formation, as this interval coincides with the mass extinction event and the onset of the LPIA. We focus on brachiopods because this taxonomic group is the most well-documented, abundant and well-preserved in this section, and because brachiopods made up a considerable portion of the victims of the Serpukhovian mass extinction (Raymond et al., Reference Raymond, Kelley and Lutken1990; Shen et al., Reference Shen, Zhang, Li, Mu and Xie2006). We combine our own faunal occurrence counts and facies descriptions with unpublished biostratigraphic logs of brachiopod occurrences collected from geologists from the former Amoco Production Company, who were tasked with constraining the biostratigraphy of the Indian Springs and Bird Spring Formations at Arrow Canyon. These efforts ultimately led to the ratification of Arrow Canyon as the GSSP for the Mississippian–Pennsylvanian boundary in 1996 (Lane et al., Reference Lane, Brenckle, Baesemann and Richards1999). The biostratigraphic logs, along with conodonts, were donated to the University of Iowa Paleontology Repository after the dissolution of the Amoco Production Company (Groves and Miller, Reference Groves and Miller2000). The biostratigraphic logs are recorded using two systems of measurement: meters and A-markers, which correspond to the brass markers fastened to the canyon walls at 1.5 m intervals, starting at the base of the Indian Springs Formation (i.e., Amoco marker A-0). The GSSP is located within the Bird Spring Formation on the north wall of Arrow Canyon, approximately 18.8 m above the contact with the Indian Springs Formation (0.90 m above marker A-55) (Lane et al., Reference Lane, Brenckle, Baesemann and Richards1999; Richards et al., Reference Richards, Lane, Brenckle, Hills, Henderson and Bamber2002).
Brachiopod occurrence data were both collected in the field and extracted from the unpublished biostratigraphic log data from 30 stratigraphic horizons starting at the base of the Indian Springs Formation (A-0) and spanning to the lower Bashkirian interval of the Bird Spring Formation (A-91), covering approximately 137 m of stratigraphic section (Figure 1B). The number of sampled stratigraphic horizons per time bin is equal, with 15 stratigraphic horizons each from the Serpukhovian and Bashkirian. Whereas abundance data are available for several stratigraphic intervals, they are missing for others. Therefore, this study uses only occurrence data. We created a simple facies model and tabulated the number of fossiliferous horizons by facies (Figure 1C). This approach allows us to control for the effects of water depth on the composition and distribution of fossil communities. We test for extinction at the genus level using several quantitative approaches across the Serpukhovian to lower Bashkirian. Because multiple stacked sequences with varying facies occur, measuring taxonomic richness across the boundary alone will not yield meaningful results for determining the nature of extinction. We couple facies and occurrence data with multivariate approaches to compare assemblage composition within facies contexts and assess potential turnover. If extinction occurred, we need to assess whether it is due to true extinction or to taxa tracking their preferred depth habitats (Patzkowsky and Holland, Reference Patzkowsky and Holland2012).
Prior to statistical analysis, brachiopod taxonomy was cross-referenced with several sources, including the Paleobiology Database (PBDB; www.paleodb.org) and Sepkoski’s compendium (Sepkoski, Reference Sepkoski2002), using the R package fossilbrush (Flannery-Sutherland et al., Reference Flannery-Sutherland, Raja, Kocsis and Kiessling2022) to identify and correct spelling errors, update accepted genus names and stratigraphic ranges. After vetting the taxonomy, the occurrence data were culled to remove singleton genera (genera with a single occurrence across all 30 horizons) and stratigraphic horizons with only a single occurrence. No additional sample size adjustments were needed.
To test for extinction, we compare the taxonomic composition of each interval by pairing clustering with ordination methods. The coupling of clustering and ordination methods has been used in the past to assess the underlying environmental gradients controlling community composition as well as turnover in the fossil record (Bonuso et al., Reference Bonuso, Newton, Brower and Ivany2002a, Reference Bonuso, Newton, Brower and Ivany2002b; Holland and Patzkowsky, Reference Holland and Patzkowsky2004; Brett et al., Reference Brett, Hendy, Bartholomew, Bonelli and McLaughlin2007; Bonelli and Patzkowsky, Reference Bonelli and Patzkowsky2008, Reference Bonelli and Patzkowsky2011; Ivany et al., Reference Ivany, Brett, Wall, Wall and Handley2009; Visaggi and Ivany, Reference Visaggi and Ivany2010; Patzkowsky and Holland, Reference Patzkowsky and Holland2012; Brown, Reference Brown2021). Moreover, cluster analysis defines groups of samples with similar taxonomic composition, while ordination shows how those clusters are arranged along an environmental axis (Shi, Reference Shi1993; Visaggi and Ivany, Reference Visaggi and Ivany2010).
Hierarchical Q-mode clustering to assess the similarity between samples based on taxonomic composition was performed on the culled occurrence dataset using the Jaccard index (Jaccard, Reference Jaccard1908, Reference Jaccard1912) and linking clusters using Ward’s method (Ward, Reference Ward1963). The vegdist() function in the vegan R package (Oksanen et al., Reference Oksanen, Kindt, Legendre, O’Hara, Simpson, Solymos, Stevens and Wagner2026) was used to create a Jaccard index matrix from the culled dataset. Hierarchical R-mode clustering to assess the co-occurrence of genera in samples was also performed on the culled occurrence dataset using the Jaccard index and Ward’s method. Both Q- and R-mode clusters were performed using the functions Scluster() and Tcluster respectively, in the R package cluster (Maechler et al., Reference Maechler, Rousseeuw, Struyf, Hubert and Hornik2026). A combined, two-way cluster analysis was also performed to map the Q-mode and R-mode clusters together. The two-way cluster was created using the R package, pheatmap (Kolde, Reference Kolde2025), which is designed to display abundance data as a heatmap between the Q- and R-mode clusters, but is used here to map occurrence data instead (Figure 2).
Two-way cluster analysis of culled brachiopod occurrences. Gray squares indicate the occurrences of brachiopod genera. The Q-mode cluster is color-coded by facies, and the A-markers are color-coded by geologic age. Samples with a single occurrence and singleton genera were removed prior to analysis.

Figure 2 Long description
Stratigraphic heatmap and hierarchical dendrogram using Jaccard-index similarity to group genera across and stratigraphic horizon and by genus occurrence. Gray cells mark genus occurrences, blue facies bars, orange and blue stage labels, dashed boundary, and regions labeled terrigenous siliciclastic-rich and higher carbonate sediment content.
Non-metric multidimensional scaling (NMDS) was performed on the culled occurrence data to compare taxonomic composition within horizons and between time periods. This approach is used to identify any major turnover across the Serpukhovian–Bashkirian boundary that could constitute a mass extinction. Moreover, NMDS is used to identify underlying environmental gradients that can explain the distribution of brachiopod assemblages across this interval. NMDS was performed in R using the vegan package (Oksanen et al., Reference Oksanen, Kindt, Legendre, O’Hara, Simpson, Solymos, Stevens and Wagner2026) on the same Jaccard index matrix used for clustering. The function metaMDS() was run with three dimensions (k = 3) and 50 restarts (trymax = 50) to find the best solution. The stress value for this three-dimensional run is 0.12, which lies below the accepted 0.2 threshold preferred for ecological community studies (Kruskal, Reference Kruskal1964; Clarke, Reference Clarke1993). Moreover, the metaMDS() function is used because it PCA to rotate the NMDS scores so that the first NMDS axis captures the greatest source of variance (Oksanen et al., Reference Oksanen, Kindt, Legendre, O’Hara, Simpson, Solymos, Stevens and Wagner2026). Finally, because NMDS is a graphical approach for mapping the multivariate structure of our dataset and does not test the null hypothesis that the taxonomic composition of horizons is the same, we use analysis of similarity (ANOSIM) on the NMDS scores, using the anosim() function in the vegan package. All quantitative and statistical analyses were performed using R version 4.5.2 (R Core Team, 2025).
Results
A total of 192 occurrences of 42 brachiopod genera spanning nine orders were identified from the 30 stratigraphic horizons: Athyridida, Craniida, Lingulida, Orthida, Orthotetida, Productida, Spiriferida, Spiriferinida and Terebratulida. Of the 42 genera, 11 occur only in the Serpukhovian, 17 occur in the Serpukhovian and extend into the Bashkirian and the remaining 14 occur only in the Bashkirian, indicating a 39% apparent extinction of brachiopod genera. Of the 30 stratigraphic samples, most come from shallow-subtidal facies (19), followed by deep-subtidal (6), offshore (3) and restricted shallow-subtidal (2; Figure 1C). After culling the dataset for multivariate analyses, 30 brachiopod genera and 179 occurrences across 28 stratigraphic horizons (14 each from the Serpukhovian and Bashkirian) remained, equating to a 24% apparent extinction of brachiopod genera. Despite the decrease in the number of genera after culling the occurrence dataset, the diversity pattern across this interval at Arrow Canyon remains largely the same, characterized by high fluctuations in richness, but overall, no net difference across the Serpukhovian–Bashkirian boundary (Supplementary Figures S2 and S3).
The two-way cluster analysis delineates two main, distinct clusters of samples, each characterized by a specific group of taxa (Figure 2). The first cluster comprises entirely Indian Spring Formation intervals and prominently includes the brachiopod genera Spirifer, Inflatia, Athyris, Diaphragmus and Marginovatia. Whereas some of these genera also occur in the second cluster, they are more common in this first cluster. The second and much larger cluster includes most of the brachiopod genera identified in this study, spans the intervals of the Indian Springs and Bird Spring Formations and encompasses both the Serpukhovian and Bashkirian, as well as various facies (Figure 2). The primary factor differentiating these clusters is lithology: the smaller cluster consists of samples richest in terrigenous silt, while the larger cluster consists of samples with a greater proportion of carbonate sediments.
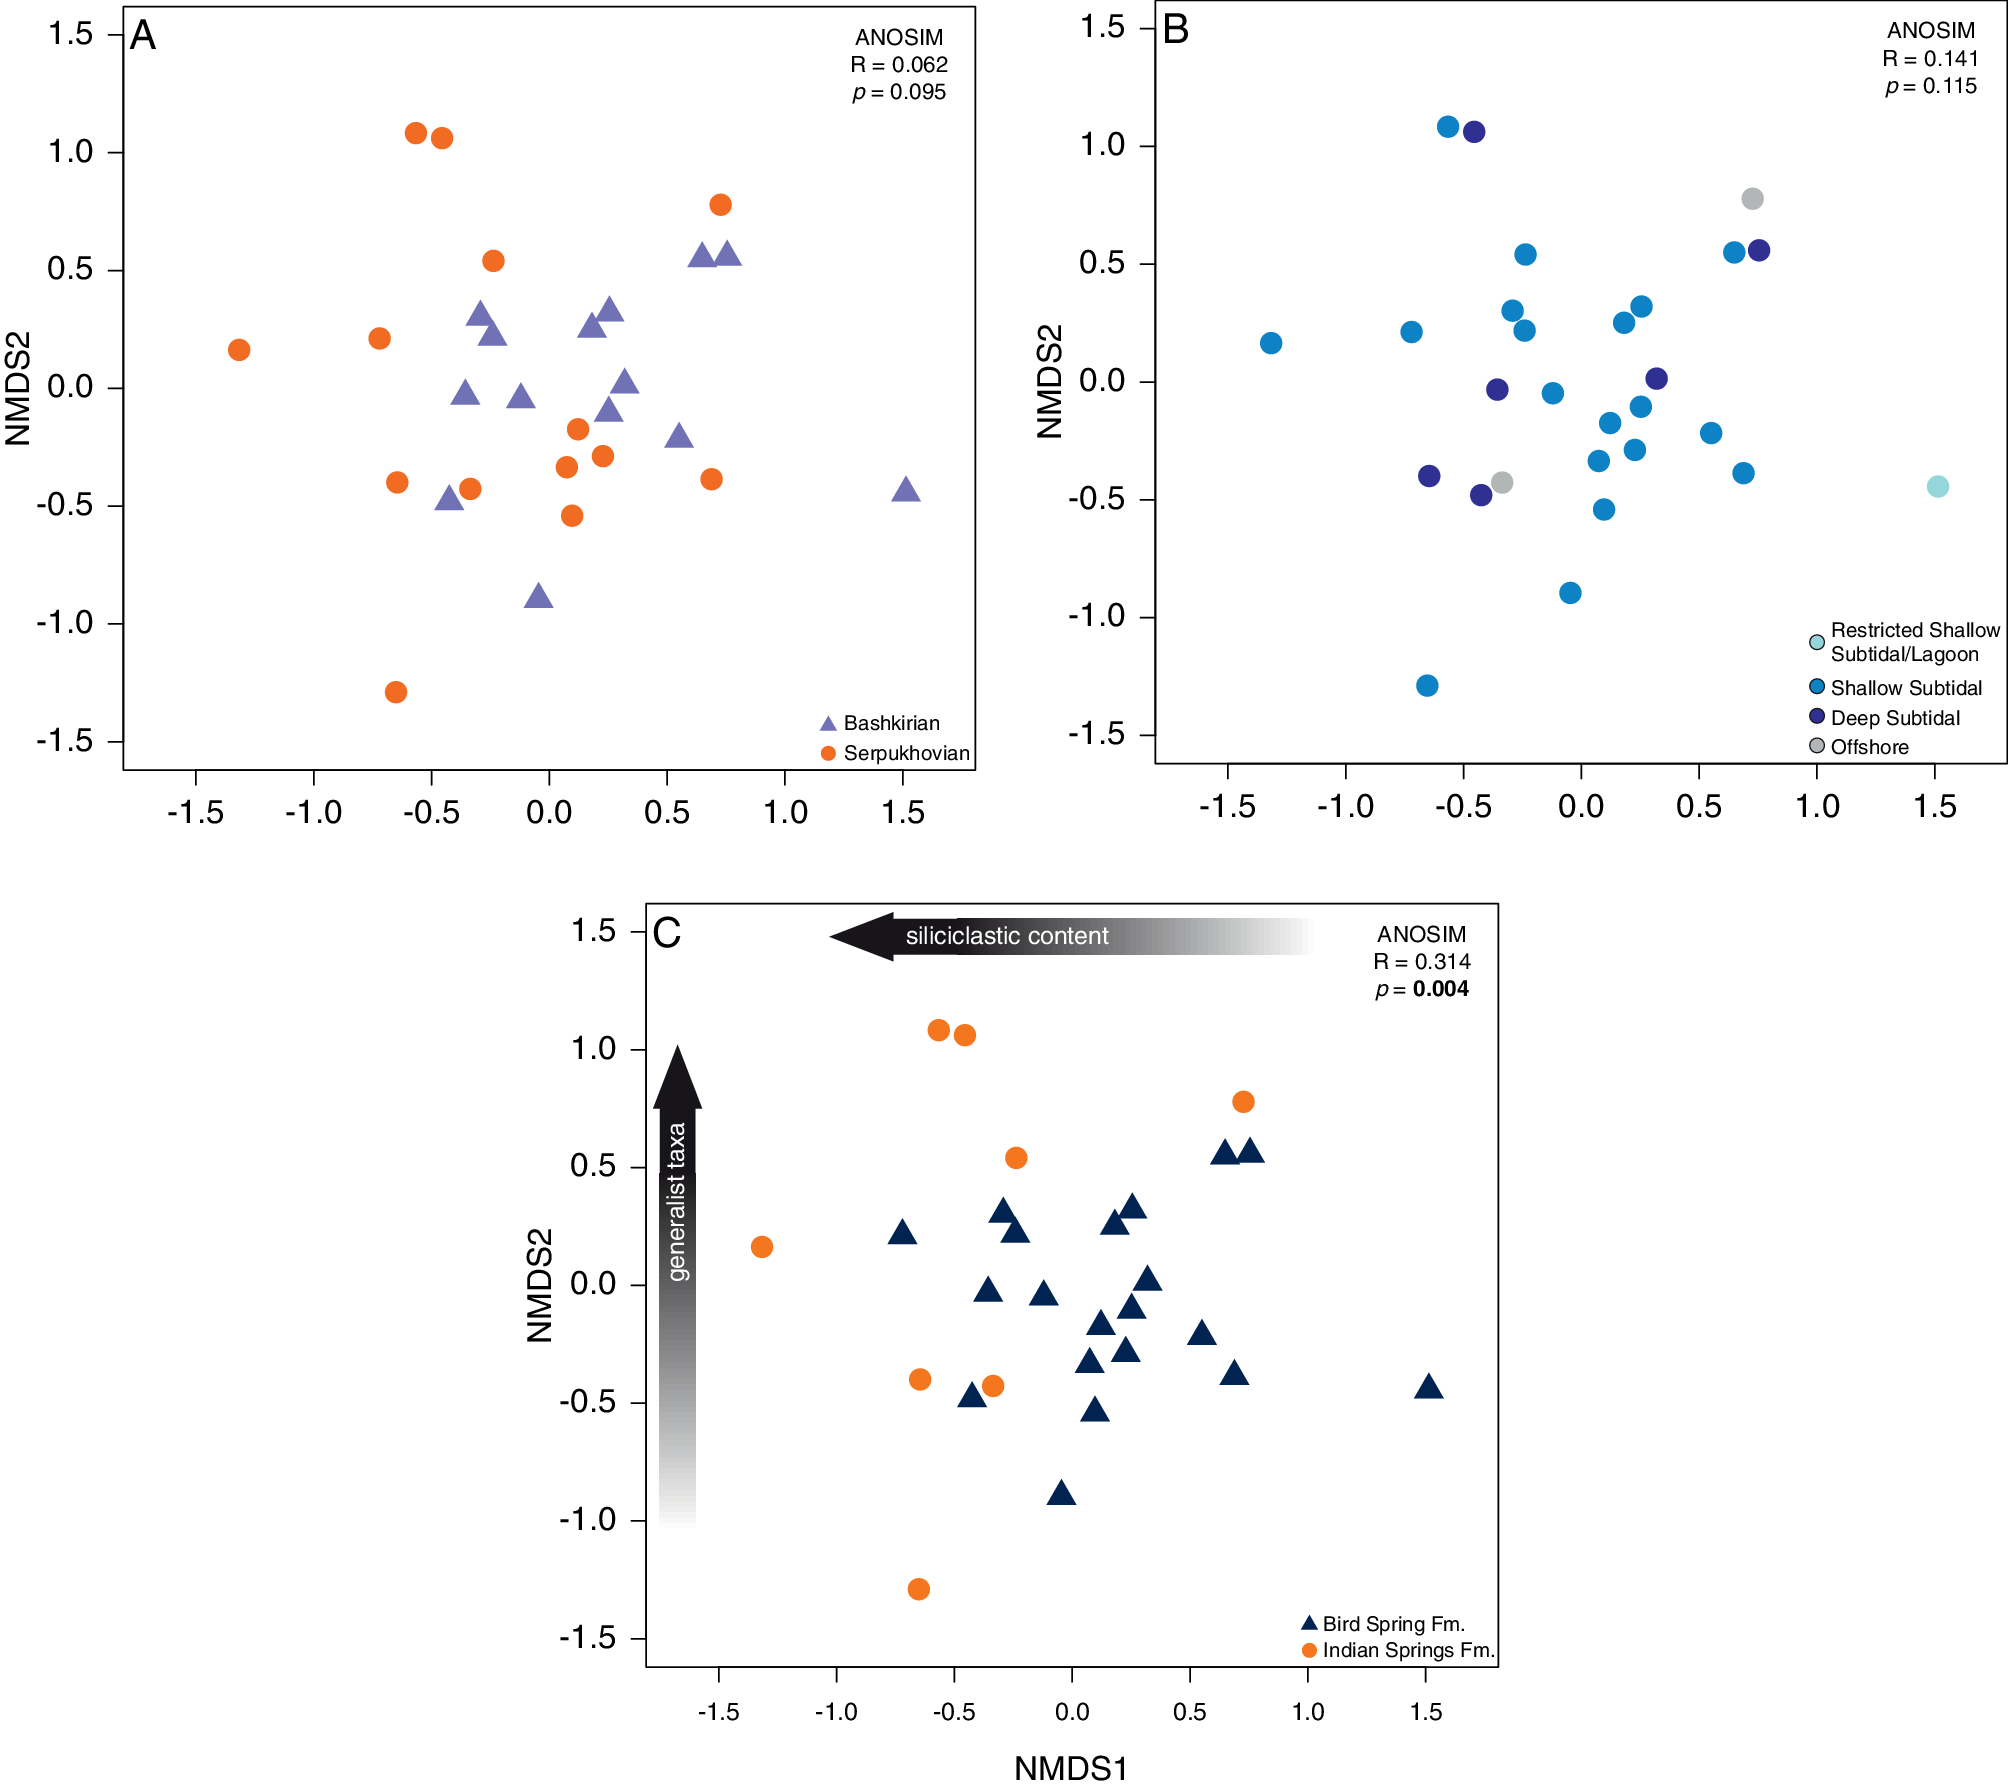
Three NMDS plots were constructed to assess sample similarity based on geologic age, facies and formation names (Figure 3). Samples that plot near each other indicate similar taxonomic composition, with greater similarity as they plot closer together. Coding samples by geologic age reveals considerable overlap of Serpukhovian and Bashkirian genera, indicating small differences among samples between ages supported by the ANOSIM test (R = 0.062, p = 0.095; Figure 3A). Given that most samples are from shallow-subtidal facies, there is also considerable overlap of samples coded by facies (R = 0.141, p = 0.115), particularly between shallow-subtidal, deep-subtidal and offshore facies, with samples from restricted shallow-subtidal plotting far from the main ordination point cloud (Figure 3B). These results indicate that water depth does not explain the main source of variation along NMDS axis 1. The third ordination plot, coded by formation, shows that the greatest separation between samples occurs between the Indian Springs and Bird Spring Formations, which is supported by the ANOSIM test (R = 0.314, p = 0.004; Figure 3C). This ordination is consistent with the two-way cluster that largely separates samples by formation, driven largely by the difference in terrigenous sediment content (Figure 4), which is apparent along NMDS axis 1.
NMDS ordination plots of Q-mode culled brachiopod occurrences coded by (A) geologic age, (B) facies and (C) geologic formation. The arrows in (C) indicate the source of and direction of variation of NMDS scores; in this case, terrigenous silt content explains the variation of samples along axis 1 and diversity of generalist taxa explains the variation along axis 2.

Figure 3. Long description
A three-panel scatter plot. All panels share an x-axis of N M D S 1 and a y-axis of N M D S 2, both ranging from negative 1.5 to 1.5.
Panel A, top-left. Statistical values are A N O S I M R equals 0.062, p equals 0.095. Data points are divided into purple triangles for Bashkirian and orange circles for Serpukhovian. The points are highly overlapping in the center of the plot.
Panel B, top-right. Statistical values are A N O S I M R equals 0.141, p equals 0.115. Data points are categorized by environment: light blue circles for Restricted Shallow Subtidal forward slash Lagoon, medium blue for Shallow Subtidal, dark blue for Deep Subtidal, and grey for Offshore. Most points cluster between negative 0.5 and 0.5 on both axes.
Panel C, bottom-center. Statistical values are A N O S I M R equals 0.314, p equals 0.004. Data points are divided into dark blue triangles for Bird Spring F m dot and orange circles for Indian Springs F m dot. A horizontal arrow at the top points left toward increasing siliciclastic content. A vertical arrow on the left points up toward increasing generalist taxa. The Bird Spring F m dot points cluster more tightly in the center-right, while Indian Springs F m dot points are more dispersed toward the left.
Examples from carbonate shallow-subtidal facies in the (A) Indian Springs Formation and (B) Bird Spring Formation. The high terrigenous silt content gives the Indian Spring Formation its red color, whereas the lack of terrigenous silt in the Bird Spring Formation gives it its blue/gray color. The lack of fine-grained siliciclastics facilitated the silicification of fossils in the Bird Spring Formation (B). The black cap of the marker is 3.81 cm long.

Results from both the raw and culled datasets suggest that the greatest apparent loss of brachiopod genera in the boundary interval occurs within the Serpukhovian, notably at the contact between the Indian Springs and Bird Spring Formations. Stratigraphic ranges of all genera indicate an apparent extinction of 39% (11 out of 28 total genera; Figure 5A) or 24% (6 out of 21 total genera) from the culled dataset (Figure 5B). Regardless of the dataset, the number of genera present in the Serpukhovian samples but absent in the Bashkirian appears to support the previously published global extinction magnitude across this interval (Sepkoski, Reference Sepkoski, Raup and Jablonski1986, Reference Sepkoski and Wallister1996; Bambach, Reference Bambach2006).
Stratigraphic ranges of mid-Carboniferous brachiopod genera sampled at Arrow Canyon. (A) Stratigraphic ranges of all genus occurrences from this study. (B) Stratigraphic ranges of culled genera from this study. (C) Global stratigraphic ranges of all genera from this study. Brachiopod occurrences at Arrow Canyon, at face value, indicate extinction percentages consistent with a mass extinction event during the Serpukhovian, whereas global stratigraphic ranges reveal true extinction for only two genera, far below previous global extinction estimates.

Figure 5. Long description
A multi-panel figure showing stratigraphic ranges of brachiopod genera.
Panel A, titled Arrow Canyon Raw Stratigraphic Ranges, plots Stratigraphic horizon (A-markers) from 0 to 100 on the y-axis against 45 genera on the x-axis. Vertical lines with dots represent the range of each genus. A red dashed line at horizon 55 marks a 39 percent apparent local extinction. To the right, a stratigraphic column shows the Indian Springs Formation in the Serpukhovian stage (orange) transitioning to the Bird Spring Formation in the Bashkirian stage (purple) at the boundary.
Panel B, titled Arrow Canyon Culled Stratigraphic Ranges, shows a subset of 32 genera. The red dashed line at horizon 55 indicates a 24 percent apparent local extinction. The distribution of vertical range lines shows more genera crossing the boundary compared to Panel A.
Panel C, titled Global Stratigraphic Ranges, plots Geologic age in M a from 450 at the bottom to 150 at the top. The x-axis lists 38 genera. A red dashed line marks the boundary where only 6 percent global extinction is observed. The right-hand column shows geological periods from bottom to top: O, S, D, C (Carboniferous), P, Tr, J, and K. Most genera show long vertical ranges extending far above and below the Carboniferous boundary, contrasting with the truncated local ranges in Panels A and B.
To assess whether the apparent extinction at Arrow Canyon is local or part of a global extinction event, we searched the genera that appear to go extinct below the Serpukhovian–Bashkirian boundary in the Amoco biostratigraphic logs higher in the section above our study interval and plotted the global stratigraphic ranges of all genera in this study using the tax_strat_range() function in the Palaeoverse R package (Jones et al., Reference Jones, Gearty, Allen, Eichenseer, Dean, Galván, Kouvari, Godoy, Nicholl, Buffan, Dillon, Flannery-Sutherland and Chiarenza2023). A search of genera that appear to go extinct below the Serpukhovian–Bashkirian boundary in the Amoco biostratigraphic logs reveals that three genera reappear much higher in the section than our study interval. The three genera (Petrocrania, Cancrinella, Orthotetes) reappear in intervals A-184, A-245 and A-245, respectively, which correspond to the upper Bashkirian (A-184) and lower Moscovian stages (A-245). The other genera that do not cross the boundary in our samples do not reappear higher in the section in the Amoco biostratigraphic logs. To plot the global stratigraphic ranges of the brachiopods in our samples, we coupled our occurrence data with occurrence data from the Paleobiology Database and Sepkoski’s compendium to determine global first and last appearances (Figure 5C). We find that of the 11 total genera from the Serpukhovian that do not cross into the Bashkirian in our samples at Arrow Canyon, only two (Protoniella and Unispirifer) went extinct globally, equating to a true genus extinction magnitude of 6%, far lower than the extinction estimate for this event. Moreover, the occurrences of Productella and Rugoclostus in our Bashkirian samples extend the global stratigraphic ranges of these two genera, further reducing the magnitude of global extinction.
Discussion
The results indicate that last occurrences in the Arrow Canyon section are controlled more by lithologic changes than by global extinction. The local extirpation of genera between the Indian Springs and Bird Spring Formations explains the difference in taxonomic composition observed in both the clustering and NMDS analyses. Naming formal geologic formation names involves a meticulous process (Murphy and Salvador, Reference Murphy and Salvador1998; Rawson et al., Reference Rawson, Allen, Brenchley, Cope, Gale, Evans, Gibbard, Gregory, Hailwood, Hesslebo, Knox, Marshall, Riley, Smith, Trewin and Zalasiewicz2002; Nomenclature, 2005). The contacts between formal stratigraphic units, however, are arbitrary and highly subjective. As such, the use of formation names to delineate biotic patterns and facies in the stratigraphic record can be uninformative and best suited for mapping units. At Arrow Canyon, however, the contact between the Indian Springs Formation and the Bird Spring Formation is delineated largely by the color of the two units, which is driven by the amount of terrigenous silt content. The Indian Springs Formation is primarily reddish in color (in both fresh and weathered surfaces), due to the high amount of terrigenous silt in marine facies and in red silts and clays from abundant paleosols (Bishop et al., Reference Bishop, Montanez, Gulbranson and Brenckle2009), whereas the Bird Spring Formation is largely blue and gray (Figure 4). The high terrigenous silt content of the Indian Springs Formation was driven by rapid changes in accommodation due to glacioeustasy at the onset of the LPIA, as decreased accommodation subaerially exposed the ramp, allowing fluvial input of terrigenous sediment into the basin (Bishop et al., Reference Bishop, Montanez, Gulbranson and Brenckle2009). As accommodation increased, terrigenous sediment input decreased, as observed in the Bird Spring Formation (Bishop et al., Reference Bishop, Montanez and Osleger2010). This lithological difference underlies the naming of the two units and helps control the taxonomic composition of brachiopod assemblages at the mid-Carboniferous boundary interval at Arrow Canyon.
The contrasting terrigenous sediment content also explains the differences in taphonomy between the two formations. Brachiopods in the Indian Springs Formation consist of original low-Mg calcite, whereas the brachiopods (as well as other fauna) in the Birds Spring Formation have largely been silicified. This is consistent with previous observations that silicification of fossil material is more common in carbonates and in lithologies lacking fine-grained siliciclastics (Butts, Reference Butts2014). Despite the major difference in preservation and silt content, there is still considerable overlap in the composition of brachiopod genera between the two formations, suggesting that these genera are generalists, capable of living in habitats with different substrates and water depths (Figure 2). As such, variation along NMDS axis 2 can be explained by the presence and diversity of different subsets of generalist brachiopod genera. Furthermore, the high number of genera present in both formations suggests minimal taphonomic bias in assessing evidence of a mass extinction among brachiopods at Arrow Canyon.
Brachiopod patterns in this study also suggest evidence of habitat tracking and migration. The genera that occur only in our Indian Springs Formation samples likely preferred firmer substrates than those that characterize the Bird Spring Formation facies. Global stratigraphic ranges suggest that all but two of these genera survived into the Bashkirian and are not seen again in our samples, possibly due to habitat tracking, as no silty carbonate substrates like those in the Indian Springs Formation are preserved. It is also just as likely that they migrated elsewhere, as there is evidence for substantial migration among brachiopods during this time (Raymond et al., Reference Raymond, Kelley and Lutken1989, Reference Raymond, Kelley and Lutken1990; Kelley et al., Reference Kelley, Raymond and Lutken1990; Kelley and Raymond, Reference Kelley and Raymond1991). Moreover, all but one brachiopod genus, which appears only in our Bashkirian samples, originated globally during this time (Figure 5C), suggesting that genera that did not occur before this interval likely migrated from elsewhere. These patterns are consistent with mid-Carboniferous studies from the US midcontinent, which suggest that habitat tracking and migration played a major role in benthic community dynamics during this time (Bonelli and Patzkowsky, Reference Bonelli and Patzkowsky2008, Reference Bonelli and Patzkowsky2011; Heim, Reference Heim2009), as well as during other intervals of global cooling (Brett and Zambito, Reference Brett and Zambito2026).
Overall, this study shows that Serpukhovian environmental change affected marine communities in North America differently than global patterns suggest (e.g., Stanley and Powell, Reference Stanley and Powell2003; Powell, Reference Powell2005). Sea-level change, specifically sea-level fall, has previously been proposed as a primary driver of mass extinctions (Hallam, Reference Hallam1989; Hallam and Wignall, Reference Hallam and Wignall1997, Reference Hallam and Wignall1999; Peters, Reference Peters2008), including the Serpukhovian mass extinction (Saunders and Ramsbottom, Reference Saunders and Ramsbottom1986). Our results are consistent with previous observations that sea-level change had a negligible effect on diversity at the onset of the LPIA (Bonelli and Patzkowsky, Reference Bonelli and Patzkowsky2011), and with modeling showing that sea-level change alters shallow-marine habitat area less than the species-area mechanism requires (Holland, Reference Holland2012). Decreased accommodation during sea-level fall reduces stratigraphic completeness and truncates taxon ranges, concentrating last occurrences at sequence boundaries and inflating apparent extinction rates (Holland, Reference Holland1995; Peters and Foote, Reference Peters and Foote2001, Reference Peters and Foote2002; Holland and Patzkowsky, Reference Holland and Patzkowsky2002, Reference Holland and Patzkowsky2015; Peters, Reference Peters2005; Zimmt et al., Reference Zimmt, Holland, Finnegan and Marshall2021). Therefore, identifying how sea-level change affects facies preservation is critical to interpreting any biotic event that coincides with eustatic change.
The Serpukhovian extinction was previously ranked as the fifth most severe ecologically, higher even than the Late Ordovician mass extinction (McGhee et al., Reference McGhee, Sheehan, Bottjer and Droser2012), though later revised to the sixth most severe (McGhee et al., Reference McGhee, Clapham, Sheehan, Bottjer and Droser2013). This ranking was based on ecological restructuring coupled with a decline in origination rate, rather than an increase in extinction, with the proliferation of eurytopic genera characterized by low extinction and origination rates that dominated throughout the LPIA (Stanley and Powell, Reference Stanley and Powell2003; Powell, Reference Powell2005). This pattern is best exemplified by crinoid turnover and the loss of widespread encrinites, leading to the end of the “Age of Crinoids” (Kammer and Ausich, Reference Kammer and Ausich2006). Crinoid turnover was gradual, with camerate crinoids declining (without replacement) as the carbonate ramp area contracted before the onset of the LPIA and cladid crinoids becoming more abundant across habitats (Ausich and Kammer, Reference Ausich and Kammer2013). Rugose corals show a similar pattern. Late Visean assemblages were globally diverse, but diversity declined markedly through the Serpukhovian, with turnover concentrated in the late Serpukhovian (Kossovaya, Reference Kossovaya and Hart1996; Fedorowski, Reference Fedorowski2023). This decline has been attributed to drastic facies changes, such as those that accompanied the onset of the Variscan Orogeny, which excluded corals from many shallow-water environments in western Europe during the Serpukhovian (Aretz, Reference Aretz2010). The ecological signature of the Serpukhovian extinction is therefore better described as protracted restructuring driven by habitat change from physical processes, such as glacioeustasy and tectonic uplift, rather than as a boundary extinction pulse.
Although our analysis considered only brachiopods, field observations at Arrow Canyon are consistent with these ecological changes. Encrinites are primarily found in the Monte Cristo Group stratigraphically below the Battleship Wash Formation but are not observed higher in the section. Similarly, rugose bioherms in the Battleship Wash Formation are absent after the onset of the LPIA, coinciding with major glacioeustasy, increased terrigenous sediment input and changes in basin geometry (Bishop et al., Reference Bishop, Montanez, Gulbranson and Brenckle2009; Bishop et al., Reference Bishop, Montanez and Osleger2010). Although we did not quantitatively assess crinoids or rugose corals in our study, these observations are consistent with the physical processes thought to have driven ecological restructuring of crinoids and rugose corals (Kammer and Ausich, Reference Kammer and Ausich2006; Aretz, Reference Aretz2010). This suggests that crinoid and rugose coral turnover at Arrow Canyon could reflect loss of the depositional environments these groups occupied rather than global extinction.
Alternatively, most of North America (Laurentia) was situated in the tropics during the mid-Carboniferous (Blakey, Reference Blakey and Wong2007) and may have been an ideal destination for migrating taxa seeking optimal habitats. This could potentially explain why there is limited support for the Serpukhovian mass extinction in Laurentia, since expanding Gondwanan ice sheets likely had a greater effect on communities in the high southern latitudes where they developed (Kelley and Raymond, Reference Kelley and Raymond1991; Stanley and Powell, Reference Stanley and Powell2003; Powell, Reference Powell2007). Because ecological restructuring tied to depositional architecture depends on basin history, its expression should vary geographically for physical rather than climatic reasons. Rugose corals show this directly, with “refugia” and patchy survivorship producing weakly overlapping Bashkirian assemblages among basins (Fedorowski, Reference Fedorowski2023), and the Tindouf Basin in northwestern Africa not yielding a clearly recognizable Serpukhovian extinction (Cózar et al., Reference Cózar, Vachard, Somerville, Medina-Varea, Rodríguez and Said2014). Testing whether this explains the Laurentian pattern requires additional sections outside North America evaluated within their stratigraphic context.
The Serpukhovian extinction signal derives from stratigraphic range-through compilations at stage resolution (Saunders and Ramsbottom, Reference Saunders and Ramsbottom1986; Sepkoski, Reference Sepkoski, Raup and Jablonski1986, Reference Sepkoski and Wallister1996), with subsequent reassessments also using range-through data (Bambach, Reference Bambach2006; Stanley, Reference Stanley2007). Occurrence-based turnover estimators using PBDB occurrence data have previously used approximately 10 Myr temporal bins that place the Serpukhovian–Bashkirian boundary within a single interval (Alroy, Reference Alroy2008, Reference Alroy2014), precluding detection of turnover concentrated at that boundary. By contrast, standardized rate estimates computed from PBDB occurrence data at stage resolution show that the Serpukhovian is not a statistical outlier in extinction rate relative to background extinction (Kocsis et al., Reference Kocsis, Reddin, Alroy and Kiessling2019). Because extinction through the Phanerozoic is best explained as pulsed at stage boundaries rather than distributed within stages (Foote, Reference Foote2005), a genuine Serpukhovian extinction is expected to appear as a pulse at the Serpukhovian–Bashkirian boundary. The relevant question, therefore, is whether the pulse previously recorded in range-through data compilations is biological or a product of the facies preservation process described above. These patterns require more than occurrence data alone to untangle; they also require evaluating the facies context from which these occurrences are collected. Together, these patterns indicate that the brachiopod changes recorded across the mid-Carboniferous boundary at Arrow Canyon track the basin’s physical evolution rather than a global extinction event.
Conclusions
This study employs a stratigraphic paleobiology approach to test for evidence of the Serpukhovian mass extinction in the brachiopod communities across the mid-Carboniferous boundary GSSP in Arrow Canyon, Nevada. The results indicate that the Serpukhovian mass extinction is not expressed in this section. Multivariate analyses reveal no statistically significant differences in taxonomic composition between the Serpukhovian and Bashkirian intervals. Clustering and NMDS do delineate turnover between the Indian Springs and Bird Spring Formations, but this change in taxonomic composition results from facies change, expressed here as variation in terrigenous sediment input, due to glacioeustasy-driven changes in accommodation rather than true extinction.
Stratigraphic paleobiology is meant to be applied at the basin scale, where numerous stratigraphic sections can be sampled and described to consider how basin geometry and facies architecture distribute and control fossil communities through time and space (Patzkowsky and Holland, Reference Patzkowsky and Holland2012; Holland and Patzkowsky, Reference Holland and Patzkowsky2015; Holland, Reference Holland2020; Holland et al., Reference Holland, Patzkowsky and Loughney2025). Previous studies assessing diversity patterns across the Serpukhovian–Bashkirian boundary from the midcontinent of North America have relied on samples from numerous localities (Bonelli and Patzkowsky, Reference Bonelli and Patzkowsky2008, Reference Bonelli and Patzkowsky2011; Heim, Reference Heim2009). We show that a single stratigraphic section can yield results comparable to studies using multiple sections when additional comparable sections within a basin are unavailable, but only when the facies context is properly evaluated.
Globally defined mass extinctions are not always expressed at the local or regional scale. At Arrow Canyon, the apparent turnover of brachiopods reflects the basin’s physical evolution rather than biological extinction. Whether some regions were affected more than others at the end of the Serpukhovian requires further testing outside Laurentia. Combined with the absence of a resolvable Serpukhovian signal in updated sampling-standardized global data and the lack of a clear extinction in at least one other basin outside of Laurentia (i.e., Cózar et al., Reference Cózar, Vachard, Somerville, Medina-Varea, Rodríguez and Said2014), support for a Serpukhovian mass extinction is weaker than it has been previously suggested. Resolving this will require work beyond Laurentia and evaluated within a stratigraphic framework, as accurate interpretation of extinction in the field depends on understanding the facies architecture from which samples are collected.
Open peer review
To view the open peer review materials for this article, please visit http://doi.org/10.1017/ext.2026.10025.
Supplementary material
The supplementary material for this article can be found at http://doi.org/10.1017/ext.2026.10025.
Acknowledgments
P.M. is indebted to N. Bonuso for support and guidance and N. Hollis, S. Sullivan, S. Keffer, L. Rubi and M. Salmon for assistance in the field. We thank Tiffany Adrain of the University of Iowa Paleontology Repository for providing copies of the original field notes and locality files from the Amoco Production Company. We thank two anonymous reviewers whose comments and suggestions substantially improved this paper. This is Paleobiology Database publication 564.
Competing interests
The authors declare no competing interests exist.
Data availability statement
Datasets and code used in this study can be found in Cambridge Open Engage: https://doi.org/10.33774/coe-2026-t3tnp-v2.
Author contributions
P.M.M. contributed to conceptualization, investigation, formal analysis, methodology, visualization, writing – original draft, writing – review and editing. A.D.W. contributed to supervision, resources, writing – original draft, writing – review and editing.
Funding statement
This research was supported by a Paleontological Society Richard K. Bambach student research grant.




 Open access


Comments
02 April 2026
Professor Barry Brooks and Dr. John Alroy
Editors-in-Chief
Cambridge Prisms: Extinction
Cambridge University Press & Assessment
Shaftesbury Road, Cambridge, CB2 8EA
United Kingdom
Dear Professor Brooks and Dr. Alroy,
Enclosed is our manuscript entitled “Stratigraphic controls on the Serpukhovian (Upper Mississippian, Carboniferous) mass extinction at the mid-Carboniferous global boundary type locality”, which we would like to have considered for publication in Cambridge Prisms: Extinction.
The enclosed study tests for evidence of the Serpukhovian (Mississippian, Carboniferous) mass extinction event at the Global Stratotype Section and Point (GSSP) for the mid-Carboniferous boundary at Arrow Canyon in southern Nevada, USA. This extinction event was initially identified from a large fossil database, which estimates a 26–28% marine genera extinction, ranking it as the seventh-largest of the Phanerozoic. Regional studies from North America, however, indicate that despite faunal turnover, diversity remained stable, and assessments of taxa that were replaced indicate they did not go globally extinct. Instead, evidence suggests that extirpation and migration are related to changes in facies.
In our study, we further test for evidence of this mass extinction event using a stratigraphic paleobiology approach that considers the stratigraphic context of the brachiopod assemblages to control for the effects of facies changes on the interpretation of community composition change. Our results suggest that brachiopod genera exhibit an apparent extinction rate of 39%, consistent with global estimates. Global stratigraphic ranges of these brachiopods, however, indicate true extinction of only 6%. Moreover, multivariate analyses reveal taxonomic turnover at the same stratigraphic interval where apparent extinction occurs. This stratigraphic interval marks a major change in lithology and suggests that taxa that disappeared likely tracked their preferred habitats elsewhere.
Overall, our study further supports regional studies that a mass extinction event during the Serpukhovian in North America is either muted or did not occur. This underscores the importance of considering the structure of the stratigraphic record to separate biotic signals from stratigraphic ones when interpreting major biotic events in the fossil record, particularly extinction events.
Sincerely,
Pedro M. Monarrez
Assistant Professor of Paleobiology