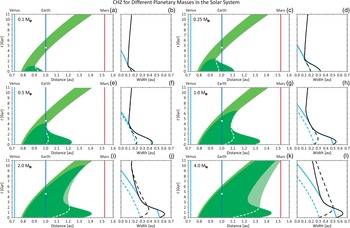
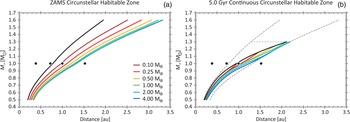
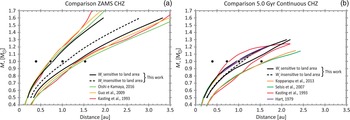
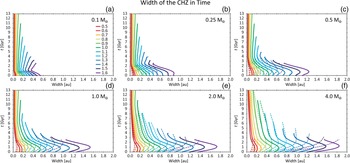
Introduction
Lifeforms are not equally distributed in space or time on Earth, with some parts of the natural world being even completely devoid of life. This seems to indicate that terrestrial lifeforms can inhabit just some regions of the space of physicochemical conditions. Extreme life forms – extremophiles – can withstand relatively extreme physicochemical conditions, but these are still narrow regions considering all the available space. In broad meaning, these regions are habitable zones. They are important for astrobiology by indicating the best places or set of conditions to search for life as we know it, to focus attention and resources initially. Nonetheless, in the case of other planets or extraterrestrial environments, where we are limited to remote methods and limited information, we require an indirect approach to evaluating and studying habitability.
There are many definitions for habitability and habitable zones in the literature, lacking a common standardization (Méndez et al., Reference Méndez, Rivera-Valentín, Schulze-Makuch, Filiberto, Ramírez, Wood, Dávila, McKay, Ceballos and Jusino-Maldonado2021). On the planetary-stellar scale, a type of habitable zone widely used is the circumstellar habitable zone (CHZ). Robustly described as the region around a star where bodies of water could be found in liquid state on a planetary surface, it relies more heavily on global and general parameters such as mean temperature, stellar flux and long-term water presence, but its boundaries may vary greatly depending on the specific criteria adopted, planetary features modelled or model used for calculations.
Considering the fast-growing flock of exoplanets discovered, a considerable amount of terrestrial, in the last few years, the CHZ has become very useful. Working as a first broad approximation for where habitable planets could be found in a stellar system – like the first terms in a series expansion, not giving the precise final answer, but pointing the way – it can guide our efforts to search and study life in the cosmos, helping focus and concentrate resources first in the most promising places. It must be simple and reliable as a first method for screening, but corrections may be applied and other terms included to increase its accuracy as we learn more about particular systems and planets, passing from a filter tool to the modelling of specific planets and geospheres. General and simpler models, being easier to scrutinize and covering a wider region of parameters space, may still have their place in this, helping us in this enterprise.
Classically, for an Earth-like planet, similar in gross parameters to Earth (about the same mass, composition, plate tectonics, H2O and carbon dioxide (CO2) as its main greenhouse gasses, etc.), the inner edge of the CHZ is dictated by water loss or the moist or runaway greenhouse, and the outer edge is dictated by the maximum greenhouse effect (Kasting et al., Reference Kasting, Whitmire and Reynolds1993; Kopparapu et al., Reference Kopparapu, Ramirez, Kasting, Eymet, Robinson, Mahadevan, Terrien, Domagal-Goldman, Meadows and Deshpande2013). Considering that between these boundaries the planet would be accepted as minimally habitable, the focus of most works is on studying the extreme cases, where the atmosphere is taken by water vapour (inner) or CO2 (outer).
Past Venus and Mars are commonly used as optimistic boundaries for the CHZ (Kasting et al., Reference Kasting, Whitmire and Reynolds1993; Kopparapu et al., Reference Kopparapu, Ramirez, Kasting, Eymet, Robinson, Mahadevan, Terrien, Domagal-Goldman, Meadows and Deshpande2013) in the Solar System, as there is evidence of considerable reservoirs of water and H2 that was lost on both planets (Donahue, Reference Donahue1999; Craddock and Howard, Reference Craddock and Howard2002; Baker, Reference Baker2006; Kulikov et al., Reference Kulikov, Lammer, Lichtenegger, Terada, Ribas, Kolb, Langmayr, Lundin, Guinan and Barabash2006; Di Achille and Hynek, Reference Di Achille and Hynek2010; Mahaffy et al., Reference Mahaffy, Webster, Stern, Brunner, Atreya, Conrad, Domagal-Goldman, Eigenbrode, Flesch and Christensen2015). However, on Venus, water might not have been able to condense in any oceans (Turbet et al., Reference Turbet, Bolmont, Chaverot, Ehrenreich, Leconte and Marcq2021), and on Mars, temperatures might have been too cold to form a perennial hydrological cycle, with only episodic existence of running water (Wordsworth, Reference Wordsworth2016; Wordsworth et al., Reference Wordsworth, Knoll, Hurowitz, Baum, Ehlmann, Head and Steakley2021).
In-between the boundaries, temperature stability and a wider CHZ are achieved by climate and geophysical feedbacks, of which the silicate-weathering feedback (or geologic carbon cycle) (Walker et al., Reference Walker, Hays and Kasting1981), regulating CO2 in the atmosphere in long timescales, is the most important one. This feedback may have little influence over the inner edge, dominated by water vapour, when temperatures are high and CO2 levels should, initially, have dropped by intensive weathering. But it is of high importance on the outer edge, where temperatures are low and the weakened weathering may permit the build-up of high CO2 levels and a more intense greenhouse effect.
Nonetheless, the levels of CO2 may not be increased indefinitely to maintain the planet above freezing and habitable, for example, by the increased Rayleigh scattering, which may compensate or surpass any gain in warming (Kasting et al., Reference Kasting, Whitmire and Reynolds1993; Kopparapu et al., Reference Kopparapu, Ramirez, Kasting, Eymet, Robinson, Mahadevan, Terrien, Domagal-Goldman, Meadows and Deshpande2013).
Another factor regarding CO2 is that the maximum CO2 outgassing rates for the planet are dictated by its geodynamics (Tajika, Reference Tajika2007; Kadoya and Tajika, Reference Kadoya and Tajika2014) and the effect of seafloor weathering (Le Hir et al., Reference Le Hir, Ramstein, Donnadieu and Goddéris2008) and land weathering (Walker et al., Reference Walker, Hays and Kasting1981). A small, old or poor in radioisotopes planet may be too cold internally and geologically inactive to be able to maintain arbitrarily high levels of CO2 in its atmosphere under habitable conditions (Gonzalez et al., Reference Gonzalez, Brownlee and Ward2001; Gonzalez, Reference Gonzalez2005). A close example of this in the Solar System would be Mars, too small and too light to retain intense geologic activity and a dense atmosphere for many billions of years.
In the case of Earth, ancient evidence of life (Ohmoto et al., Reference Ohmoto, Watanabe and Kumazawa2004; Noffke et al., Reference Noffke, Christian, Wacey and Hazen2013; Bell et al., Reference Bell, Boehnke, Harrison and Mao2015) and liquid water on its surface (Wilde et al., Reference Wilde, Valley, Peck and Graham2001) indicate that our planet may have spent most, if not all, of its life inside the CHZ of the Solar System. Present Earth conditions could not have permitted that as the Sun was ~25% less luminous 4.5 Gyr ago. This can be explained if our planet were in a very different state than today, a combination of a plethora of phenomena, including different clouds physics, small land area and more greenhouse gases (Rosing et al., Reference Rosing, Bird, Sleep and Bjerrum2010; Charnay et al., Reference Charnay, Le Hir, Fluteau, Forget and Catling2017; Krissansen-Totton and Catling, Reference Krissansen-Totton and Catling2017; Charnay et al., Reference Charnay, Wolf, Marty and Forget2020), the later mostly from heightened geological activity.
Considering Earth's future, a handful of papers over the years have attempted to estimate quantitatively the future habitability of our planet and the life span of the biosphere, obtaining a wide variety of estimates. Earlier works modelled the evolution of the Sun's luminosity and Earth's atmosphere, estimating 100 Myr (Lovelock and Whitfield, Reference Lovelock and Whitfield1982) to 800 Myr (Caldeira and Kasting, Reference Caldeira and Kasting1992). More recent models estimate a longer life span, from 1.2 Gyr (Lenton and von Bloh, Reference Lenton and von Bloh2001) to ~1.6 Gyr (Franck et al., Reference Franck, Bounama and Bloh2006; Mello and Friaça, Reference Mello and Friaça2020). These models included the influence of the geosphere on the water surface reservoir and gaseous exchanges.
Three-dimensional (3D) climate models and global circulation models (GCMs) of Earth's climate adapted to astrobiological purposes are still computationally expensive to run but better suited to probe the inner edge of the CHZ, where humidity and water clouds physics play important roles in determining greenhouse feedback and the onset of thermal runaway, presenting a higher climate sensitivity than one-dimensional (1D) models (Wolf and Toon, Reference Wolf and Toon2014). They also require lower CO2 partial pressures to reach habitable temperatures (Charnay et al., Reference Charnay, Wolf, Marty and Forget2020), and indicate a slower increase in temperatures for future Earth when compared with 1D models (Abe et al., Reference Abe, Abe-Ouchi, Sleep and Zahnle2011; Wolf and Toon, Reference Wolf and Toon2014, Reference Wolf and Toon2015).
Going further, some ice moons may contain subsurface oceans of liquid water, and free-floating planets – not orbiting any star – may be able to maintain surface liquid water if their atmospheres are dense enough (Stevenson, Reference Stevenson1999) or below kilometres of ice if the heat flux from the interior of the planets is high enough (Abbot and Switzer, Reference Abbot and Switzer2011). Planets with high-seasonal variability (via high eccentricity or obliquity) can maintain ice-free areas further distant from the host star than planets without seasonal variability (Linsenmeier et al., Reference Linsenmeier, Pascale and Lucarini2015).
All these last cases are not in the classical CHZ but they indicate that the CHZ might have an undefined outer edge in a more inclusive formulation of just long-lasting bodies of liquid water somewhere in the orb. But Earth-like approaches, more conservative, may still not be completely unreasonable because even if liquid water can be sustained in more regions than expected before, water may be necessary but not sufficient for long-lived and stable environments for life as we know it.
Taking all these together and we can expect that (i) the CHZ may be wider and longer-lived than previously thought in the classical form, (ii) it depends not only on stellar parameters but also on planetary ones, specifically geophysics and (iii) it can change substantially with the passage of time.
The possible influence the geosphere can have on planetary habitability is not left unnoticed in the literature as mentioned before, mostly on the outer edge of CHZ (Kopparapu et al., Reference Kopparapu, Ramirez, SchottelKotte, Kasting, Domagal-Goldman and Eymet2014; Abbot, Reference Abbot2016; Ramirez and Kaltenegger, Reference Ramirez and Kaltenegger2017). But a whole Earth system treatment regarding the CHZ is hardly explored, with few exceptions (Franck et al., Reference Franck, Block, Von Bloh, Bounama, Schellnhuber and Svirezhev2000a, Reference Franck, Von Bloh, Bounama, Steffen, Schönberner and Schellnhuber2001; Kadoya and Tajika, Reference Kadoya and Tajika2015).
The main goal of this article is to try to cover this gap and explore the links between geospheres and habitability in the classical CHZ, especially the limits for CO2 levels imposed by volcanism and weathering. For this, we use a parametrized minimal model of the mantle and atmosphere evolution to track the habitability and the boundaries of the CHZ for Earth-like planets of different masses, comparing the results with the literature and commenting on the results.
Model description
We use here the same model described in Mello and Friaça (Reference Mello and Friaça2020) minus a few changes because we made to extend the applicability of the model to other rocky planets and other types of main sequence stars beside the Earth–Sun system. Save for these minor but relevant changes or additions, all the other constants, parameters, initial conditions and equations were maintained the same. In this manner, we are modelling only Earth-like or terrestrial planets with H2O and CO2 atmospheres, a subset of all possible habitable planets, determining a conservative CHZ.
Before describing the changes, a brief description of the model is of a coupling of two modules, a geophysical and an atmospheric one. The geophysical one models the thermal evolution of the mantle (McGovern and Schubert, Reference McGovern and Schubert1989; Franck and Bounama, Reference Franck and Bounama1995; Franck et al., Reference Franck, Kossacki, Von Bloth and Bounama2002; Korenaga, Reference Korenaga2006, Reference Korenaga2008), where the rate of change of the average internal temperature, T i, is proportional to the energy generated by the decay of radioactive isotopes in the mantle, H, minus the surface heat loss, Q, as given by:

where C E is the effective heat capacity of the whole Earth. The internal temperature is approximated by the effective mantle potential temperature, T m. We used four radioactive isotopes: 235U,238U, 232Th and 40K, setting the past concentrations via the estimated present concentration from Labrosse and Jaupart (Reference Labrosse and Jaupart2007) and Arevalo et al. (Reference Arevalo, McDonough and Luong2009). We used an Arrhenius-type viscosity for the rheology:

where η 0 is a reference viscosity in the reference temperature T 0, E is the activation energy and R is the molar gas constant. And we parameterized the heat loss from a convecting mantle via plate-tectonics according to Conrad and Hager, (Reference Conrad and Hager1999a, Reference Conrad and Hager1999b) and Korenaga (Reference Korenaga2006).
Continental area may impact weathering but also impacts the geodynamics of the planet because continental crust concentrates radioactive material from the mantle as it grows (so influencing H). In our model, the bulk of the continental crust formed between 1.0 and 3.5 Gyr, starting at its lowest value in t = 0, at around 3%, increasing in a sigmoid function (following Rosing et al., Reference Rosing, Bird, Sleep and Bjerrum2010) to the actual value and stationing in it for future times. This time frame is in accordance with most of the other models in the literature (Taylor and McLennan, Reference Taylor and McLennan1995; Belousova et al., Reference Belousova, Kostitsyn, Griffin, Begg, O'Reilly and Pearson2010; Condie and Aster, Reference Condie and Aster2010; Dhuime et al., Reference Dhuime, Hawkesworth, Cawood and Storey2012) and estimates of episodic growth (Hawkesworth et al., Reference Hawkesworth, Cawood and Dhuime2016). But the time needed to build the actual continental volume and the actual rate of growth is still a matter of considerable debate.
The atmospheric module (Caldeira and Kasting, Reference Caldeira and Kasting1992; Kasting et al., Reference Kasting, Whitmire and Reynolds1993; Lenton, Reference Lenton2000) uses a quasi-grey atmosphere (Chamberlain, Reference Chamberlain1980; Chamberlain and Hunten, Reference Chamberlain and Hunten1990) to obtain the mean surface temperature, T s:

where σ is the Stefan–Boltzmann constant, A p is the effective planetary albedo, S is the incoming flux at the top of the atmosphere and τ is the optical depth of the atmosphere. The two greenhouse gases, H2O and CO2, are considered independently:


where pH2O is the water saturation vapour pressure given by the Clausius–Clapeyron equation, and pCO2 is the carbon dioxide partial pressure. The $\tau _{{\rm H}_{2}{\rm O}}$ is more confidently applicable in the range 250 to ~400 K, and the $\tau _{{\rm CO}_{2}}$
 in the range 0.0–5.0 bar. A new fit for a wider range and the use of data from Haqq-Misra et al. (Reference Haqq-Misra, Domagal-Goldman, Kasting and Kasting2008) resulted in the above parameters, a little different from the ones in Mello and Friaça (Reference Mello and Friaça2020).
Beyond CO2, ancient abiogenic sources of CH4 could have maintained concentrations up to ~2.5 ppm (Guzmán-Marmolejo et al., Reference Guzmán-Marmolejo, Segura and Escobar-Briones2013), higher than the pre-industrial levels of ~0.7 ppm (Macfarling Meure et al., Reference Macfarling Meure, Etheridge, Trudinger, Steele, Langenfelds, Van Ommen, Smith and Elkins2006). Also, in the specific case of Earth, biogenic sources could have maintained concentrations between 0.1 and 35 mbar (Kharecha et al., Reference Kharecha, Kasting and Siefert2005; Krissansen-Totton et al., Reference Krissansen-Totton, Olson and Catling2018a; Ozaki et al., Reference Ozaki, Tajika, Hong, Nakagawa and Reinhard2018; Schwieterman et al., Reference Schwieterman, Reinhard, Olson, Harman and Lyons2019; Sauterey et al., Reference Sauterey, Charnay, Affholder, Mazevet and Ferrière2020). For simplicity, we will discuss only the classical abiotic CHZ with H2O and CO2, not including CH4.
Planetary albedo
The most substantial change in the model was for the parameterization of planetary albedo. In Mello and Friaça (Reference Mello and Friaça2020) the albedo function used was a parameterization given in Williams and Kasting (Reference Williams and Kasting1997) with a small change for better albedo continuity around 280 K. The parameterization was for the present solar spectrum. Intending to use the same parameterization for other stars we need to introduce corrections in the albedo to account for the different spectra of stars of different masses.
We performed the albedo correction in function of stellar mass, not stellar effective temperature or metallicity. Stellar metallicity can change stellar luminosity, and spectral distribution and is correlated with the composition and frequency of exoplanets, so it is important for astrobiology considerations. But varying stellar metallicity would introduce a dimension and complexity that we did not intend to explore here, so we restricted ourselves to solar metallicity stars only. For effective temperature, we thought that a correction to the albedo parameterization given in Williams and Kasting (Reference Williams and Kasting1997) performed on effective temperature first and then correlated with stellar age and then to mass could introduce more uncertainties than to do direct on mass and use a fixed effective temperature. Our preference to use the parameterization given in Williams and Kasting (Reference Williams and Kasting1997), even knowing of the fixed spectrum and no dependency on stellar effective temperature, contributed to this. Other albedo parameterizations in the literature are simpler and would be easier to correct for different stellar effective temperatures, but they may not be so precise and may not have dependencies on surface albedo a s, pCO2 and T s, which are all critical to our ends.
For consistency, we used the results of Kasting et al. (Reference Kasting, Whitmire and Reynolds1993) for different stellar masses to correct the albedo parameterization of Williams and Kasting (Reference Williams and Kasting1997) because the parameterization was fitted over results of the convective climate model presented in Kasting and Ackerman (Reference Kasting and Ackerman1986) and Kasting (Reference Kasting1988, Reference Kasting1991), and the same convective climate model was used by Kasting et al. (Reference Kasting, Whitmire and Reynolds1993). The range of stellar masses considered in Kasting et al. (Reference Kasting, Whitmire and Reynolds1993) limited us to ~0.5 to ~1.6 M$_{\odot }$ (M1 to F0 stellar spectral types).
The stellar effective temperatures used for the correction are around the middle path in the main sequence for every stellar mass considered. This seemed to us to characterize each star better than using effective temperatures at the zero-age main sequence (ZAMS). This procedure is not spared from errors, as effective temperatures do change during stellar evolution, but we consider these errors small when compared with luminosity changes (which we model in equations (22) and (23)), the correlation between stellar mass and effective temperature and other uncertainties in our model.
The changes in albedo with stellar spectrum are more noticeable in denser atmospheres full of gaseous absorbers, which in our case means atmospheres with higher surface temperatures and higher pCO2 (more gases to absorb infrared radiation and to scatter blue radiation by Rayleigh scattering) (Kasting et al., Reference Kasting, Whitmire and Reynolds1993). On the lower end of the stellar mass range considered here, 0.5 M$_{\odot }$ , the spectrum is shifted to the infrared, and planetary albedo decreases, as there is less blue light to be scattered and more infrared radiation to be absorbed by H2O and CO2. On the higher end of the range, 1.6 M$_{\odot }$
 , it is the opposite, and planetary albedo increases, as there is more blue light to be scattered and less infrared radiation to be absorbed by H2O and CO2.
For one-solar-mass stars, effective temperature varies a few per cent during the main sequence phase (Hurley et al., Reference Hurley, Pols and Tout2000; Mowlavi et al., Reference Mowlavi, Eggenberger, Meynet, Ekström, Georgy, Maeder, Charbonnel and Eyer2012), 4% for the Sun in the model of Schröder and Connon Smith (Reference Schröder and Connon Smith2008). Lower mass stars, with slower evolution, might have an even smaller change in effective temperature in the scale of ~10 Gyr of our interest (Baraffe et al., Reference Baraffe, Chabrier, Allard and Hauschildt1998; Hurley et al., Reference Hurley, Pols and Tout2000; Mowlavi et al., Reference Mowlavi, Eggenberger, Meynet, Ekström, Georgy, Maeder, Charbonnel and Eyer2012). Higher mass stars, on the other hand, may present a bigger change, with a 1.6 M$_{\odot }$ star having a change in effective temperatures of ~10% during its main sequence phase (Mowlavi et al., Reference Mowlavi, Eggenberger, Meynet, Ekström, Georgy, Maeder, Charbonnel and Eyer2012). This 10% change in effective temperature is equivalent to a change of ~10% in stellar mass, and a ~8% change in our planetary albedo.
The final albedo function, A p, is divided into three parts. The first is identical to the albedo presented in Mello and Friaça (Reference Mello and Friaça2020), a polynomial dependent of surface temperature, T s, CO2 partial pressure, pCO2, the cosine of the solar zenith angle, μ = cos(Z) and surface albedo, a s. This part is divided into two ranges and linked by two sigmoid functions, Sigi, for better continuity. The second part is the correcting factor $Cor_{T_{\rm s}}$ , dependent on planetary surface temperature and stellar mass, M *, in solar masses. And the third part is the correcting factor $Cor_{p{\rm CO}_{2}}$
 , dependent on CO2 partial pressure and stellar mass:


Parameters for $Cor_{T_{\rm s}}$ and $Cor_{p{\rm CO}_{2}}$
 are shown in Table I. As in Mello and Friaça (Reference Mello and Friaça2020) we fixed $Z = 60^\circ$
 . Considering the solar case (M * = 1.0 M$_{\odot }$
 , a s = 0.2 and pCO2 = 0.0), the difference of this parameterization from that of Mello and Friaça (Reference Mello and Friaça2020) is small around solar mass and for low CO2 partial pressure (<0.5 bar), moreover considering the great variation between functions in the literature (Fig. 1).
Comparison of some planetary albedos in the literature. The parameterization of Williams and Kasting (Reference Williams and Kasting1997) shown is with values of a s = 0.2, $Z = 60^\circ$ and pCO2 = 0.0. And our parameterization shown above is with a s = 0.2 and pCO2 = 0.0.

Parameters for the planetary albedo correcting factors $Cor_{T_{\rm s}}$ and $Cor_{p{\rm CO}_{2}}$


The surface albedo is better understood as an effective albedo in the absence of real cloud physics, involving the real surface albedo plus the effect of lower (increasing albedo) and higher (greenhouse-inducing) clouds. Because of that, its value varies considerably in the literature depending on the specifics of the model, going from 0.125 to 0.32 (Goldblatt and Zahnle, Reference Goldblatt and Zahnle2010; Rosing et al., Reference Rosing, Bird, Sleep and Bjerrum2010; Kopparapu et al., Reference Kopparapu, Ramirez, Kasting, Eymet, Robinson, Mahadevan, Terrien, Domagal-Goldman, Meadows and Deshpande2013; Wolf and Toon, Reference Wolf and Toon2015), but being around 0.2 for most models without explicit clouds physics (Kasting et al., Reference Kasting, Whitmire and Reynolds1993; Pavlov et al., Reference Pavlov, Kasting, Brown, Rages and Freedman2000; Haqq-Misra et al., Reference Haqq-Misra, Domagal-Goldman, Kasting and Kasting2008; von Paris et al., Reference von Paris, Rauer, Grenfell, Patzer, Hedelt, Stracke, Trautmann and Schreier2008; Zsom et al., Reference Zsom, Seager, De Wit and Stamenković2013). We used a surface albedo of a s = 0.184 to reach a surface temperature of T s = 87 K at t = 4.57 Gyr.
Abiotic planets
The model of Mello and Friaça (Reference Mello and Friaça2020) has a biosphere module to model some biological productivity and to account for some of the influence that the biosphere has on Earth's climate. This is especially important in the effect of vascular plants on the atmospheric CO2, increasing weathering and the exit of CO2 from the atmosphere (Walker et al., Reference Walker, Hays and Kasting1981). In an abiotic Earth, weathering could be dozens of times lower than today and CO2 concentrations would be higher in that case (Schwartzman and Volk, Reference Schwartzman and Volk1989). During the Archaean, higher concentrations of biogenic methane may have assisted, with the help of higher levels of geologic CO2, to increase the greenhouse effect and maintain Earth within habitable temperatures (Pavlov et al., Reference Pavlov, Hurtgen, Kasting and Arthur2003; Kasting, Reference Kasting2005; Haqq-Misra et al., Reference Haqq-Misra, Domagal-Goldman, Kasting and Kasting2008; Olson et al., Reference Olson, Reinhard and Lyons2016; Catling and Zahnle, Reference Catling and Zahnle2020). And, according to the Gaia hypothesis of Lovelock and Margulis (Reference Lovelock and Margulis1974), life could be necessary for a planet to be fully habitable.
Nonetheless, most of the models of planetary habitability and habitable zones have the premise of habitability determined primarily or uniquely by abiotic phenomena. This may be because it is easier and more reliable to do so with the current models and knowledge. Astronomical and geophysical phenomena are easier to model and scale up and down than the biosphere and the intricate relations of its parts. Earth itself was not inhabited in the deep past and life was able to emerge and exist in it when its influence may have been small or non-existent. So, even if a planet is more habitable if inhabited, the effects of life in it may be of secondary order and harder to predict and model in a general way as we are intending to do here.
Focusing on the importance of the geosphere and planetary parameters for the modelling and boundaries of the classical CHZ, we used the biosphere module only to initially calibrate parameters to present Earth, with no biosphere module on the following runs. We did this way because we know the state of our planet in its present biotic state, but not in an abiotic state, so better calibrate against something we are more sure about. We run an abiotic Earth, with the biosphere module turned off, after the calibration, to compare the differences. The differences are small due to our simple modelling and we comment on them in the Results section.
Planetary composition
Earth has a bulky composition by mass of roughly 1/3 metal (mostly in iron in the core), and 2/3 rock (mostly in silicates in the mantle), with water making just around 0.05% by mass. In the Solar System, the bulky composition of the interior planets does not deviate much from this fraction, with Mercury a little more metallic and Mars a little rockier. The great moons of the giant planets present a different case, some (Ganymede, Titan, Calisto) being much less dense and rich in volatiles. Other rocky exoplanets may deviate from these compositions and may have different geodynamics.
At the present, Earth is unique regarding the presence of plate tectonics. The motives for this may be hard to address and to scale to other rocky planets in the parameter space. In the literature, super-Earths may be more (Valencia et al., Reference Valencia, O'connell and Sasselov2007; Van Heck and Tackley, Reference Van Heck and Tackley2011; Tikoo and Elkins-Tanton, Reference Tikoo and Elkins-Tanton2017) or less (O'Neill et al., Reference O'Neill, Jellinek and Lenardic2007; Kite et al., Reference Kite, Manga and Gaidos2009) probable to have plate tectonics, or even having them depending on initial conditions (Lenardic and Crowley, Reference Lenardic and Crowley2012). Because of the considered relevance of plate tectonics for Earth's habitability and its integral part in the global carbon cycle, we maintained plate tectonics regime in our modelling by default. This restricts what type of planet we are modelling.
Further, the model of Mello and Friaça (Reference Mello and Friaça2020) is not calibrated to model volatile-rich planets too distant from Earth on the parameter space, at least not without changing first many key parameters and equations. The correct choice of parameters and equations may be hard to set in this situation and we decided to focus on rocky planets with the same bulky composition by mass as Earth, rich in volatiles (by interior Solar System standards), but much less than necessary to be called ocean worlds (much less than 1% water by mass).
Mass–radius relationship
The mass–radius relationship changes considerably for different bulky compositions, changing the depth of the different layers of the modelled planet and, possibly, its geodynamics. We followed the mass–radius relationship of Fortney et al. (Reference Fortney, Marley and Barnes2007) as our scaling law for planetary radius when varying planetary mass:

where R p is the radius of the planet in Earth radius, rmf is the rock to iron mass fraction (0.67 in Earth's case) and M p is the mass of the planet in Earth masses.
This relationship is in accordance with others of the literature (Sotin et al., Reference Sotin, Grasset and Mocquet2007; Valencia et al., Reference Valencia, O'connell and Sasselov2007; Weiss and Marcy, Reference Weiss and Marcy2014). We scaled the mantle and core radii following the relationship of Fortney et al. (Reference Fortney, Marley and Barnes2007) assuming they would maintain the same proportion on Earth today and we scaled water reservoirs and mantle mass with the planetary mass.
Mass range
The minimal planetary mass for habitability was studied by Arnscheidt et al. (Reference Arnscheidt, Wordsworth and Ding2019). They concluded that a ~0.027 M$_{\oplus }$ planet could retain habitable temperatures and a water-based atmosphere for 109 years. However, we cannot follow them to this limit because they considered low-gravity water worlds, planets constituted 40% of water, with an atmosphere of pure water, no CO2 and no geophysical cycling.
Mars, with 0.107 M$_{\oplus }$ , lost its planetary magnetic field, the majority of its atmosphere, water and its habitability billions of years ago, but might have had surface liquid water before that; because of its constitution similar to Earth, it is a better inferior limit in mass for our study.
On the other end of the range, super-Earths of ~10 M$_{\oplus }$ are a popular pick. However, Weiss and Marcy (Reference Weiss and Marcy2014) indicate a rapid increase of radius for masses above ~4 M$_{\oplus }$
 (or above ~1.5 Earth radius). This may be because of a greater accumulation of volatiles on those planets, making them more like mini-Neptunes than super-Earths. This type of planet may be less habitable, if not uninhabitable, than planets with thinner atmospheres. Thus, we restricted our study to the planetary masses in the range of 0.1–4.0 M$_{\oplus }$
 (or 0.49–1.44 R$_{\oplus }$
 following Fortney et al. (Reference Fortney, Marley and Barnes2007)).
Orbital parameters
Long-term planetary habitability can be influenced by orbital parameters, such as eccentricity, obliquity and precession via changes in stellar fluxes received by the planet. As these can change by interactions with other planets in the system, especially gaseous giant planets (Dvorak et al., Reference Dvorak, Pilat-Lohinger, Bois, Schwarz, Funk, Beichman, Danchi, Eiroa, Fridlund and Henning2010; Spiegel et al., Reference Spiegel, Raymond, Dressing, Scharf and Mitchell2010; Vervoort et al., Reference Vervoort, Horner, Kane, Turner and Gilmore2022), planetary habitability could depend on the whole system configuration.
High obliquity planets present severe climates, with large amplitude seasonal variations (Williams and Pollard, Reference Williams and Pollard2002), but this may not necessarily mean they would be uninhabitable or more prone to global glaciations than low obliquity planets. Close to the outer edge of the CHZ, planets may be less affected by high obliquities due to richer CO2 atmospheres (Williams and Kasting, Reference Williams and Kasting1997), they may receive more input of energy on high latitudes during summer (Colose et al., Reference Colose, Del Genio and Way2019), showing higher global temperatures (Kilic et al., Reference Kilic, Raible and Stocker2017) and resilience to global glaciation in general (Spiegel et al., Reference Spiegel, Menou and Scharf2009) or if having rapid obliquity oscillations (Armstrong et al., Reference Armstrong, Barnes, Domagal-Goldman, Breiner, Quinn and Meadows2014).
As obliquity may decrease fast (from 23$^\circ$ to 5$^\circ$
 in <1 Gyr) for planets orbiting stars with less than 0.9 M$_{\odot }$
 due to gravitational tides (Heller et al., Reference Heller, Leconte and Barnes2011), planets close to the outer edge of the CHZ in low-mass stars may not present this time of climate stability.
High eccentric orbits may also present large variations in surface temperatures but also an increased resilience to global glaciations. Williams and Pollard (Reference Williams and Pollard2002) showed that the time-averaged flux over an eccentric orbit rises with increasing eccentricity, which extends habitability on the outer edge of the CHZ for planets with highly eccentric orbits. This has been indicated again in posterior works (Dressing et al., Reference Dressing, Spiegel, Scharf, Menou and Raymond2010; Linsenmeier et al., Reference Linsenmeier, Pascale and Lucarini2015). But Bolmont et al. (Reference Bolmont, Libert, Leconte and Selsis2016) found that the approximation of Williams and Pollard (Reference Williams and Pollard2002) would be adequate only for planets with low eccentricities, and the climate on high eccentricity planets could be highly degraded, with extremes of temperatures, when the planet is temporarily outside the CHZ. More precisely, they say that the mean flux approximation is less reliable the higher the eccentricity of the planet or the higher the luminosity of the star. But their work has the limitation of being set in water world planets in tidally locked orbits with zero obliquity and no carbon feedback.
To maintain focus on our object of study of planetary geodynamics, we will consider here only the simple case of planets with circular orbits and no obliquity (our zero-dimensional (0D) model has no explicit representation of it). This has the effect that our results may be more conservative and present a narrower CHZ, especially on the outer edge. We should expect that planets whit high-seasonal variability (via high eccentricity or obliquity) can maintain ice-free areas further distant from the host star than planets without seasonal variability, extending the outer edge of the CHZ, but the frequent turn in extremes of climate could be a potential hardship for life.
Atmosphere loss
Earth has a strong magnetic field that assists in the protection from atmospheric erosion via solar wind (Stadelmann et al., Reference Stadelmann, Vogt, Glassmeier, Kallenrode and Voigt2010). This could be an important requirement for any planet to maintain its habitability for billions of years.
The existence of this magnetic field by dynamo effect depends on (i) the existence of a conductive fluid material (Earth's liquid core), (ii) a temperature gradient for convective transport of energy (Earth's core slowly losing energy to the mantle) and (iii) a fast rotating planet as a source of kinetic energy (Vázquez et al., Reference Vázquez, Pallé and Rodríguez2010).
Because Earth is rotating slower with time, the inner core is losing heat, and the liquid outer core is solidifying on the inner core, there is the potential of limiting the maintenance of a strong magnetic field in the future. We can examine whether the three prerequisites will hold in the future for our planet.
In the model of Mello and Friaça (Reference Mello and Friaça2020), there is no explicit modelling for the core or core–mantle interface, but it is modelled implicitly as part of the whole system. In this case, the cooling of the core depends on the cooling of the mantle (Korenaga. Reference Korenaga2006) via heat flux through plates tectonics, and the mantle would continue to cool rather steadily for the next couple of billions of years, making this point of lower concern. Low-mass planets cool down faster and probably would face weakening magnetic fields earlier.
The remaining lifespan of Earth's outer liquid core is harder to estimate. The age of the inner core is estimated to be between 0.5 and 4.2 Gyr (Stacey and Stacey, Reference Stacey and Stacey1999; Labrosse et al., Reference Labrosse, Poirier and Le Mouël2001; Tarduno et al., Reference Tarduno, Cottrell, Watkeys, Hofmann, Doubrovine, Mamajek, Liu, Sibeck, Neukirch and Usui2010; Smirnov et al., Reference Smirnov, Tarduno and Evans2011; Biggin et al., Reference Biggin, Piispa, Pesonen, Holme, Paterson, Veikkolainen and Tauxe2015; Konôpková et al., Reference Konôpková, McWilliams, Gómez-Pérez and Goncharov2016; Ohta et al., Reference Ohta, Kuwayama, Hirose, Shimizu and Ohishi2016; Bono et al., Reference Bono, Tarduno, Nimmo and Cottrell2019; Driscoll, Reference Driscoll2019). Knowing the volume of the inner core (7.6 × 10¹⁸ m3), it is possible to calculate a linear rate of growth of 57.5 to 483 m3 s−1. Knowing the volume of the outer core (1.7 × 10²⁰ m3), a rough estimate for the total solidification of the outer core is between 11.1 and 93 Gyr. A more careful estimate may be obtained from the current inner core radius rate of growth of 0.5 mm year−1 (Monnereau et al., Reference Monnereau, Calvet, Margerin and Souriau2010) and 1.0 mm year−1 (Buffett, Reference Buffett2000), or 297 and 594 m3 s−1, respectively. This results in a future lifespan of 2.26–4.52 Gyr, a more moderate result, but still more than enough considering Earth's habitable lifespan, because of the runaway greenhouse in approximately 1–2 Gyr (Mello and Friaça, Reference Mello and Friaça2020).
The rotational period of our planet is increasing at a rate of ~2 h Gyr−1 for the last 2.45 Gyr (Williams, Reference Williams2000). The extrapolation of this rate into the future gives a day of ~28 h in 2.0 Gyr and a day of ~35 h in 5.5 Gyr. The 28 h case may still be fast enough to maintain a strong magnetic field in a one-Earth-mass planet according to Zuluaga and Cuartas (Reference Zuluaga and Cuartas2012) and Zuluaga et al. (Reference Zuluaga, Bustamante, Cuartas and Hoyos2013).
In sum, Earth probably will maintain the prerequisites to maintain a strong magnetic field for the next couple of billions of years or, at least, until the runaway greenhouse.
This certainly is not true for every terrestrial planet, because planets vary in their parameters, and not every planet may check for all prerequisites. In our stellar system, there is the case of Mars and Venus with very small planetary magnetic fields when compared with Earth. Where Mars, even with a rotational period only slightly larger than Earth's at 24.6 h, may have solidified its liquid core too fast via rapid heat loss by its small size, and Venus, close in size and composition to Earth, spins too slowly, with a sidereal day of more than 243 terrestrial days. And, while a one-Earth-mass planet may have to maintain a rotational period around one Earth day to maintain the possibility of a strong magnetic field for many billions of years, it may be easier for more massive rocky planets to do the same with a rotational period in the range of 1–3 terrestrial days (Zuluaga and Cuartas, Reference Zuluaga and Cuartas2012), extending the habitability potential for a wider range of rotational periods.
Adding to this, a unique differential of our planet in the Solar System is the presence of our big Moon, considered a stabilizer for Earth's obliquity (Laskar et al., Reference Laskar, Joutel and Robutel1993) and influencing on the rotational period over time (Williams, Reference Williams1993). If such a big moon is a rare occurrence in the cosmos and it is indeed needed to stabilize a terrestrial planet's orbit and increase its habitability, habitable planets with stable climates could also be rare in the cosmos. However, this seems not to be the case. Lissauer et al. (Reference Lissauer, Barnes and Chambers2012) showed that a large moon would not be needed to stabilize the obliquity of an Earth-like planet on timescales of billions of years. Obliquity's amplitude would be higher than for present moon-full Earth, but typically much more constrained than early expectations, on the range of $\sim \!10^\circ$ to $\sim \!50^\circ$
 . Also, giant impacts with the required energy and orbital parameters for producing a binary planetary system may occur frequently enough that ~10% of Earth-like planets in habitable zones could possess a massive moon like in the Earth–Moon system (Elser et al., Reference Elser, Moore, Stadel and Morishima2011).
One of the most important factors determining the long-term survival of exomoons is the orbital period of the planet, with survivability falling for short orbital periods due to tidal instabilities induced by the host star (Dobos et al., Reference Dobos, Charnoz, Pál, Roque-Bernard and Szabó2021). As terrestrial planets in the CHZ of low mass stars (especially of M type) have low orbital periods ($\lesssim$ 100 days), they may rarely possess a moon for long astronomical timescales. They may also be face locked to their stars very early in their evolution, and even if their spin state can be pushed into higher amplitude librations by interactions with companion planets in the system (Vinson and Hansen, Reference Vinson and Hansen2017), they would still present very large rotational periods and, in consequence, probably low planetary magnetic fields, exposing more of their atmospheres to stellar wind erosion.
A lot can influence orbital parameters and we do not know if all prerequisites for a strong magnetic field are widespread and common or if they are a rare condition for terrestrial planets. For simplicity, we do not consider here planetary magnetic fields and atmospheric erosion due to stellar wind, concentrating on studying other geophysical constraints that may influence planetary habitability. This means that our results are less accurate for the cases in which the timescale for atmospheric loss approaches the timescale for geodynamical habitability, more specifically, in the cases of old planets, low-mass planets, slow rotating planets and planets orbiting low-mass stars.
Ocean depth
We partitioned the initial water reservoirs of surface/mantle as 1 : 2: 1.0 oceanic mass (one oceanic mass being 1.4 × 10²¹ kg) on the surface and 2.0 oceanic masses in the mantle, adjusting free parameters to reach the same partition at t = 4.57 Gyr. How much water there is in the mantle is uncertain and we discuss this uncertainty in the following sections. The initial water mass in the oceans and mantle were varied proportionally with planetary mass. In that way, for example, a planet twice the mass of Earth would have twice the mass of water.
We followed the approximation of Cowan and Abbot (Reference Cowan and Abbot2014) to calculate the effective ocean depth, d oc. In this approximation, the tops of continents are at sea level, that is, the continental freeboard is much smaller than the depth of the ocean basins, and the depth of the oceans is the depth of the ocean basins necessary to contain all the water on the surface (minus in the atmosphere). The area of the ocean basins is considered the area of the planet not covered by continental crust. Around 35% of the surface of the present Earth is covered by continental crust, but just 30% of the surface is dry-emerged land. Part of the continents is underwater on the continental shelf, and part of emerged lands (e.g. Iceland) is not continental crust, but seafloor.
The rate of continent growth may be different on different planets and this may impact habitability differently, but this may be a too large problem to tackle in this work. We suppose the same continental growth for all runs, even in the case of no weathering sensitivity to continental area, because the concentration of radioactive material would still occur. A consequence of this in our model is that more massive planets will have large continents (in absolute units) because they possess large surface areas, and less massive planets will possess small continents (in absolute units).
Note that we equalized continental crust volume relative to today with continental area and with land area, the last one for the weathering. The influence of that on weathering is reduced as we consider the equilibrium case of continental freeboard.
A planet is considered habitable if d oc is within a specified range. In the lower end of the range, we used d oc > 0.5 m, an approximation for a very dry but still habitable planet (Abe et al., Reference Abe, Abe-Ouchi, Sleep and Zahnle2011). In the higher end of the range, the planet is also considered habitable if the oceans were depth enough to not cover the top of the highest possible mountains on that planet. This depth will be different for planets of different masses. More massive planets have higher gravity acceleration, shallow ocean basins, shorter mountains and an increased difficulty building a thick continental crust before suffering delamination under their own weight. For the maximum effective ocean depth, $d^{\max }_{\rm oc}$ , we used the parameterization of Cowan and Abbot (Reference Cowan and Abbot2014):


where $d^{\max }_{g}$ is the maximum continental thickness dependent on g, the planet's acceleration of gravity, ρ um is the mean density of the upper mantle, scaled for planetary mass by the mean mantle density, ρ gra is the mean continental crust density, d bas is the mean oceanic crust width, ρ bas is the mean oceanic crust density and ρ w is the water density. Values are given in Cowan and Abbot (Reference Cowan and Abbot2014). For reference, on recent Earth, the effective ocean depth is 4.0 km, and the oceans would cover the top of the mountains at an effective depth of 11.4 km.
Both of these limits are uncertain. Abe et al. (Reference Abe, Abe-Ouchi, Sleep and Zahnle2011) and Kodama et al. (Reference Kodama, Nitta, Genda, Takao, O'ishi, Abe-Ouchi and Abe2018) showed that land (dry) planets can be more resistant to runaway greenhouses than aquaplanets (water world, ocean planetand aquaplanet are not well-separated terms in the literature, but we use aquaplanet for a planet with a lot of water covering its surface, this includes the case of Earth and of a planet entirely covered by an ocean, an ocean planet). The inexistence of water in abundance may affect habitability in the long run via the inexistence of a geologic carbon cycle, a way to sink carbon from the atmosphere. A low d oc value may decrease water in the atmosphere, produce fewer clouds and rain and produce very little weathering of rocks.
For an ocean planet, completely or almost completely covered by water, the problem is that some dry land is needed to be weathered and maintain the geologic carbon cycle. As we show in the following sections, seafloor weathering can function as a planetary thermostat but is less efficient than land weathering. A huge abundance of water may facilitate the planet to enter a runaway greenhouse and be climate unstable. Also, if life originates in shallow ponds along the ocean shore, where stellar light, nutrients from rivers and the sea can accumulate and be in contact for a long time, some dry land is needed for life to emerge and oceans planets would not be a good candidate to search for life. However, if life originates in an environment of underwater fumaroles, deep into the ocean along ridges, an ocean planet would not be inherently less able of abiogenesis.
Water loss
On a planetary scale, surface water can be lost, or greatly reduced, through gaseous exchanges between the mantle and the oceans, and through photolysis of water molecules in the higher atmosphere and subsequent hydrogen scape. The former is considered here in our geophysical model (see Mello and Friaça (Reference Mello and Friaça2020) for more details), and the latter, occurring when the planet is in a runaway greenhouse state, can be considered an important marker of the end of planetary habitability.
The depth in Earth's geosphere in which volatiles can be degassed depends on the melt generation depth, d m, the depth where the mantle temperature adiabatically intersects the solidus temperature of the upper mantle. This depth may be fixed in a first approximation (Cowan and Abbot, Reference Cowan and Abbot2014), but because mantle temperature has changed during Earth's history it must have also changed. Here we used the parameterization of Hirschmann (Reference Hirschmann2000) for the solidus temperature with pressure P, and the expression of Bounama (Reference Bounama2007) via data of Mckenzie and Bickle (Reference Mckenzie and Bickle1988) for the relation with d m:


where T sol is the solidus temperature of the upper mantle in $^\circ$ C, P is the pressure in GPa and a T = −5.104, b T = 132.899, c T = 1120.661. The fit for equation (14) is valid only in the range 0–10 GPa. The melt generation depth can be derived using the approximation T sol ≈ T m. For the present Earth (T m ~ 1600 K, ρ um = 3300 kg m−3 and g = 9.8 ${\rm m \, s}^{-2}$
 ), the melt generation depth is about 50 km.
We used Ribas et al. (Reference Ribas, Guinan, Güdel and Audard2005) for the solar EUV flux in Mello and Friaça (Reference Mello and Friaça2020), but could not find a general parameterization for different stellar types. Because of this, we did not perform water loss via photolysis here. This causes the oceans to have a longer timespan than expected but considering that in all our runs for the Solar System water was completely lost after the mean surface temperature surpassed 100$^\circ$ C, the planets would, probably, already be uninhabitable before the complete loss of water.
Weathering
The functional form of the weathering regarding temperature and pCO2 sensitivity is the same as in Mello and Friaça (Reference Mello and Friaça2020), but we separated the effects for the land (W l) and seafloor (W sf) weathering, following Krissansen-Totton et al. (Reference Krissansen-Totton, Olson and Catling2018a) and Chambers (Reference Chambers2020) for the seafloor form:


where E a,l and E a,sf are activation energies with values 40 and 70 kJ mol−1 respectively, the $S_{\rm r}/S^{0}_{\rm r}$ term is the spreading rate (the rate that new seafloor area is produced at the mid-ocean ridges) normalized to the actual rate, the sf indices indicate seafloor value and 0 indices indicate modern values, a, b, c and μ have values of 0.65, 0.5, 0.33 and 0.3 respectively, f land is the continental land fraction relative to present Earth, B f is the biological enhancement of weathering and T sf is the mean temperature in the oceanic crust where seafloor weathering occurs.
The B f factor is linked to the biological productivity and accounts for the enhancement in land weathering caused by vascular plants, lichens, bryophytes and fungi during the Phanerozoic, implicating that land weathering should be less intense in prior eons or abiotic planets. More details are given in Mello and Friaça (Reference Mello and Friaça2020) but, put simply, the biological productivity is simply modelled as a parabolic function of T s, with an optimal temperature (25$^\circ$ C) for maximum productivity, and an S-shaped function of pCO2, with a zero value at the photosynthesis limit for C4 plants (0.01 mbar) and tending asymptotically to 1 for larger values of pCO2. The factor B f is normalized to 1.0 for the present biological productivity of the biotic Earth and, as biological productivity decreases, the factor B f also decreases (decreasing land weathering), until biological productivity reaches zero and B f = 0.33. This means that we choose a land-weathering enhancement factor of 3 for the present plant biosphere in relation to a barren land and an abiotic Earth. Higher values are plausible and seafloor weathering may drive CO2 levels down when land weathering is too low, but an enhancement factor too high may increase past CO2 partial pressures beyond the geochemical evidence for the case of ancient Earth. How much the weathering is increased by biotic activity is uncertain, with lower values of 1–10 (Cawley et al., Reference Cawley, Burruss and Holland1969; Sleep and Zahnle, Reference Sleep and Zahnle2001; Haqq-Misra et al., Reference Haqq-Misra, Kopparapu, Batalha, Harman and Kasting2016; Krissansen-Totton et al., Reference Krissansen-Totton, Arney and Catling2018b; Mello and Friaça, Reference Mello and Friaça2020) to higher values of 10–100 or higher (Jackson and Keller, Reference Jackson and Keller1970; Schwartzman and Volk, Reference Schwartzman and Volk1989, Reference Schwartzman and Volk1991).
In Mello and Friaça (Reference Mello and Friaça2020) the runoff term was just H2O partial pressure (pH2O), as given by the Clausius–Clapeyron equation, indicating that an increase in atmospheric water vapour would produce more clouds, precipitation, and river runoff, increasing weathering (Foley, Reference Foley2015). Here, we follow Abbot et al. (Reference Abbot, Cowan and Ciesla2012) with a new form:

Using $T^{0}_{\rm s} = 287$ K, the runoff/runoff0 goes to zero at T s = 247 K, and land weathering stops, letting all the weathering to seafloor weathering. As mentioned in Krissansen-Totton et al. (Reference Krissansen-Totton, Arney and Catling2018b), seafloor weathering is a complex process that depends on oceanic pH, local temperature, reagents abundance and others, but the temperature of the rock where the reactions take place is a key factor. Because old oceanic crust is heavily covered in sediments, limiting contact with seawater, the seafloor weathering occurs mostly on young oceanic crust, being proportional to the spreading rate $S_{\rm r}/S^{0}_{\rm r}$
 . The seafloor temperature depends on the heat flux from below and the temperature of the deep ocean above it, which is related to surface temperatures. Following Krissansen-Totton et al. (Reference Krissansen-Totton, Arney and Catling2018b), the temperature, T sf, of weatherable rock beneath the seafloor is:

where T D is the deep-ocean temperature, $q_{\rm m}/q^{0}_{\rm m}$ is the normalized heat flux, s thick is the sediment thickness through which the heat must pass and K cond is a constant of effective conductivity for the sediments. We assumed the thickness of sediments equal to the mean present value of s thick = 700 m, and the constant of effective conductivity is estimated to be K cond = 77.8 K m−1 (Krissansen-Totton et al., Reference Krissansen-Totton, Arney and Catling2018b). An empirical relationship between global mean surface temperature and deep-ocean temperature is given in Krissansen-Totton and Catling (Reference Krissansen-Totton and Catling2017) as:

This was obtained from a fit to GCM outputs from the literature and proxy data, and the max and min are so that T D will not go under 271.15 K, the freezing point of salt water, or exceed the mean surface temperature. A point of uncertainty is that the thickness of sediments may have changed in Earth's history and may change on other planets, as well as the depth of the oceans, potentially altering the relationship between global mean surface temperature and deep-ocean temperature, because shallow oceans could have warmer bottoms and deeper oceans could have colder bottoms.
The intuition behind the factor f land is that, in a partially ocean-covered planet, more land area means more area in which land weathering can occur, so planetary land weathering should have some dependency on the fraction of land area. But the strength of this dependence is uncertain. This dependence is presented in some models (Volk, Reference Volk1987; Schwartzman and Volk, Reference Schwartzman and Volk1989; Brady and Gíslason, Reference Brady and Gíslason1997; Le Hir et al., Reference Le Hir, Donnadieu, Goddéris, Pierrehumbert, Halverson, Macouin, Nédélec and Ramstein2009; Abbot et al., Reference Abbot, Cowan and Ciesla2012; Foley, Reference Foley2015; Krissansen-Totton et al., Reference Krissansen-Totton, Arney and Catling2018b) as linear, so half the land area of modern Earth should produce half the planetary land weathering (increasing pCO2), all else being equal. But the relationship may be weaker, as indicated by the model of Abbot et al. (Reference Abbot, Cowan and Ciesla2012), with a compensatory process in which more weathering would happen with less land area and less weathering with more land. Here, we explore both ends of the range, but we concentrate on the case of sensitivity to land area.
We cannot calculate pCO2 equating the normalized weathering with normalized spreading rate and isolating pCO2 following Walker et al. (Reference Walker, Hays and Kasting1981), because of the two weathering equations with a different exponent. Also, the contribution of each weathering process is not equal and must be normalized in relation to one another. Seafloor weathering is frequently modelled to contribute to 25–33% of all the weathering today (Caldeira, Reference Caldeira1995; Le Hir et al., Reference Le Hir, Ramstein, Donnadieu and Goddéris2008; Abbot et al., Reference Abbot, Cowan and Ciesla2012), but it may be even less than 10% (Krissansen-Totton et al., Reference Krissansen-Totton, Arney and Catling2018b; Kasting, Reference Kasting2019). We used the factor f W = 0.80 to indicate that 80% of the weathering today comes from land weathering. Assuming equilibria between sources (volcanism, basically spreading rate times normalized melt generation depth, the volume of crust liberating volatiles) and sinks (land and seafloor weatherings) of CO2, we solved for pCO2 in equation (20):

Stellar lifetime and luminosity
We followed Rushby et al. (Reference Rushby, Claire, Osborn and Watson2013) and Wolf et al. (Reference Wolf, Shields, Kopparapu, Haqq-Misra and Toon2017) for the total stellar main sequence lifetime:

For the luminosity of the stars in the main sequence, L *, we used the same function in Mello and Friaça (Reference Mello and Friaça2020) from parameterizations of Rushby et al. (Reference Rushby, Claire, Osborn and Watson2013), considering data of Baraffe et al. (Reference Baraffe, Chabrier, Allard and Hauschildt1998), with dependence on stellar mass, M *, and stellar age, t, but we renormalize it to have the value of one solar luminosity for one solar mass at t = 4.57 Gyr:

This function is for solar metallicity and is valid in the range of 0.0 to ~13 Gyr and 0.5–1.0 M$_{\odot }$ . For stellar masses above 1.0 M$_{\odot }$
 up to 1.6 M$_{\odot }$
 we used the same parameterization, but correcting it for ZAMS and terminal main sequence luminosities presented in Guo et al. (Reference Guo, Zhang, Chen and Han2009) from data of Tout et al. (Reference Tout, Pols, Eggleton and Han1996) and Hurley et al. (Reference Hurley, Pols and Tout2000):

Procedure
We evaluate habitability via a triad of variables: temperature, CO2 partial pressureand ocean depth (Kite and Ford, Reference Kite and Ford2018; Mello and Friaça, Reference Mello and Friaça2020). The planet is deemed habitable if its mean surface temperature is in the range of 273–373 K. These temperature limits are somewhat artificial on a planetary scale because they reflect just mean global temperatures, while temperatures on a planet may vary in function of latitude, altitude and other factors. Also, large portions of surface oceans could remain unfrozen in global mean temperatures lower than 273 K (Tajika, Reference Tajika2003; Goldblatt, Reference Goldblatt2015) even if just episodically (Wordsworth et al., Reference Wordsworth, Forget, Millour, Head, Madeleine and Charnay2013, Reference Wordsworth, Knoll, Hurowitz, Baum, Ehlmann, Head and Steakley2021). On the other limit, liquid water could be present if the atmospheric pressure is high enough, but temperature evolution would be fast after 340 K as the high atmosphere starts to be filled with water vapour, and temperatures could rapidly be beyond habitable. That said, these limits are still useful as benchmarks for global habitable conditions in a first approximation.
Habitability may also be influenced via CO2 partial pressure and ocean effective depth, but these are not as insurmountable as the temperature criterion. The pCO2 limits are given by the limits for photosynthesis in C3 (0.15 mbar) and C4 (0.01 mbar) plants (Lovelock and Whitfield, Reference Lovelock and Whitfield1982; Caldeira and Kasting, Reference Caldeira and Kasting1992). Excluding ocean or desert planets, ocean depth is deemed habitable in the range of 0.5 m to $d^{\max }_{\rm oc}$ , the maximum ocean depth before covering the highest mountains on the planet. Secular changes in ocean depth and the surface water reservoir due to geodynamics were not very big in past Earth and will probably not be in the future (Bounama et al., Reference Bounama, Franck and Bloh2001; Mello and Friaça, Reference Mello and Friaça2020).
Rocky planets may vary by many parameters (as we can realize by the great variety of bodies in the Solar System), so we could model many different types of planets, but not all of these variations might have a big impact on planetary habitability or could be measured or derived for observational methods (or easily built in our model). The main methods used to discover exoplanets are the transit and radial velocity methods, potentially giving the size and mass, respectively, of the exoplanets, which together can give their densities and a rough estimate of composition. The composition can also be inferred by spectroscopy. This may be hard for the planetary atmosphere per se, but not for its parent star, and is expected some correlation between stellar abundances for many elements and planetary composition, as in the case of silicon or magnesium (proxies for the bulk silicate mantle) (Unterborn et al., Reference Unterborn, Johnson and Panero2015; Nimmo et al., Reference Nimmo, Primack, Faber, Ramirez-Ruiz and Safarzadeh2020) or in the case of thorium, uranium and europium (for the planetary internal energy budget) (Unterborn et al., Reference Unterborn, Johnson and Panero2015; Botelho et al., Reference Botelho, Milone, Meléndez, Bedell, Spina, Asplund, dos Santos, Bean, Ramírez, Yong, Dreizler, Alves-Brito and Yana Galarza2019).
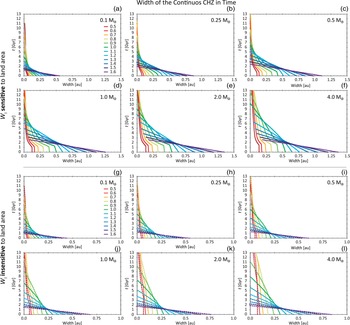
Because weathering parametrization is poorly constricted and is an important part of the silicate-weathering feedback, we also study the weathering dependence on the planetary land area (f land). We study two cases: (i) land weathering sensitive to land area, so with a linear dependence on f land as presented on equation (15), which varies from 0.003 to 1.000 (present value) and (ii) land weathering insensitive to land area, so with f land set to 1.000. These two cases are, for brevity, shortened to sensitive W l and insensitive W l, respectively.
Recalling what we said earlier, we focus only on the variation of planetary mass (thus, fixing composition, and size by the scaling law), limiting ourselves to the range of 0.1–4.0 M$_{\oplus }$ and F, G, K and M spectral types main-sequence stars with solar metallicity.
We first conduct a control or basic model run, the ‘Earth–Sun’ abiotic model, using unitary terrestrial and solar parameters (1 M$_{\oplus }$ , 1 M$_{\odot }$
 , Earth's radioactive and water content, etc.). This model is calibrated in a biotic case setting the surface albedo to a s = 0.184 to reach a surface temperature of T s = 287 K at t = 4.57 Gyr. This biotic calibration is not fundamental because, as we will see, the difference to the abiotic run is small, we calibrate to the biotic case for coherence: we know our planet has life.
The basic model is used as a comparison to variations in planetary and stellar parameters. Starting from the temperature criterion for habitability, we map the location of the CHZ in time and space, its width, and probe its sensitivity to changes in planetary and stellar masses, also trying to examine the geosphere contribution to and impact on planetary habitability.
And, finally, we compare our results for the boundaries of the CHZ with other works in the literature, trying to, without being exhaustive, include every result from a different model, in order to search for convergence of results or behaviours, and variations with time and with models improvements.
Results and discussion
Earth–Sun biotic and abiotic cases
Figures 2, 3 and 5 present the base model for the Earth–Sun system comparing them with geochemical estimates. Figure 4 presents the land W l and seafloor W sf weatherings for the cases of sensitive W l and insensitive W l to land area and biotic and abiotic base cases. The base case for geophysical variables is presented in the next section.
Evolution of Earth's surface temperature given by the model for the Earth/Sun case. The green cross (Blake et al., Reference Blake, Chang and Lepland2010) is a geochemical and sedimentary estimate for ocean water temperature (26–35$^\circ$ C) in the Archaean. The aliened numbered arrows pointing down mark evidence of glacial deposits in the past and the maximum temperature ($\sim \!25^\circ$
 C) for such to appear, see the text for more details. The red arrow (Hren et al., Reference Hren, Tice and Chamberlain2009) marks maximum ocean temperature ($\sim \!40^\circ$
 C) based on geochemical and sedimentary evidence. The pre-industrial mean temperature of 287 K is marked as a black dot outlined in white.

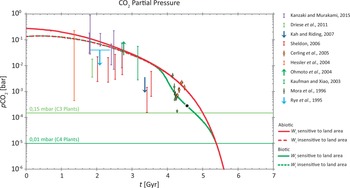
Evolution of Earth's CO2 partial pressure given by the model for the Earth/Sun case compared with geochemical estimates. Pre-industrial mean pCO2 of 280 ppm is marked as a black dot outlined in white.

Weathering rates, W i, normalized to total present biotic weathering, ${\rm W}^{0}_{total}$ , in the Earth/Sun case. Weathering is separated in the cases of sensitive W l (full lines) and insensitive W l (dashed lines) to land area, and seafloor weathering, W sf. Green lines, W biotic, are the same weatherings but with a land biosphere.

Evolution of Earth's ocean (surface) water reservoir and the effective ocean depth in our Earth/Sun model. Bars and cross indicate uncertainties of estimates of past Earth's ocean volume based on geochemical evidences (Hren et al., Reference Hren, Tice and Chamberlain2009; Pope et al., Reference Pope, Bird and Rosing2012) and model (Dong et al., Reference Dong, Fischer, Stixrude and Lithgow-Bertelloni2021). The range of Hren et al. (Reference Hren, Tice and Chamberlain2009) is the ocean mass required to satisfy their hydrogen isotope values according to Pope et al. (Reference Pope, Bird and Rosing2012). Full thick lines are for the base initial (and present) surface/mantle partition of 1.0 oceanic mass, Moc, on the surface and 2.0 oceanic masses in the mantle. The dotted lines are for variations in one more (or less) oceanic mass in the mantle recalibrating to reach 1.0 Moc today. Present values are marked as black dots outlined in white.

For surface temperatures (Fig. 2), the biotic and abiotic cases in the past held temperatures always above freezing and below ~300 K ($\sim \!25^\circ$ C), the inferred maximum temperatures from the evidence of glacial deposits in ancient Earth (numbered arrows pointing down). Those were estimated following Krissansen-Totton et al. (Reference Krissansen-Totton, Arney and Catling2018b) supposing that the existence of glacial deposits anywhere on past Earth would bound conservatively average temperatures below 25$^\circ$
 C in the same period because Antarctic glaciations started around 35 Mya when global mean temperatures fell below 20$^\circ$
 C.
CO2 partial pressures (Fig. 3) were much higher in the past, above 0.1 bar 4.5 Gyr ago in all the cases, biotic and abiotic, and for sensitive and insensitive W l.
If W l is sensitive, the small land area in the first 2 Gyr of our planet would decrease W l and promote higher levels of CO2 than in the insensitive case, which we see in Fig. 4. Consequently, W sf is much more important in the past, by a combination of higher spreading rates and deeper melt generation depth, as also reported in Charnay et al. (Reference Charnay, Le Hir, Fluteau, Forget and Catling2017) and Krissansen-Totton et al. (Reference Krissansen-Totton, Arney and Catling2018b), surpassing W l as the main weathering mechanism. Because W sf has low sensitivity to surface temperatures, this also leads to a greater CO2 partial pressure and greater surface temperatures until CO2 partial pressure becomes greater enough for W sf to compensate.
When W l is insensitive, W l and W sf have more comparable values in the past, decreasing CO2 partial pressure and surface temperatures to the point of frigid temperatures (<280 K) in the first billion years.
Going back to Figs. 2 and 3. In the biotic case, the enhancement of W l via the B f factor leads to the fall of CO2 levels for 1.5 billion years when biological productive is high, decreasing temperatures more than ~2 K in modern Earth when compared to the abiotic case. So the biota as modelled has a cooling effect on the climate. The difference could be higher if we had used a larger enhancement factor, but this can increase pCO2 in the past beyond the geochemical estimates. A solution interlinked with a limitation in the model is the use of CH4. Biogenic methane was much more abundant in the past Earth, when oxygen levels were lower, and could have risen temperatures considerably. This could have contributed to increased weathering and reduced CO2 levels even with a larger biotic enhancement factor.
Vascular plants can enhance weathering by concentrating CO2 in the soil to levels higher than in the atmosphere (Walker et al., Reference Walker, Hays and Kasting1981; Schwartzman and Volk, Reference Schwartzman and Volk1989; Kump et al., Reference Kump, Brantley and Arthur2000). If this can be done almost regardless of the atmospheric CO2 levels, W l becomes independent of pCO2 (making b ≈ 0 in equation (15)). In this case, more CO2 could be accumulated in the atmosphere before an increase in weathering (driven by high temperatures), and planets with vascular plants could be more climate stable and be habitable further away from its star (Menou, Reference Menou2015). A possible example of life exerting a feedback on its environment for climate stability.
The thickness of sediments covering the seafloor is very heterogeneous on Earth, with most of the seafloor being covered by a layer of a few dozens to hundreds of meters, but reaching many kilometres close to continental margins (Straume et al., Reference Straume, Gaina, Medvedev, Hochmuth, Gohl, Whittaker, Abdul Fattah, Doornenbal and Hopper2019). Seafloor weathering, W sf, depends more strongly on seafloor temperature, T sf, than on pCO2 (see equation (16)), and T sf depends importantly on thickness of sediments, s thick, covering the seafloor. To increase s thick is to isolate more of the seafloor from the cold deep water, increasing T sf and seafloor weathering. However, this also isolates the seafloor from seawater and CO2, which decreases seafloor weathering. These competing behaviours, and the fact that seafloor weathering occurs mostly on young oceanic crust, which is not heavily covered in sediments and is hotter because of more heat flux, make it difficult to predict the combined behaviour of seafloor weathering for different sediment thicknesses or which of the variables is the limiting factor in every situation. But is conceivable that CO2 supply could be a limiting factor if sediment thicknesses is too thick and this is not modelled here in detail.
In the model, changing s thick from the base 700 m to zero, increase surface temperatures during the beginning of the Archaean (t = 0.5 Gyr) by 10 K. If s thick is set to 350 m, the increase is about 5 K. If s thick is increased to 1050 m, surface temperatures drop by 5 K, and if s thick is increased to 1400 m, surface temperatures drop by 20 K. The effect is more intense in the past, when there is a lot of CO2 in the atmosphere, continents are small (W sf dominates over W l) and the Sun was dimmer. Today, the difference between the five scenarios is barely noticeable. This large drop in surface temperatures for thicker sediment covers may not be realistic thought, as CO2 would be more heavenly limited on the seafloor and W sf would be less efficient.
A derivable general consequence could be that planets with thinner sediment covers on the seafloor probably have a less intense seafloor weathering (if deep oceans are cold), higher pCO2 and surface temperatures. Since part of the sediments has a biological origin, life could also have some power over seafloor weathering. And, as part of the sediments come from runoff from continents, aquaplanets with very small continents could have low deposition of sediments on the seafloor, weaker seafloor weatherings and higher surface temperatures. Because the seafloor weathering is a complex process that depends on many parameters and the strength of weathering, in general, is poorly known (and we do not model the CO2 limitation for weathering when increasing s thick), the magnitude and dependency of these results can be smaller than we derived here and should be seen as just exploratory.
As the planet gets old and spreading rates fall, pCO2 also falls in the atmosphere, the C3 limit will be reached in about 190 Myr in the biotic case, and the C4 limit will be reached in about 810 Myr. The reduced CO2 levels may impact or hinder the existence of some photosynthetic life forms and an oxygen-rich atmosphere, also affecting especially eukaryotes. This result is in line with other estimates of future CO2 levels (Lovelock and Whitfield, Reference Lovelock and Whitfield1982; Caldeira and Kasting, Reference Caldeira and Kasting1992; Franck et al., Reference Franck, Kossacki and Bounama1999, Reference Franck, Block, Von Bloh, Bounama, Schellnhuber and Svirezhev2000b; Lenton and von Bloh, Reference Lenton and von Bloh2001), but it is a little shorter from the 1.08 ± 0.14 Gyr life span of Earth's oxygenated atmosphere by Ozaki and Reinhard (Reference Ozaki and Reinhard2021). Following up, temperatures will surpass 100$^\circ$ C at 117% of the present solar flux, in about 1.66 Gyr (at an age of 6.23 Gyr), when Earth will then enter a runaway greenhouse and loses its water. Other works in the literature reached similar results (Caldeira and Kasting, Reference Caldeira and Kasting1992; Kasting et al., Reference Kasting, Whitmire and Reynolds1993; Franck et al., Reference Franck, Kossacki and Bounama1999) but some encountered values differing even more than a billion years from our result (Schwartzman, Reference Schwartzman1999; Abe et al., Reference Abe, Abe-Ouchi, Sleep and Zahnle2011; Kopparapu et al., Reference Kopparapu, Ramirez, Kasting, Eymet, Robinson, Mahadevan, Terrien, Domagal-Goldman, Meadows and Deshpande2013; O'Malley-James et al., Reference O'Malley-James, Greaves, Raven and Cockell2013). (see Mello and Friaça, (Reference Mello and Friaça2020) for a comparison)
The maximum stable stellar flux Earth can receive before its climate become unstable and it enters a moist or runaway greenhouse is uncertain. For a fully water-saturated atmosphere in 1D models, the limit is around 102% (moist greenhouse) to 106% (runaway greenhouse) (Kopparapu et al., Reference Kopparapu, Ramirez, Kasting, Eymet, Robinson, Mahadevan, Terrien, Domagal-Goldman, Meadows and Deshpande2013), very close to the present flux. It can be extended up to 121% in GCMs (Leconte et al., Reference Leconte, Forget, Charnay, Wordsworth and Pottier2013; Wolf and Toon, Reference Wolf and Toon2015), and can reach 135% for aquaplanets, and 180% for land planets in the GCMs of Abe et al. (Reference Abe, Abe-Ouchi, Sleep and Zahnle2011) and Kodama et al. (Reference Kodama, Nitta, Genda, Takao, O'ishi, Abe-Ouchi and Abe2018). Our result of 117% on an aquaplanet is on the conservative side.
In Fig. 5, for the base surface/mantle partition of 1 : 2 oceanic masses, oceans reach a peak of 1.6 oceanic masses at around age 1.4 Gyr, from changes in gaseous exchanges with the mantle, but only later, at 2.3 Gyr, that the oceans reach the maximum effective ocean depth of d m = 5 km. This is because ocean depth in the model depends on the quantity of water on the surface (oceanic masses) and the area and depth of ocean basins. Initially, effective ocean depth increases because water is being degassed more than regassed by the mantle, and a little later, effective ocean depth also increases because continents are growing and the continental growth makes continents occupy more planetary surface, and the continental freeboard constraint in the model force the deepening of ocean basins in the process. In the future, oceans will decrease in volume and effective depth as degassing decreases and continental growth stops (in our model) but not to the point of affecting habitability by much. If continents continue to grow, effective depth may not decrease so much as shown here.
The mass of water in the mantle today is poorly constrained, with estimates varying more than one order of magnitude (Cowan and Abbot, Reference Cowan and Abbot2014). The present reservoir of water in the mantle can be lower than the maximum water storage capacity of the mantle, as there is exchange of water between the mantle and the surface. Dong et al. (Reference Dong, Fischer, Stixrude and Lithgow-Bertelloni2021) showed that the mantle water storage capacity decreases with mantle potential temperature. Because mantle potential temperature is estimated to be higher in the past (as also in our model), if the mantle today holds more water than its capacity in the Archaean, the past surface should have accumulated the excess water. For two ocean masses in the mantle today (what we used in our model), Dong et al. (Reference Dong, Fischer, Stixrude and Lithgow-Bertelloni2021) estimate that the surface should hold $2.27^{ + 0.20}_{-0.96}$ oceanic masses in the Archaean, compatible with our result in Fig. 5.
For more massive planets or with a higher abundance of radioactive isotopes, so with higher internal mantle temperatures, this may be important, because it indicates that the oceans would be deeper and land area rarer. But as mantle volumes (and so storage capacity) would also be bigger in massive planets, it could depend more on how water-rich the planet is.
Keeping the same calibration, increasing the water reservoir in the mantle from 2.0 to 3.0 oceanic masses increases degassing in the past and we end up today with oceans 20% more massive, and decreasing it from 2.0 to 1.0 oceanic mass decreases degassing in the past and we end up today with oceans 25% less massive. If we recalibrate to obtain a surface reservoir of 1.0 oceanic mass today, we obtain the dotted lines in Fig. 5. Considering all three estimates for Archaean oceans volume (Hren et al., Reference Hren, Tice and Chamberlain2009; Pope et al., Reference Pope, Bird and Rosing2012; Dong et al., Reference Dong, Fischer, Stixrude and Lithgow-Bertelloni2021), the range from 1.0 to 2.0 oceanic masses in the mantle today seems to be the most compatible. But we are not very confident in this result because our mantle's viscosity does not contain any dependency on water content and this could partially influence mantle flux and degassing.
In general, for our purposes, our base model for the Earth–Sun system seems to fit reasonably well with the scant data available about the past of our planet. Nonetheless, the first half billion years in our planet's history, the Hadean, were marked by violent events, from the impact and formation of the Moon, the ocean of magma, to the initial and the late heavy bombardment. These events are not modelled here and they may have influenced considerably the initial habitability of our planet, with impacts heating the crust temporarily (Zahnle et al., Reference Zahnle, Arndt, Cockell, Halliday, Nisbet, Selsis and Sleep2007) or cooling the atmosphere by weathering of impact ejecta (Kadoya et al., Reference Kadoya, Krissansen-Totton and Catling2020). So our results for the first billion years should be seen with less confidence. If the initial history of our planet can be generalized for the formation of other terrestrial planets, this concern should be kept in mind for the other planetary masses modelled in the following sections.
Varying planetary mass
Having a base model (green lines in the following figures) we can compare results for different planetary masses, keeping the Sun as the parent star. Varying planetary mass (Fig. 6) has a considerable effect on CO2 partial pressure and a smaller, but more important, effect on surface temperature in both cases of W l sensitive and W l insensitive to land area. The 0.1 M$_{\oplus }$ planet is the less habitable one, presenting the lowest initial temperatures, spending substantial time, ~3.7 Gyr, below the 273 K limit at 1.0 au, also experiencing the fastest drop in pCO2, from a maximum of less than 0.1 bar, reaching the C3 and C4 limits in just a billion years. One-Earth-mass planet and more massive ones start with pCO2 just short of 0.3 bar, with small differences between them, and are the more capable ones of maintaining pCO2 above the C3 and C4 limits for long periods.
Habitability results for 0.1, 0.25, 0.5, 1.0, 2.0 and 4.0 M$_{\oplus }$ planets at 1 au from the Sun. Full lines are for sensitive W l, and dashed lines are for insensitive W l. Oceans’ results presented no difference for sensitive or insensitive W l. Oceanic masses were normalized to the planet mass for a compact visualization, so the 0.1 M$_{\oplus }$
 planet has an initial surface ocean of 1.4 × 10²⁰ kg, the 1.0 M$_{\oplus }$
 has 1.4 × 10²¹ kg and the 4.0 M$_{\oplus }$
 has 5.6 × 10²¹ kg, but all start at 1.0.

As before, W l sensitivity to land area permits higher levels of CO2 when continents are small. Insensitiveness to land area generally amplifies the differences in temperature and pCO2 levels between masses. With sensitive W l, the initial temperature for all masses, besides the 0.1 M$_{\oplus }$ , is a warm ~285 K, and fairly warm temperatures are maintained for Earth and above one-Earth-mass for 5 Gyr. In the case of insensitive W l, temperatures are fairly colder below one-Earth-mass.
In all cases, no matter the weathering sensitivity, after ~5.0 Gyr, all curves of mean surface temperature converge. Because of increasing solar luminosity and low pCO2, this is when the temperature behaviour is driven very little by CO2 (decaying fast) and increasingly more by H2O, taking the atmosphere, in a feedback loop, directing the planet into a runaway greenhouse.
Planetary mass can also influence weathering in other ways apart from degassing rates. A more massive planet is also bigger, has a large radius and has a bigger area. We do not know if this would be translated necessarily to larger continents in all real cases, but it is what we considered in our model. So, considering sensitive W l, a more massive planet has more reaction area to consume its atmospheric CO2 via land weathering. The less massive planets have comparatively less land area for land weathering to act and would be able to retain higher levels of atmospheric CO2 than expected for its thermal evolution alone.
This compensates in part for lower internal temperature and degassing rates in low-mass planets. But a complication not included here is that the higher gravity of more massive planets would limit the range of its relief, having shallow seas and short mountains, while a less massive planet could produce deep seas and tall mountains more easily. This difference in terrain verticality may contribute to increasing the area of weathering in less massive planets and decreasing it in more massive planets.
Overall, in our model, internal evolution plays a bigger role in the long run and more massive planets are able to maintain higher levels of CO2 than a lower mass planet, because of higher rates of degassing.
Degassing behaviour is driven by the melt generation volume S r × d m. Higher seafloor spreading rates S r produce higher heat fluxes, and higher mantle temperatures produce higher melt generation depths d m. More massive planets have the highest seafloor spreading rates (Fig. 7(e)) and mantle potential temperatures (Fig. 7(b)), but also have a higher acceleration of gravity, which decreases the melt generation depths (Fig. 7(i)). The combined effect is still a higher melt generation volume for more massive planets but the advantage is small. The biggest difference is in longevity. Because d m goes to zero for potential temperatures below 1100$^\circ$ C, degassing in less massive planets will stop much sooner than for more massive planets.
Geodynamic results for the 0.1, 0.25, 0.5, 1.0, 2.0 and 4.0 M$_{\oplus }$ planets at 1 au from the Sun. Mantle results presented no difference for sensitive or insensitive W l and changes in surface oceanic masses because the geodynamics of the mantle is, in our model, insensitive to them.

Water degassing happens more intensively for lower planetary masses during the first 2 billion years (Fig. 6(c)) and effective ocean depths keep increasing for less massive planets than Earth. Our parameterization for water exchange is an approximate equilibrium between water being degassed (going out of the mantle) and regassing (going into the mantle). Besides other factors, degassing depends on how much water there is in the mantle (mass of water by mantle volume) and the efficiency with which water can be expelled out of the mantle, which depends on the inverse of pressure over degassing regions (more pressure, less degassing), this pressure comes from the water column above it, so a higher effective ocean depth creates higher pressure. Besides other factors, regassing depends on the pressure on regassing regions (more pressure, more regassing).
A low-mass planet is also a small planet. Because volume goes with r 3, its volume decreases proportionally faster than its mass, and the density of water per volume in the mantle increases when compared with the Earth model (considering the same water content). A less massive planet also has lower gravity and the pressure along (de)regassing regions becomes smaller too. The melt generation depth increases in less massive planets and degassing can occur from deep in the mantle. This leads to an imbalance favouring degassing. This goes on until the density of water in the mantle drops substantially and, with more water on the surface and deeper oceans, the pressure increases. On higher planetary masses, the process is the opposite.
The behaviour in ocean depth is a reflex of the above, with low-mass planets being able to create deep ocean basins and deep oceans (Fig. 6(d)). Continents occupy space on the planetary surface and decrease space for ocean basins, which, under our assumption of continental freeboard, must deepen to accommodate the same volume of water as before. Even then, the ocean's effective depths remained in the habitable range for all planetary masses.
Regarding the mantle (Fig. 7), the differences between masses are clearer. Most masses have an initial heating period, causing an initial increase in the mantle potential temperature, and this period is longer as massive as the planet is. The two lower masses are since the beginning net losing heat, being the first to tend asymptotically to zero in the rate of change in mantle temperature (Fig. 7(c)). The lowest-mass planet also reaches much earlier the same levels of spreading rate and mantle viscosity as the basic model reaches only now (4.57 Gyr). This slows down gaseous exchange between the mantle and the surface, possibly hindering feedback mechanisms for habitability, like the geologic carbon cycle. On higher-mass planets, lower viscosity facilitates convection and heat transport.
Overall, the lower-mass planets cool down faster than the more massive ones, which slows down gaseous exchange earlier, maintaining geologic activity for less time. Concerning habitability, the difference is more striking below Earth's mass than above it. The 0.5 M$_{\oplus }$ planet may mark the threshold for maintaining enduring habitability and less massive planets could have difficulty maintaining habitability by geophysical means for many billions of years. Considering the search for habitable exoplanets, this could be partially bypassed in small planets focusing on young planets (meaning also young parent stars), when mantle temperature, heat flux, CO2 partial pressure and gaseous exchange can all still be high.
The hotter interiors of massive planets may present some complicated perturbations to habitability. A hotter mantle decreases the temperature gradient for convective transport of energy from the core (Nimmo et al., Reference Nimmo, Primack, Faber, Ramirez-Ruiz and Safarzadeh2020), one of the three requirements for the existence of a strong magnetic field by a dynamo effect, so reducing dynamo activity and potentially the strength of the planetary magnetic field. A colder mantle may present the reverse effect. As both – high geological activity for many billion years with plate tectonics and an intense dynamo effect for a planetary magnetic field – are desirable to habitability, intermediate masses may present better results.
CHZ in time
We can run the model at different distances (different stellar fluxes) to the Sun to examine not just at which times the planet is habitable but also at what distances, delimiting the CHZ. First, we do this just for the base abiotic model. In Fig. 8, the left panels (a, c, e) are the boundaries of the CHZ for a 1 M$_{\oplus }$ planet discriminated between the regions with (i) habitable temperatures (0–100$^\circ$
 C) and CO2 partial pressure above the C4 limit (dark green); and regions with (ii) habitable temperatures but CO2 partial pressure below the C4 limit (light green). The white dashed lines are the case for insensitive W l. The right panels (b, d, f) show the width of the CHZ for habitable temperatures. In light blue is the width of the continuous CHZ, the size of the region continually habitable since the beginning, not allowing for ‘cold start’ planets (planets that start outside the outer edge of the CHZ but can come inside of it as the CHZ can move outwards with time). Full lines are for sensitive W l and dashed lines are for the insensitive case. The abiotic Earth model is shown in the first row (a, b) of panels, and two special cases are shown in the rows below.
Boundaries of the CHZ over time for a 1 M$_{\oplus }$ planet in the Solar System. The left panels are for the CHZ with habitable temperatures. Dark greens are habitable regions with pCO2 above the C4 limit, light greens are habitable regions with pCO2 below the C4 limit. The white dashed lines mark the CHZ outer edge in the case of W l insensitive to land area. The right panels are for the width of the CHZ for habitable temperatures. Full lines are for sensitive W l, and dashed lines are for the insensitive case. Light blue lines are for the continuous CHZ. The first row (a, b) is for the complete model, the second row (c, d) is for fixing the mantle potential temperature at $T_{\rm m} = 1331^\circ$
 C (the present temperature given by our model), and the bottom row (e, f) is for fixing Sun's luminosity at the present value.

Solar flux has a big effect on determining terrestrial surface temperatures, but atmospheric CO2 and H2O do the fine balancing. In our model, the weathering equations drive the surface part of the geological carbon cycle. At the outer edge, where the solar flux is low, temperatures are low and there is less evaporation, so less rain and weathering, driving less CO2 out of the atmosphere and facilitating the maintenance of a higher CO2 partial pressure, which increases temperatures until equilibrium is reached. At the inner edge, where the solar flux is high, temperatures are high, which evaporates more water, which increases raining, weathering and chemical reactions, driving CO2 out of the atmosphere and carbon to the oceans. With less CO2 in the atmosphere, the temperatures drop until equilibrium is reached. Inside the CHZ you have intermediate cases between the two, but this only has a relevant effect when there is already enough CO2 in the atmosphere to be driven out or enough geological activity to drive it in. Too close to the Sun and the CO2 partial pressure may be too low to be relevant for temperature control.
In our model, we suppose sources (degassing through the spreading rate areas on the ocean floor) and sinks (weathering) of CO2 to maintain equilibria, besides also a large surface liquid water ocean. In the absence of any of the three, the model is not applicable. Probably this is the case considering the recent state of Venus and Mars, where, in the absence of important carbon sinks, even small sources of CO2 may lead to its accumulation in the atmosphere. As we are more interested in the habitable regime, when all three are acting, this might not be a cause for much concern.
By the first row (a, b) of panels of Fig. 8, Earth's orbit was always inside the CHZ, as surface temperatures always remained above 273 K, even in the case of insensitive W l, which produces lower levels of CO2 in the past. The CHZ width, with present width of ~0.16 au, was much wider in the past, reaching ~0.3 au for the insensitive case, and ~0.55 au for the sensitive case. The continuous CHZ only decreases in size and no region can be permanently habitable for more than 7.8 Gyr. As Earth is expected to have a total life span of approximately 6.2 Gyr, the best location to maximize habitability longevity would be in a higher orbit, at around 1.08 au in the case of sensitive W l.
The region with enough CO2 for C4 plants also gets thinner with time, until vanishing completely at around 6.5 Gyr. This is a combination of increasing solar luminosity and decreasing geological activity. Also, compared with Fig. 7(i), 6.5 Gyr is when the melt generation depth goes to zero for a planet of one-Earth-mass. We broke this behaviour into two components in the two bottom rows of panels to analyse the role of geodynamics alone in habitability.
In the second row (c, d), we fixed the potential temperature of the mantle at $T_{\rm m} = 1331^\circ$ C, the temperature given by our model now, at t = 4.57 Gyr, so effectively ‘freezing’ all the geodynamics to the present state. Notice that the habitable region below the C4 limit (light green) has no change in width in time and that the displacement away from the Sun is a result of increasing solar luminosity, and that the subtle increasing width of the CHZ is more easily seen (panel d).
In this case, Earth spent most of its first 2–3 billion years uninhabitable, beyond the CHZ outer edge and below 273 K. This indicates that present geodynamics would struggle to sustain an atmosphere sufficiently rich in CO2 to maintain temperatures above freezing during the Hadean and early Archaean.
On the bottom row (e, f), we fixed solar luminosity to the present value. In this case, the changes in time are all due to changing geodynamics. The inner edge of the CHZ is unchanged in time because the runaway greenhouse is dependent mostly on the behaviour of water and the value of solar flux. The outer edge is considerably extended in the first billions of years in comparison to the base model (panel a) because solar luminosity is the present one. The (mostly) receding outer edge with time is an effect of the insufficient build-up of CO2 in the atmosphere. The outer edge is farther away when the planet is young and has a high internal temperature, surface heat flux, seafloor spreading rate and more intense gaseous exchanges between mantle and surface, in general, more geodynamic vigour, which is what permits it to pump more CO2 into the atmosphere. As the planet gets older, it gets colder internally, also having a lower quantity of radioactive isotopes, the heat flux and the spreading rate decrease, and the gaseous exchanges weaken, making it harder and harder to maintain high levels of CO2 partial pressure in the atmosphere. This impacts the location of the outer edge, but also in the location of the C4 inner limit because shallow oceans (small d m) decrease degassing, making it easier to drive CO2 out the atmosphere via weathering at increasingly lower thresholds of temperatures. At the right side of the outer edge in the diagrams, the temperature is below 273 K, but pCO2 is above the C4 limit (0.01 mbar), at least initially, while the melt generational volume is not zero.
In general, solar evolution's contribution to the location of the CHZ is mostly due to increasing solar luminosity, moving the CHZ away, and widening it a bit. But geodynamics plays a bigger role in shaping the width of the CHZ, which is much larger on the younger planet, decreasing in size with time.
CHZ and planetary mass
As shown in Figs. 6 and 7, varying planetary mass has a considerable impact on the geodynamics of the planet and on its habitability in time and space. In Fig. 9, we can see this effect in the boundaries of the CHZ.
CHZ over time for planets of different masses in the Solar System. For every mass, the left panels (a, c, e, g, i and k) are for the CHZ with habitable temperatures. Dark greens are habitable regions with pCO2 above the C4 limit, light greens are habitable regions with pCO2 below the C4 limit. The white lines and the semi-transparent green regions of the two higher mass planets mark the CHZ outer edge in the case of insensitive W l. The right panels (b, d, f, h, j and l) are for the width of the CHZ for habitable temperatures. Full lines are for sensitive W l, and dashed lines are for the insensitive W l. Light blue lines are for the continuous CHZ.

The inner edge of the CHZ is the same for all six planetary masses considered, but the outer edge is further away as more massive the planet is. This is a consequence of higher internal temperature, surface heat flux and seafloor spreading rate, permitting an equilibrium with higher levels of CO2 in the atmosphere. This has been pointed out before (Kite et al., Reference Kite, Manga and Gaidos2009; Abbot, Reference Abbot2016), and Kopparapu et al. (Reference Kopparapu, Ramirez, SchottelKotte, Kasting, Domagal-Goldman and Eymet2014) have derived that massive terrestrial planets could have wider habitable zones than less massive ones. Nonetheless, in Kopparapu et al. (Reference Kopparapu, Ramirez, SchottelKotte, Kasting, Domagal-Goldman and Eymet2014), the CHZ would expand via the inner edge, and the outer edge would vary very little because of a contra-balance of more CO2 also increasing planetary albedo. A possible explanation for the disagreement may be that our albedo does change in function of pCO2 levels in the atmosphere, but CO2 is much more limited by degassing and geodynamics in our model in lower-mass planets, making for a shorter CHZ far from the limit presented in Kopparapu et al. (Reference Kopparapu, Ramirez, SchottelKotte, Kasting, Domagal-Goldman and Eymet2014) with higher levels of CO2, also we did not scale background atmospheric pressure via planetary mass. A more embracing model, involving both features, could shed some light on this.
Focusing on the end behaviour, all masses except the 4.0 M$_{\oplus }$ one end up in a stage with the same CHZ shape and with the same width. What happens is that right after the fall of pCO2 below the C4 limit, d m goes to zero (compare the superior boundary of the dark green regions in Fig. 9 with where the curves go to zero in Fig. 7(i)) and the geological carbon cycle is broken, because only the regassing part, via weathering, stays functional.
Sparse volcanism could still pump some CO2 into the atmosphere, so the drop would not be as severe and sharp as depicted here, also a frozen planet could accumulate CO2 over long periods, when weathering is low, or if it lacks abundant liquid water for weathering. But the geologic carbon cycle as it is generally modelled would be greatly reduced in effectiveness as a climate thermostat, the geosphere would lose influence over habitability and the CHZ would be almost uniquely dictated by solar evolution. This would be the last stage in planetary habitability, coming earlier as less massive the planet is, and after 11 Gyr only the 4.0 M$_{\oplus }$ has not reached it.
Because the CHZ is changing in width and position with time, some planets could enter and exit the CHZ even twice in the simulated time. For example, a planet close to the outer edge would start inside the CHZ, exit through the outer edge as seafloor spreading rates and mantle temperatures drop, but then it would re-enter the CHZ by the outer edge as the Sun evolves and becomes more luminous, finally exiting the CHZ again for the last time by the inner edge. This initial habitable lobe away from the star is an effect of an initial hotter and active mantle and of reduced W l by smaller continents, but also from initial warming of the mantle in planetary masses above 0.25 M$_{\oplus }$ (see Fig. 7(b)), as the behaviour of mantle temperature is reflected on the convective flux and seafloor spreading rate.
For the two more massive planets, the CHZ after 2 Gyr is wider for the case of insensitive W l, not for the sensitive W l. This occurs because land area is larger on those planets and more weathering can occur, restricting how much CO2 can accumulate in the atmosphere. If there is no sensitivity to land area, the W l is less intense (equal to the one-Earth-mass planet, because of our parameterization) and more CO2 accumulates, because a higher mass planet will be more geologically active. The inverse happens on low-mass planets, as they have smaller continents, so the sensitive case should produce the larger CHZ later in their evolution. But this is not observed, there is no difference between the two cases. This is because the less massive planets cool too fast and there is no opportunity to see this difference.
In general, the effects of planetary mass and geodynamics on the CHZ seem very relevant, with more massive planets having a much wider and long-lived CHZ than less massive ones and the continuous CHZ more than doubling from the 0.1 M$_{\oplus }$ to the 4.0 M$_{\oplus }$
 planet. The outer edge also seems very dependent on planetary mass and age. A further predicament not studied here, for less massive planets, as they cool faster, is that they should also have a shorter-lived strong magnetic field, with a higher chance of suffering from atmospheric erosion via stellar winds after some billion years, maybe in a timescale even shorter than the habitability timescale derived here for them.
Because Venus is similar to Earth in size, mass, bulk composition and proximal location in the Solar System, if Venus were indeed habitable in the past, the specific process by which it became uninhabitable would be of great interest in planetary habitability, the future of our planet, and in characterizing Earth-like exoplanets, showing similar planets following different evolutionary paths (Kane et al., Reference Kane, Kopparapu and Domagal-Goldman2014) or, in another possibility, being separated by just time.
It is generally assumed that a runaway greenhouse initiated by high solar flux is responsible for Venus’ present hellish state. This could have been primordial, and Venus was never habitable, or it happened later, and the planet had an initial habitable period. On the positive side, some 3D models (Way et al., Reference Way, Del Genio, Kiang, Sohl, Grinspoon, Aleinov, Kelley and Clune2016; Way and Del Genio, Reference Way and Del Genio2020) have been shown to be able to maintain clement temperatures in young Venus via a combination of water cloud feedbacks and slow rotation effects. And isotopic abundances of hydrogen and deuterium (Donahue, Reference Donahue1999; Kulikov et al., Reference Kulikov, Lammer, Lichtenegger, Terada, Ribas, Kolb, Langmayr, Lundin, Guinan and Barabash2006) in Venus's atmosphere indicate considerable water reservoirs in the past. On the negative side, the water may have contributed greatly to heating the planet and may not have been able to condense in any oceans (Turbet et al., Reference Turbet, Bolmont, Chaverot, Ehrenreich, Leconte and Marcq2021), making the planet uninhabitable from the start.
In a different direction, Way and Del Genio (Reference Way and Del Genio2020) speculated that the hellish present Venus’ state could be due to simultaneous large igneous provinces (LIPs) suddenly liberating large quantities of CO2 and driving the planet into an extremely moist or runaway greenhouse. LIPs are episodic in nature, with their record dating back to billions of years, but their frequency is uncertain due to incomplete data (Ernst et al., Reference Ernst, Bond, Zhang, Buchan, Grasby, Youbi, El Bilali, Bekker and Doucet2021). They are associated with global environmental and biological changes on Earth, including mass extinctions. Simultaneous LIPs could be frequent enough on a billion-year scale to be a concern for habitability in terrestrial planets in general (Way et al., Reference Way, Ernst and Scargle2021, Reference Way, Ernst and Scargle2022).
In the case of LIPs happening randomly, there would be a constant threat of coincident events wrecking planetary habitability. Mantle plumes and plate tectonics are popular hypotheses for the origin of LIPs, and, as those are sensible to planetary internal temperature, which changes with age, LIPs could change in frequency with planetary age. Their frequency could also depend on planetary mass and radioactive isotope content, as those can change planetary internal temperatures. In this case, some ages and types of planets could be less or more susceptible to such events and face more or fewer risks. In any case, the geosphere could have a larger impact on habitability than previously considered.
In our 1.0 M$_{\oplus }$ planet, pCO2 is low on a planet closer to its star as Venus at 0.72 au, but modern Venus does not present plate tectonics and water weathering (Lewis and Grinspoon, Reference Lewis and Grinspoon1990; Nimmo and McKenzie, Reference Nimmo and McKenzie1998), so there is no mechanism, or very low capacity, to take CO2 out of the atmosphere, and it accumulates over time.
Our CHZ does not reach Venus orbit during the ZAMS but goes more than two-thirds of the way from Earth to Venus orbit. The effective albedo in our model includes surface and some cloud albedo, being rather low (for a global albedo, and rather high for a surface albedo). A higher albedo from cloud covering could help maintain temperatures down and bridge the remaining distance gap.
In the case of Mars, it is too small to maintain geodynamic vigour for long periods, but the absence of sinks for CO2 permits its accumulation in the atmosphere from small sources. The lack of a strong magnetic field and its small gravity permits more easily than Earth the loss of heavier molecules, like O2, CO2 and N2, contributing to thinning its whole atmosphere.
The conditions could have been better in the past, with geomorphological evidence (Craddock and Howard, Reference Craddock and Howard2002; Baker, Reference Baker2006; Di Achille and Hynek, Reference Di Achille and Hynek2010) indicating that considerable reservoirs of water modified its surface and were lost, and chemical evidence of the D/H ratio indicating a vast hydrogen escape (Mahaffy et al., Reference Mahaffy, Webster, Stern, Brunner, Atreya, Conrad, Domagal-Goldman, Eigenbrode, Flesch and Christensen2015). A cocktail of different greenhouse gases and other phenomena could have been able to warm the early Martian atmosphere (Franck et al., Reference Franck, Bounama and von Bloh2004; Pierrehumbert and Gaidos, Reference Pierrehumbert and Gaidos2011; Wordsworth and Pierrehumbert, Reference Wordsworth and Pierrehumbert2013; Ramirez et al., Reference Ramirez, Kopparapu, Zugger, Robinson, Freedman and Kasting2014; Ramirez and Kaltenegger, Reference Ramirez and Kaltenegger2017). Especially, a dense atmosphere of H2 and CO, not of just H2O and CO2, could have warmed early Mars before the loss of the H2 and of water (Pahlevan et al., Reference Pahlevan, Schaefer, Elkins-Tanton, Desch and Buseck2022).
Even then, this could not have been enough, and liquid running water could have been only episodic, with Mars being still fairly cold (mean annual temperatures below 240 K), so out of the classical CHZ in a stable way, with only episodic surface liquid water early in its history, later transitioning to the now know dry and more oxidized conditions (Wordsworth et al., Reference Wordsworth, Forget, Millour, Head, Madeleine and Charnay2013, Reference Wordsworth, Knoll, Hurowitz, Baum, Ehlmann, Head and Steakley2021; Wordsworth, Reference Wordsworth2016).
In our model, the 0.1 M$_{\oplus }$ planet never reaches even 0.1 bar of CO2 at any point of its evolution at 1.52 au, being severely limited by its geodynamics, and has a too narrow CHZ and too low temperatures (~200 K) during its first billion years to be easily viable. At so low temperatures, the oceans could freeze and the weathering drop even lower, permitting an increased accumulation of CO2 in the atmosphere. But this could be episodic or cyclic, and the geologic carbon cycle would still be broken and the planet out of the classical CHZ.
As it is, our model fails to account for the possible past habitability of Venus or Mars, probably because a simple 0D model of effective planetary annual temperatures may not be the best model to probe climatic subtleties, episodic periods of habitability or cloud effects. Also, other greenhouse gases besides CO2 and H2O could have contributed to warm planets close to the edges of the classical CHZ. However, our results of uninhabitability of past Venus and Mars are in line with the results of Turbet et al. (Reference Turbet, Bolmont, Chaverot, Ehrenreich, Leconte and Marcq2021) for a never habitable Venus and of Wordsworth (Reference Wordsworth2016) and Wordsworth et al. (Reference Wordsworth, Knoll, Hurowitz, Baum, Ehlmann, Head and Steakley2021) for only episodic current water in past Mars.
An important general result ended being that the derived boundaries for the CHZ point to a highly dynamic behaviour in time and space, and planetary habitability would depend both on stellar properties and, especially, planetary geodynamics.
CHZ in the present Solar System
Since past habitability in the Solar System may be uncertain besides Earth, the present boundaries for the CHZ may be more easily studied, and comparing the different boundaries presented in the literature may give us some information about progress or convergence in the models.
Figure 10 compares most of the works presenting the CHZ for the present Solar System. It is frequent the investigation of habitability for more than just Earth or a planet very like Earth in base parameters (mass, radius, water content, atmospheric composition, atmospheric pressure, etc.), extending the investigation for a wider volume in the space of planetary and atmospheric parameters. We represented this via colour. The green bars are the CHZ for the most Earth-like run in that specific work (so the CHZ would be at least as wide as the green bars), orange and blue bars are extensions of the CHZ when exploring a different combination of planetary parameters, modelling planets possibly rather different than Earth. Some works do estimate the extreme minimum or maximum boundaries for the CHZ, so studying extreme conditions. These cases are indicated by thin bars and green arrows.
Comparison of the CHZ for the present Solar System to previous works. The green bars are for the Earth case or Earth-like cases, planets very close to Earth in the space of parameters (same mass, radius, atmospheric pressure, atmospheric composition, water content, etc.). Orange and blue bars are extensions of the classical CHZ considering other planetary and atmospheric parameters. Dark orange or dark blue bars with arrows indicate the minimum and maximum boundaries in extreme cases, respectively.

The models, selected parameters and methodology vary considerably from one work to another and we recommend checking them individually for more in-depth details. Some of these differences could invalidate comparison (as we are not comparing the same thing), but they all present an attempt to derive the boundaries of planetary habitability, a habitable zone, so they seem comparable in our judgement. Also, if rather different models and approaches converge to the same or close results and conclusions, their results could be considered more robust.
Fortunately, in all works, Earth's orbit is inside all the CHZ for Earth or Earth-like planets, generally closer to the inner edge.
In Fig. 10, our CHZ is one of the narrowest considering only the result for a 1.0 M$_{\oplus }$ planet. The inner edge at 0.92 au is not so different from other works; the difference is larger in relation to our 1.09 au outer edge. In our model, geodynamics seems to heavily limit maximum CO2 levels in the atmosphere and would be hard to achieve in normal circumstances many bars of CO2 in the atmosphere even far away from the Sun, limiting the width of the CHZ more strongly than in other works. Increasing planetary mass increases internal temperature, heat flux and seafloor spreading rate, maintaining more intense geological activity for more time, which is, in the case of the 4.0 M$_{\oplus }$
 planet, what extends the present CHZ to 1.24 au (for sensitive W l), and 1.36 au (for insensitive W l).
The CHZ of Hart (Reference Hart1978) is the narrowest one, barely containing Earth's orbit. His model is very unstable, easily leading to runaway greenhouses or glaciations. The problem seems to be that it lacks a negative feedback for climate stability (in general, weathering, as in our model), so the conditions should need to be very right to allow for habitability in Earth's orbit. He uses a continuously circumstellar habitable zone (CCHZ), not a CHZ, making for a more strong case of habitability which will produce narrow habitable spaces. But his model is unstable enough that the difference to the CHZ might be small. It is because of that that we included it in the comparison.
The models seem to vary considerably in the size of the CHZ and do not converge over time to the same boundaries. However, an interesting result is that the inner edge of the CHZ is better defined than the outer edge. Counting only the Earth-like CHZ boundaries, the difference in the position of the inner edge is 0.17 au, but 0.70 au for the outer edge. This difference is toned down considering the cases for other planetary parameters but it remains visible. Even if setting working boundaries remains important, it is also important to remember that the CHZ might not have absolute boundaries and may depend on a lot of different parameters, so the boundaries may more properly be fuzzy and planetary habitability varies more continuously with distance.
The trend for small variation in the location of the inner edge is not so much a surprise. The inner edge is classically defined by the runaway greenhouse or wet greenhouse and loss of water. So the fate of the planet is heavily influenced by the behaviour of water in its atmosphere and the changing solar luminosity, which will approximately be the same in the models. But only if the planet is an aquaplanet. For much dryer planets, the inner edge can be pushed closer to the Sun (Abe et al., Reference Abe, Abe-Ouchi, Sleep and Zahnle2011; Zsom et al., Reference Zsom, Seager, De Wit and Stamenković2013; Kodama et al., Reference Kodama, Nitta, Genda, Takao, O'ishi, Abe-Ouchi and Abe2018). The same with an increase in cloud cover, and so in albedo (Selsis et al., Reference Selsis, Kasting, Levrard, Paillet, Ribas and Delfosse2007), which could considerably extend the CHZ inwards.
Earth's orbit is also much closer to the inner edge than the outer edge in most works. This implies that, by most models, Earth's habitability is closer to its end in astronomical timescales.
In the classical CHZ, the outer edge depends on the effectiveness of CO2 in warming up the atmosphere and maintaining habitable temperatures. How much CO2 could accumulate in the atmosphere and its effectiveness as a greenhouse gas, considering its sensitiveness with geologic activity, albedo and the formation of CO2 clouds, is something easily variable from model to model. Because methane, H2 and other gases can contribute to the greenhouse effect, the outer edge is poorly constricted, potentially being extendible today beyond the orbit of Mars (Kasting et al., Reference Kasting, Whitmire and Reynolds1993) even for Earth-like planets if the greenhouse effect of CO2 cloud cover or very high pCO2 (>1 bar) are considered (Selsis et al., Reference Selsis, Kasting, Levrard, Paillet, Ribas and Delfosse2007; Kopparapu et al., Reference Kopparapu, Ramirez, Kasting, Eymet, Robinson, Mahadevan, Terrien, Domagal-Goldman, Meadows and Deshpande2013; Ramirez and Kaltenegger, Reference Ramirez and Kaltenegger2017). Very high pCO2 in habitable planets may be less likely because of geodynamics limitations as we have discussed here, but a cocktail of different greenhouse gases seems more likely at least when the planet is young.
As some of the CHZ admit Mars’ orbit, they pose the question of why Mars is not habitable today. The reason, as mentioned before, is probably its mass. The CHZ is for a planet with one-Earth-mass (green) and the outer extensions (blue) for the CHZ are more generally for planets with one Earth mass or above it or that can retain a dense atmospheric envelope. The use of the widest CHZ in other systems works as a first approximation but may pose problems if the planets on them are too light, old or closer to the uncertain CHZ's outer edge.
CHZ for F, G, K and M stars
By changing stellar luminosity and albedo response to different stellar spectra we can simulate different stars and estimate a more general CHZ. Figure 11 shows the inner and outer boundaries of the CHZ for the six planetary masses considered. The left panel (a) is the CHZ at the ZAMS. There is only one inner edge for all masses (black line) and different outer edges, one for every mass. For easier visualization, we show just the case of sensitive W l, but the insensitive case would be analogous, with just shorter outer edges. The right panel (b) is the continuous circumstellar habitable zone for 5 Gyr (region continually inside the CHZ for 5 Gyr). We did not consider ‘cold start’ planets for the continuous CHZ.
Inner (black line) and outer (coloured lines) boundaries of the CHZ: (a) boundaries for the ZAMS and (b) boundaries for the 5 Gyr continuous CHZ. Internal Solar System planets are marked as black dots with a white outline. The two thick dashed grey lines in (b) are the inner and outer boundaries of the ZAMS CHZ of (a) repeated for comparison. Above the horizontal dashed grey line at 1.3 M$_{\odot }$ , stars have a main sequence lifetime inferior to 5 Gyr as given by equation (21).

We can see the general behaviour of the CHZ for various stars at the ZAMS. The CHZ is narrow and more close to the less massive and less luminous stars, being wider and more distant to more massive and more luminous stars. The difference in location of the outer edge is greater for less massive planets than for more massive ones, so the CHZ at the ZAMS is about the same size for planets of masses above 0.5 M$_{\oplus }$ .
In the continuous CHZ, we see that the CHZ can contract in both directions: from the inner edge moving outwards, as the stars evolve, and from the outer edge moving inwards, as the planets get old and are less capable of maintaining high levels of CO2 in their atmospheres. The narrowest continuous CHZ is for the 0.1 M$_{\oplus }$ planet, already non-existent for solar-mass stars and close to disappearing completely in lower-mass stars. The widest region for a 5 Gyr continuous CHZ seems to be for the more massive planets around stars of 0.9–1.2 M$_{\odot }$
 .
Comparing the two, we can derive evolutionary trends. Below 0.8 solar mass, stellar evolution is slow in the 5 Gyr interval, so luminosity does not increase by much and the inner edge moves little or barely. However, for the planets, the 5 Gyr interval is significant, and the outer edge contracts as the planets get old and cool down. Around low-mass star, this contraction of the outer edge is visible even for the planets more massive than Earth although less than for the less massive ones.
Above 1.1 solar mass, stellar evolution is fast in the 5 Gyr interval, so the inner edge moves by a lot, but the outer edges for the 2.0 and 4.0 M$_{\oplus }$ are curiously in the same position as in the ZAMS. More massive planets would be able to maintain a wider CHZ, but, as we saw, even their outer edge should already have receded at least a bit at this point. Here, stellar evolution is so fast that it compensates and surpasses the effects of planetary evolution. Because we are showing the continuous CHZ and no ‘cold start’ planets are allowed, the initial outer edge stays fixed. If we were allowing ‘cold start’, showing the ‘instantaneous’ CHZ at 5 Gyr, the outer edges for the more massive stars would be much outwards than at the ZAMS, even when considering the planets’ thermal decay. As low-mass planets have the narrowest starting CHZ, they are the most affected by the fast stellar evolution, and for any planet below one-Earth-mass, there is no 5 Gyr continuous CHZ left above 1.2 M$_{\odot }$
 . Stellar mass of 1.3 M$_{\odot }$
 may mark the limit for the 5 Gyr continuous CHZ, as it is almost non-existent, and above 1.3 M$_{\odot }$
 , stars have a main sequence lifetime inferior to 5 Gyr as given by equation (21).
This behaviour, where the CHZ for planets around low-mass stars is limited more by geodynamics and the CHZ for planets around high-mass stars is limited more by stellar evolution, was mentioned before in Cuntz et al. (Reference Cuntz, von Bloh, Schröder, Bounama and Franck2012).
Figure 12 shows similar cases, but we compare the CHZ for different models in the literature. We had a smaller amount of models to use here than in Fig. 10 because not all models are presented for many different stellar masses, the continuous CHZ is not presented, or the CHZ is presented only for stellar effective temperatures or fluxes and the conversion to stellar mass and age would not be certain in every case. Because of this, the models presented in the ZAMS case (a) are generally not the same as the ones presented in the continuous CHZ (b). Also, the 5 Gyr continuous CHZ of Kasting et al. (Reference Kasting, Whitmire and Reynolds1993) presented here is a mean of the values for a continuous CHZ of 4 and 6 Gyr as presented in their paper. The presented continuous CHZ of Hart (Reference Hart1979) is for just 4.5 Gyr. As his continuous CHZ is already very narrow, a half-billion-year-older continuous CHZ would be even narrower and more pessimistic than shown. For our continuous CHZ, for easier visualization, we only show the case for 4.0 M$_{\oplus }$ , the widest CHZ and CCHZ, but we included the variation of sensitive W l (full black lines) and insensitive W l (dashed black lines).
Comparison of the boundaries of the CHZ as given by different models in the literature: (a) boundaries for the ZAMS and (b) boundaries for the 5 Gyr continuous CHZ. The 5 Gyr continuous CHZ of Kasting et al. (Reference Kasting, Whitmire and Reynolds1993) is a mean of a continuous CHZ of 4 and 6 Gyr as presented in their paper. The presented continuous CHZ of Hart (Reference Hart1979) is for just 4.5 Gyr. In both panels, we show our results for only the 4.0 M$_{\oplus }$ to facilitate visualization and better distinguish between lines. Internal Solar System planets are marked as black dots with a white outline.

Looking at the ZAMS case, and comparing it with Fig. 10, the inner edges are still closer together than the outer edges, but the difference is much less significant. The inner edges are very close to Venus’ orbit, if not including Venus in some models. The outer edges are also close to Mars’ orbit but this may include conditions improbable for a planet small as Mars, as in our case it is because we are using the CHZ for a high mass terrestrial planet, a 0.1 M$_{\oplus }$ has a much narrower CHZ even at the ZAMS. Others’ outer edges seem to go further out than ours.
At the 5 Gyr continuous CHZ, the inner edges are still mostly coincident and very close to Earth orbit except for Kasting et al. (Reference Kasting, Whitmire and Reynolds1993), which moves outwards the less above ~0.8 M$_{\odot }$ , while the outer edges are much more spread out. As said before, this implies that, by most models, Earth's habitability is closer to its end in astronomical timescales. The narrowest CHZ is the one of Hart (Reference Hart1979), barely containing Earth and non-existent for most stellar masses. The motives are the same as mentioned before for Hart (Reference Hart1978).
Our continuous CHZ has a much closer outer edge, making it the second narrowest here presented, in contrast to other continuous CHZ. Our modelled planets struggle to build dense CO2 atmospheres and our CHZ contracts with time because of an advancing inner edge (by stellar evolution) and also contracts because of a receding outer edge (via effects of geodynamics). The difference between sensitive and insensitive W l is more striking here because the insensitive case has a non-existent 5 Gyr continuous CHZ above 1.15 M$_{\odot }$ . This is because insensitive W l makes surface temperature lower initially, as W l is not weakened by initial small continents, making the CHZ outer edge initially closer to the star.
Width of the CHZ
The widest the CHZ in a stellar system is, the more likely that at least one planet will be inside of it and that it can be habitable. The same for the continuous CHZ with the advantage of possibly long-lived habitability. We saw that the width of the CHZ depends not only on the stellar luminosity, but also on planetary mass, geodynamics and age. So, a more precise or useful way to access the width of the CHZ would be along these dimensions.
In Fig. 13, we compare the width of the CHZ for different planetary and stellar masses, and ages, condensing everything we saw before except for the location of the CHZ. We show both the cases for sensitive W l (full lines) and insensitive W l (dashed lines). As before, we see that the low-mass stars have the most long-lived CHZ, going all the 13 Gyr of the simulation's runs, but also the narrowest ones. More massive stars have the widest CHZ, but also the shortest lifespans.
Width of the CHZ for the six planetary masses and 12 stellar masses considered. Full lines are for sensitive W l, and dashed lines are for insensitive W l. Numbers on subtitles and colours correspond to solar masses.

The difference between the cases of sensitive W l and insensitive W l is less prominent on low-mass stars and low-mass planets. The insensitive W l case starts with a narrow CHZ but converges with the sensitive case as the planets get cold internally. Recalling Fig. 9, the moment where CO2 levels are too low and the outer edge starts to be dictated primarily by the star is clearly visible, at 1 Gyr for the 0.1 M$_{\oplus }$ planets, 2.5 Gyr for the 0.25 M$_{\oplus }$
 planets, then 4 Gyr for the 0.5 M$_{\oplus }$
 planets and so on to beyond 13 Gyr for the 4.0 M$_{\oplus }$
 planets.
For above-solar-mass stars, the difference between the cases of sensitive W l and insensitive W l is larger, but more a result of increased stellar flux. On the two higher mass planets, the behaviour is more complex, the width of the CHZ is initially the narrowest for the insensitive W l case, but later the insensitive W l case shows the widest CHZ. As seen before, this is a result of calibrating W l on the smaller continents of the present Earth. In general, we showed that the sensitivity of W l to land area can have a considerable effect on the outer edge of the CHZ. The two cases studied here are just extremes of the range most commonly presented in the literature for this sensitivity and perhaps a more realistic modelling would present an intermediate sensitivity, equivalent to raising f land in equation (15) to some power lower than 1.0, but stronger dependencies may not be impossible. If such a poorly studied parameter can have an important impact on the CHZ boundaries, it should be given more attention, as well as the parameterization of the weathering equations used in the models.
Concerning long-lived habitability, a better metric than CHZ is the continuous CHZ presented in Fig. 14. Here, the continuous CHZ is not of a fixed age (5 Gyr as in the anterior cases) and we can follow its width in time. The low-mass stars also present the longest-lived continuous CHZ, but they are even more narrow than the CHZ and do not reach the age of 13 Gyr for the two less massive planets. High-mass stars present the widest continuous CHZ initially, but they shrink fast. Sensitive W l clearly produces the widest continuous CHZ, initially almost double the width of the insensitive W l case. This is even the case for planets above Earth mass, because the insensitive W l case starts with a narrower CHZ, and so the continuous CHZ cannot become wider than that, even if the insensitive case maintains a wider CHZ later as seen in Fig. 13.
Width of the continuous CHZ for the six planetary masses and 12 stellar masses considered. To facilitate visualization, we separate the two cases of W l sensitive to land area (top a–f panels, full lines) and W l insensitive to land area (bottom g–l panels, dotted lines). Numbers on subtitles and colours correspond to solar masses.

Because planets lose geophysical vigour as they age, the CHZ gets narrower with time, and then the continuous CHZ may even become non-existent for systems of a certain age, making old planetary systems weak targets for astrobiology study in the timescale of the age of our Galaxy or in the timescale stars spend in the main sequence. In other words: most habitable planets may have a shorter lifespan than their stars and stellar lifetime should not be equated with planetary habitability lifespan, especially in the case of continuous habitability for many billions of years.
These results may also have consequences for the quantity and age of habitable planets in our galaxy. As reported by some models, three-quarters of Earth-like planets in the Universe may be 1.8 ± 0.9 Gyr older than Earth (Lineweaver, Reference Lineweaver2001), and 75% of the stars in the Galactic habitable zone of our galaxy may be older than the Sun (Lineweaver et al., Reference Lineweaver, Fenner and Gibson2004). All these older planets would have much more time than Earth to pass through abiogenesis, for life to evolve, and for high intelligence and a high technological civilization to appear. However, considering what we discussed in this paper, a substantial fraction of planets previously considered habitable could be geologically dead or with compromised habitability if aged 5 Gyr or more. In this manner, time could also be seen as a Goldilocks’ parameter: too little of it, and still not enough steps have been taken for life to appear and evolve, but too much of it, and the planet may become rigid and uninhabitable, greatly diminishing any chance of any evolutionary steps to take place. This time window would be shorter for low-mass planets and longer for more massive planets, but other planetary and stellar parameters could also influence the size, location and lifespan of the CHZ.
Life, when it appears on a planet, can have some stabilizing effect on its climate, potentially prolonging its habitability, and a technologically advanced species can enrol in geoengineering, terraforming or just leave its system behind, colonizing the Galaxy in a short time frame when compared with the Galaxy's age. But, considering planetary geodynamics more seriously, most current habitable exoplanets may be younger than Earth, not older, and so still had considerably less time than Earth to produce life, evolve highly intelligent species or technologically advanced civilizations.
We did not study different radioactive budgets in this work, but as pointed out in Gonzalez et al. (Reference Gonzalez, Brownlee and Ward2001), a higher stellar birth rate in the past of our Galaxy could have increased interstellar radioactive elements content, making some of the initial generations of habitable planets (old planets now) somewhat richer in radioactive elements than more recent generations. This could have lengthened their habitability timespan by increasing internal temperatures, heat fluxes and geologic vigour. But the extent to which this affects long planetary habitability still needs to be properly studied in conjunction with all discussed in this work.
Also, nothing was told about the distribution of planets by mass (or radius) in our Galaxy. Similar to the power law of initial mass function of stars, in which the formation of low-mass stars is much more frequent than that of high-mass stars, it could be naively expected that small rocky planets could be more common than more massive rocky planets. In this case, most terrestrial planets would be small and could present just a narrow and short-lived CHZ. Nonetheless, observational data, even if restricted by observational biases and incompleteness, suggest a more complex behaviour for the distribution over the entire radius range and no big increase in frequency (and maybe even a decrease in frequency) is observed for small planets in the range considered here (0.1–4.0 M$_{\oplus }$ or 0.49–1.44 R$_{\oplus }$
 ) (Kunimoto and Matthews, Reference Kunimoto and Matthews2020; Dai et al., Reference Dai, Liu, An and Zhou2021). Future exoplanet demographic surveys may be better able to indicate a more reliable distribution.
All these limitations point to different strategies in the search for habitable planets.
The widest CHZ would be found in young systems (<2 Gyr) with planets more massive than Earth. And this also includes planets around stars more massive than the Sun, even though they evolve fast, they still did not have time to increase their luminosity by much and still have a wider continuous CHZ. A potential biosphere around these planets would also be young.
Around low-mass stars (<1.0 M$_{\odot }$ ) lie the highest chances to find any old planet (>5 Gyr) still habitable or an old biosphere. These stars have the narrowest CHZ but are the most numerous in the Galaxy, and focus on planets above 0.5 M$_{\oplus }$
 , and especially above one-Earth-mass, could increase the odds considerably.
Finally, a compromise for a long continuous CHZ lifespan and a wide CHZ could be found in systems with planets with mass above 0.5 M$_{\oplus }$ and around stars of approximately solar mass.
Conclusions
The planetary atmosphere has, with reason, the great spotlight on the models estimating the boundaries of the CHZ. But the geosphere and its geodynamics can influence considerably the atmosphere and habitability. To gain insight into this, we build a model of planetary habitability constituted of a thermal parametrized mantle module coupled with a grey atmosphere module. We evaluated habitability via surface temperature, pCO2 and oceans’ effective depth for the Earth and Earth-like exoplanets, estimating the CHZ in function of stellar and planetary parameters.
The behaviour for the boundaries of the CHZ can be divided into two parts: the part caused by stellar evolution and the part caused by planetary thermal evolution. Stellar luminosity increases with stellar age and stellar mass. Thus, the effect is that the CHZ becomes wider and moves outwards with time, this happening sooner for more massive stars. However, this is compensated by the planets’ thermal evolution. Planetary mantles cool down with time as heat is transferred to the surface and there are fewer and fewer radioisotopes to warm their interiors, turning the planets less geologically active and disrupting the geologic carbon cycle. This affects all the planets modelled, narrowing down the CHZ with time, but more noticeably on the outer regions of the CHZ and for planets less massive than Earth.
Land weathering sensitive to land area permits higher CO2 levels in young planets, when continents are probably small, producing an initial wider CHZ. Still, the maximum pCO2 reached was timid, below 0.3 bar even when the planets were young and massive. This indicates geodynamics limitations to reach arbitrarily large CO2 in terrestrial planets with convective mantles and plate tectonics as modelled here, and a possibly bigger role for weathering in limiting CO2 levels in the atmosphere.
The decreasing geological activity with time would impair the carbon geologic cycle, and the planet's ability to stabilize its climate. Atmospheric CO2 levels would drop, falling below the C3 and C4 limits and decreasing the carbon easily accessible to the biosphere. This could happen long before the planets get too hot and uninhabitable due to stellar evolution, so planets can get their habitability largely reduced before completely exiting the CHZ. This could be a common scenario in aged low-mass planets.
Comparing results in the literature for the boundaries of the CHZ, Earth is inside the CHZ in all of them but there is a lot of varieties in the position of the boundaries, both in its inner and outer boundaries. The inner edges are less spread out, converging more to ~0.95 au, and the outer edges are much more scattered and variable. By our model, the CHZ in the present Solar System goes from 0.92 to 1.09 au for a 1.0 M$_{\oplus }$ Earth-like planet, extending to a maximum of 1.36 au in the case of a 4.0 M$_{\oplus }$
 planet with land weathering insensitive to land area. Earth will cease to be habitable in 1.66 Gyr, when solar flux will reach 117% of the present levels, and surface temperatures will rise beyond 100$^\circ$
 C.
Varying planetary mass produced a big difference in planetary thermal evolution. Higher planetary masses (2.0 and 4.0 M$_{\oplus }$ ) produced wider and more long-lived CHZ, but the difference to the terrestrial case was small. Losses in longevity and size of the CHZ were much more pronounced in small planetary masses (0.1 and 0.25 M$_{\oplus }$
 ). The 0.5 M$_{\oplus }$
 planet marked the inferior limit for long-lived habitable planets. The literature also suggests that planets with hotter interiors could struggle to maintain a strong dynamo effect, so despite our results, we may still not be completely certain of all the gains in habitability regarding high planetary mass.
In summary, the general behaviour shown in our results is that the CHZ is wider for young and massive planets and it gets narrower as the planets get older. This narrowing comes from the expanding inner edge (by stellar evolution) and also, importantly, from the receding outer edge (via weakening geological activity). This strongly affects long habitability as the 5 Gyr continuous CHZ may be very narrow or even non-existent for low-mass planets (<0.5 M$_{\oplus }$ ) and fast-evolving high-mass stars (>1.1 M$_{\odot }$
 ). Most planets initially in the CHZ would fall out of it on the scale of a few billion years, having a shorter lifetime than their parent stars, making old planets (and so old stellar systems) poorly candidates for containing habitable planets. The mean age of habitable planets in our Galaxy today could be younger than the age of Earth.
A suggestion from our results is that the best targets for future surveys of biosphere signatures may be planets between 0.5 and 4.0 M$_{\oplus }$ , in systems younger than the Solar System. These planets may present the widest and long-lived CHZ, maximizing the chances to find any truly habitable planet.
Limitations regarding the use of a 0D parameterized model, scaling laws and CO2 and H2O as the only greenhouse gases may reduce the precision of our results in absolute terms, rendering our estimated CHZ as conservative or pessimistic. But we cover a wide parameter space and the trends shown and the behaviours explored, linking the geosphere and the atmosphere when estimating the CHZ, may still point to real phenomena that, we hope, can be more deeply and precisely studied in future works. Planetary geodynamics, mass and especially age seem to play a big role in determining the CHZ and should be considered more frequently when estimating planetary habitability, especially on the outer edge of the CHZ.
Acknowledgements
We would like to thank our reviewers for their valuable comments. This article is better because of them. This study was financed in part by the Coordenação de Aperfeiçoamento de Pessoal de Nível Superior – Brasil (CAPES) – Finance Code 001 and in part by the Conselho Nacional de Desenvolvimento Científico e Tecnológico – Brasil (CNPq) – Project number: 140172/2015-7.
Conflict of interest
The authors declare none.