I. INTRODUCTION
Vanadium is a soft and ductile, silver-grey metal. It has good resistance to corrosion by alkalis, sulfuric, and hydrochloric acid. Vanadium has good structural strength and a low fission neutron cross section, making it useful in nuclear applications. Approximately 80% of vanadium produced is used as ferrovanadium or as a steel additive, others used in specialty stainless steel, superconducting magnets, catalyst, lithium vanadium oxide Reference Gummow1–Reference Muroga, Nagasaka, Iiyoshi, Kawabata, Sakurai and Sakata4 and so on. By far the greatest proportion of the world's vanadium production is sourced from vanadium-bearing magnetite found in ultramafic gabbro bodies. From these ores vanadium can be calcined to form ferrovanadium, or can be recovered from the vanadium steel smelting process which is widely used in Russia and China. Reference Tyzach and England5,Reference Suzuki and Ishikawa6
Titanium has unique good mechanical and physical properties and is widely used in turbine components, such as high tension, low density, strong corrosion resistance, and good welding capacity. Reference Tyzach and England5–Reference Liu, Ge, Yu, Pan and Zhang10 The vanadium alloys especially V–Ti–Cr–Fe-series alloys have a good hydrogen storage properties, and have a wide range of applications in fuel cells, hydrogen storage, and transportation. Reference Yan, Chen, Liang, Zhou, Wu, Tao and Pang11 As the preparation of vanadium–titanium alloys should generally take a vacuum induction furnace or a vacuum arc furnace, the adiabatic temperature could be up to 2584–2879 K and brought certain amount of impurities. Reference Li and Zhao12
In fact, it is very hard to produce vanadium metal, because vanadium element can combine with hydrogen, carbon, nitrogen, and oxygen more easily than titanium. In current industry, vanadium metal is primarily produced by the vacuum carbothermic, calciothermic, or aluminothermic reduction of the pentoxide V2O5 according to the two reactions below: (1a) and (1b)
 $${{\rm{V}}_2}{{\rm{O}}_3} + 3{\rm{Ca}} = 2{\rm{V}} + 3{\rm{CaO}}\quad ,$$
 $${{\rm{V}}_2}{{\rm{O}}_3} + 3{\rm{C}} = 2{\rm{V}} + 3{\rm{CO}}\quad {\rm{.}}$$
Currently, the main academic studies by preparation of vanadium which named the OS method was proposed by Ono and Suzuki, Reference Ono and Suzuki7–Reference Suzuki9 the approximate principles are: the consumable graphite and electrolysis cell wall were used for anode and cathode, respectively. The reaction medium was a mixture of the metal calcium and calcium chloride. The reactant metal oxide powder was feed at the top then into the reactor, after reduction by calcium metal in the reaction, the products were deposited onto the bottom of the electrolyzer. The voltage applied between the two electrodes should range from the decomposition voltage of CaO and CaCl2 (typically 3.0 V). The by-product CaO generated by electrolytic reduction was reduced to metal calcium again, the reduction and electrolysis could be accomplished in the same device simultaneously. From the operational point of view, the continuous process can be achieved in this research. The electrolytic reactions are as follows: (2a)–(2e)
 $${\rm{C}}{{\rm{a}}^{2 + }} + 2e = {\rm{Ca}}\quad {\rm{,}}$$
 $${{\rm{V}}_2}{{\rm{O}}_3} + 3{\rm{Ca}} = 2{\rm{V}} + 3{\rm{CaO}}\quad {\rm{,}}$$
 $${\rm{CaO}} = {\rm{C}}{{\rm{a}}^{2 + }} + {{\rm{O}}^{2 - }}\quad ,$$
 $${{\rm{O}}^{2 - }} + {\rm{C}} = {\rm{CO}} + 2{\rm{e}}\quad {\rm{or}}\quad 2{{\rm{O}}^{2 - }} + {\rm{C}} = {\rm{C}}{{\rm{O}}_2} + 4{\rm{e}}\quad {\rm{,}}$$
The total reaction equations can be simplified to:
 $$2{{\rm{V}}_2}{{\rm{O}}_3} + 3{\rm{C}} = 4{\rm{V}} + 3{\rm{C}}{{\rm{O}}_2}\quad ,$$
Compared with conventional pyrometallurgical production, the OS method was expected to improve the energy efficiency, the products of which contained a low oxygen content (6-h electrolysis with the oxygen content ∼2000 ppm). However, the products could still contain up to ∼1000 ppm carbon and ∼1.66 mol% titanium as impurities. Reference Ono and Suzuki7–Reference Suzuki9
In late l990s, the direct electrochemical reduction of solid TiO2 to Ti metal in molten CaCl2 was discovered. Reference Chen and Fray13,Reference Chen, Fray and Farthing14 Increasing reports have shown that metals such as Ti, Reference Chen and Fray13–Reference Jiang, Hu, Ma, Wang, Qiu, Jin and Chen15 Ta, Reference Wu, Jin, Xiao, Hu, Wang and Chen16 Nb, Reference Yan and Fray17–Reference Wu, Jin, Xiao, Liu, Wang and Chen20 Mo, Reference Li, Wang, Jin and Chen21 Si, Reference Nohira, Yasuda and Ito22,Reference Jin, Gao, Wang, Hu and Chen23 Cr, Reference Gordo, Chen and Fray24,Reference Chen, Gordo and Fray25 and alloys, Reference Zhu, Wang, Ma, Hu, Jin and Chen26–Reference Ma, Wang, Hu, Jin and Chen28 can be produced by direct electrolytic reduction of this novel process named the Fray Farthing Chen (FFC) Cambridge Process. This electro-reduction method is in CaCl2 lower in energy consumption and simpler in operation than many existing industrial technologies. Reference Mearns29,Reference Mearns30
In the previous papers, Reference Wu, Jin, Xiao, Hu, Wang and Chen16–Reference Wu, Jin, Xiao, Liu, Wang and Chen20 the direct electrolysis of tantalum and niobium powders of the VB family in molten CaCl2 were introduced in detail, while the direct electrochemical reduction mechanism of the vanadium in molten salt has not been reported before, so the research for the mechanism of electrochemical preparation of metal vanadium and vanadium–titanium alloys in molten salt are of great importance both in academic and technical innovation.
In this paper, we use three-electrode system to systematically study the direct reduction of V2O3 and mixed V2O3–TiO2 powders (V:Ti = 4:1 in mass) to vanadium and V–20Ti alloys in molten CaCl2 salt. The products from electrolysis under different conditions are compared according to x-ray diffraction spectroscopy (XRD), scanning electron microscopy (SEM), and energy dispersive x-ray (EDX) analyses. Typical results of the current efficiency and energy consumption of the electrolysis are shown. The process mechanism is proposed based on cyclic voltammetry of the oxide powders in a metallic cavity electrode (MCE), Reference Qiu, Ma, Wang, Jin and Chen31 and on XRD analysis of the products from potentiostatic electrolysis (three-electrode) of the mixed oxide powders at the potentials selected according to the cyclic voltammogram (CV). As is shown below, this electrochemical route is efficient and offers a product with controlled stoichiometry. Its particular advantage lies in the manufacturing of low cost alloys and intermetallics directly from mixed oxide precursors, and has potential to produce the functional vanadium alloys.
II. EXPERIMENTAL
The high-purity V2O3 powder (A.R, 300 nm in average particle size, Sigma, Tokyo, Japan) was used as received and pressed (4 MPa) into a pellet (∼2.0 cm in diameter, 1.5–1.7 mm in thickness, ∼0.4 g in mass). The pellets were heated under an infrared lamp at 200 °C for about 3 h to achieve strength for handling and a desired porosity (40–60%). Synthetic V2O3–TiO2 mixture prepared by mixing stoichiometric (V:Ti = 4:1, in mass) amounts of fine powders of TiO2 (99.99%, 300–500 nm in average particle size, Shanghai Chemical Reagent Company, Shanghai, China) and V2O3 were ball-milled with anhydrous alcohol for 10 h, then pressing the mixture into pellets, and sintering at 300 °C for ∼4 h, before electrolysis, the pellets were suspended above the molten salt for a short time (∼5 min) under argon.
The sintered pellets were sandwiched between two molybdenum wire meshes to form an assembled working electrode (cathode). The MCE was made by drilling one or two holes (0.5 mm diameter) into a thin molybdenum foil (0.5 mm thickness and 1.0 mm width). Potentiostatic electrolysis was carried out against a quartz sealed Ag/AgCl reference electrode Reference Gao, Jin, Wang, Hu and Chen32 and a graphite rod (1.0 cm diameter) counter electrode in molten CaCl2 (∼1000 g, 1123–1173 K) contained in a cylindrical alumina or graphite crucible of similar sizes. Preparation of the molten salt from anhydrous CaCl2 (96%, containing up to 0.3 wt% Mg in the form of MgCl2, Silian Reagent Plant, Shanghai, China), including pre-electrolysis, was described elsewhere. Reference Xiao, Jin, Deng, Wang, Hu and Chen33,Reference Qiu, Ma, Wang, Jin, Hu and Chen34 The cell was protected by a continuous argon flow (99.999%, Minghui Gas Technology Co., Ltd, Shanghai, China) inside a sealed stainless tube reactor. The electrolyzed pellets were washed in tap water, 0.1 M HCl and distilled water, in order, and dried in vacuum at 353 K before further analyses.
CVs were recorded using a previously reported MCE (for loading the oxide powder) Reference Qiu, Ma, Wang, Jin and Chen31 on a computer controlled electrochemical system (CHI440A, Shanghai Chenhua, Shanghai, China). Potentiostatic electrolysis was performed on a computer controlled multi-channel four-electrode potentiostat (NEWARE, China) capable of programming the variation of electrolysis parameters. The products were characterized by XRD (X-ray 6000 [Shimadzu, Kyoto, Japan], with Cu Kα1 radiation at λ = 1.5405 Å); EDX analysis, SEM (FEI Sirion Field Emission Gun SEM system with GENESIS 7000 EDX spectrometer, FEI Company, Tokyo, Japan) and transmission electron microscopy (TEM) (JEM-2010, JEOL Ltd., Tokyo, Japan). The oxygen content in the sample was examined by inert gas fusion oxygen analysis (RO-416DR, LECO, Shanghai, China).
III. RESULTS AND DICUSSION
A. Cyclic voltammetry behavior of V2O3 powder in the molten salt
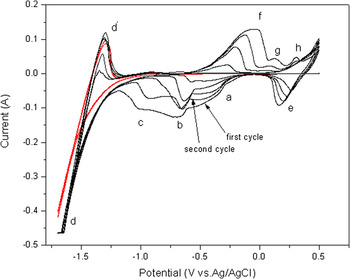
Figure 1 presents five consecutive CVs of the V2O3-MCE in molten CaCl2 at 1173 K. The V2O3 powder was manually pressed into the hole(s) (cavity) of MCE. In this paper, the V2O3 powder filled MCE is named as V2O3-MCE for convenience. Before the CV experiment, pre-electrolysis has been done to remove the impurities of molten CaCl2. We carried out the experiments in the range from −1.7 to +0.5 V (versus Ag/AgCl), the CV shows slightly sloped and paired parallel negative currents on the forward and backward potential scans. In the first week of the scan curve you can see three clear reduction peaks (a–c) before Ca deposition potential: the first reduction peak (a) between 0 and −0.60 V; the second reduction peak (b) between −0.60 and −0.92 V; the third reduction peak (c) between −0.92 and −1.18 V. Peaks (d) and (d′) were the only peaks observed in the absence of V2O3 and hence can be attributed to the electrochemistry of the M2+ ions (M = Ca, Mg) in the molten salt. Compared with the CVs of MCE in the absence of V2O3 powders in the same condition, peaks (a–c) were corresponding to the main reduction procedures of V2O3, this also indicated that the electroreduction of V2O3 powders in molten salt was a complex and multi-step process. In the reverse scan, the reoxidation peak (f) appeared between +0.66 and +0.07 V, another small peaks (g, h) between +0.07 and +0.5 V. From the second cycle to fifth, another new reduction peak (e) occurred and its peak current was increasing along with scanning cycles, which is related to the sustained cathodic dissolution of V2O3, hence peak (e) was corresponding to the reduction peak of vanadium and vanadate ions. Then the current of reduction peak (a–c) were decreasing as scanning cycles increased, and peak potentials have been shifted correspondingly. These variations agree with the oxide being gradually irreversibly reduced when more discharged O2− ions diffused into the bulk electrolyte. The similar circumstances were happened in the electroreduction of Nb2O5, TiO2, and so on. Reference Yan and Fray19,Reference Mearns30,Reference Qiu, Ma, Wang, Jin and Chen31 Moreover, in the reduction process of V2O3 to V, if the disproportionation reaction of intermediate products has been taken into account, a series of vanadium oxide with low valence and perovskites, i.e., V2O5, VO2, V2O3, VO, V2O, and MVO3, MV2O5 (M = Ca and Mg) were found and thought to have formed via the chemical process mentioned above. The electrode reactions corresponding to the reduction current peaks previously analyzed on the CVs were deduced on further experiments.
CVs of V2O3-MCE in molten CaCl2 at 900° C, scanning rate was 50 mV/s.

First potential cycle of Fig. 1.

B. Potentiostatic reduction of porous V2O3 powders pellets
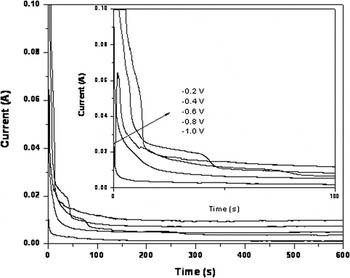
To understand the electro-reduction process represented by the afore-discussed CVs, a series of potentiostatic electrolysis of porous V2O3 pellets were carried out at different potentials in the range from −0.2 to −1.0 V (see the potential range of CVs in Fig. 3) at intervals of 0.2 V. All electrolysis experiments lasted for 600 s. It can be seen that negatively shifting the electrode potential led to larger reduction currents in the initial period (10 s), all current curves reached a stable value in the last stage (300 s) and the background current increased along with electrode potentials decreased. As was commonly observed in previous work on electrolysis of porous pellets of oxides, Reference Yan and Fray19,Reference Mearns29,Reference Mearns30 the electrolysis current went through three stages: a fast initial increase to a peak, a following slower decrease, and then a small but stable current. However, the initial stage of −0.8 and −1.0 V could not be observed due to the detection limit of the experiment, these three stages can be accounted for by the charge (electrons ions) transfer reactions occurring at the metal-oxide-molten salt three-phase lines (3PIs) Reference Mearns30,Reference Qiu, Ma, Wang, Jin, Hu and Chen34–Reference Xiao, Jin and Chen37 that expand from the initial current collector oxide molten salt three-phase contact points. When the surface of the oxide pellet was fully metallized, the reduction could only proceed into the interior of the pellet. Due to the increasing ohmic drop and concentration polarization with the 3PIs penetrating deeper into the pellet, the current decreased until the full reduction of the pellet. With the purpose to research products of electrolysis, ∼0.7 g V2O3 pellets were pressed (4 MPa) into a cylindrical pellet (∼2.0 cm in diameter, ∼45% in porosity). The pellet was sintered in air at 1173 K for about 2 h and sandwiched between two molybdenum wire meshes to form an assembled cathode for potentiostatic electrolysis, all electrolysis experiments lasted for 5 h. When cooled down above the molten salts for a moment, the electrolyzed pellet was washed in distilled water, and then dried in vacuum before further analyses including XRD, EDX, and SEM test.
Typical current–time curves recorded during potentiostatic electrolysis of porous V2O3 pellets at the indicated potentials (versus Ag/AgCl) in molten CaCl2 (1173 K). The inset shows the expanded portions in the first 100 min of electrolysis.

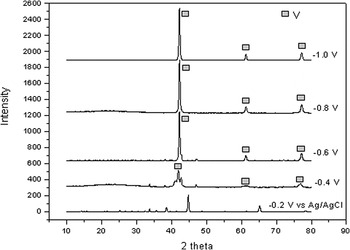
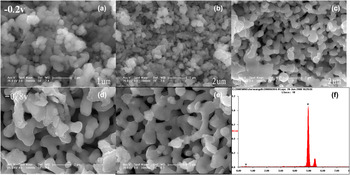
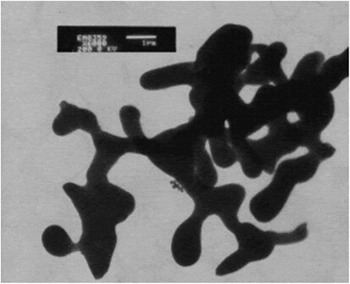
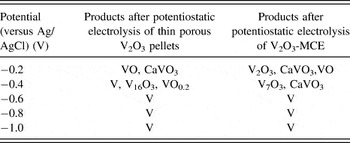
Figure 4 shows four typical XRD patterns of products from potentiostatic electrolysis at −0.2, −0.4, −0.6, −0.8, and 1.0 V, respectively. When the cathode potential was negative than −0.6 V, corresponds to the end of peak (a) and beginning of peak (b), the products were vanadium powders and diffraction patterns were nearly the same. While the color of products after electrolysis changed from black green to light gray in appearance. Seen from the TEM of Fig. 6, the size (∼1 µm) and appearance of products were very similar at the potential of −0.6, −0.8, and −1.0 V. Only the existence of vanadium could be found in the spectrum of products reduced at −1.0 V measured by EDX analysis shown in Fig. 5(f), while compared with the data of XRD analysis, V2O3 could be reduced to uniform particles at relatively negative potentials. Figure 7 was the TEM figure of the products, it could be seen that the electrolyzed metal vanadium was branched-cross together in microcosm structure, the size and shape was in accord with the SEM spectrum. When the applied potential was increased to −0.4 V, corresponding to the cyclic voltammetry peak (a), the vanadium simple substance and associated low-valence oxides such as V16O3, VO0.2, and so on were detected in electrolyzed mixture. However, in the potentiostatic electrolysis of V2O3-MCE at the same potential, no vanadium was found and the products were low-valence oxides and vanadium–calcium–oxygen solid solution such as V7O3 and CaVO3, respectively. The reason could be that the MCE electrolysis time is much shorter than the tablet electrolysis (600 s versus 5 h), such solid solution has not been fully reduced to low-cost oxide or metal vanadium.
Typical XRD spectra of the electrolytic products from potentiostatic electrolysis of thin porous V2O3 pellets at the indicated potentials in molten CaCl2 (5 h, 1173 K).

SEM images (a–e) of the electrolytic products from potentiostatic electrolysis of thin porous V2O3 pellets at the indicated potentials in molten CaCl2 (5 h, 1173 K). Spectrum (f) was EDX data of image (e).

Typical TEM image of the products from potentiostatic (−1.0 V versus Ag/AgCl, 5 h, 1173 K) electrolysis of porous V2O3 pellets in molten CaCl2.

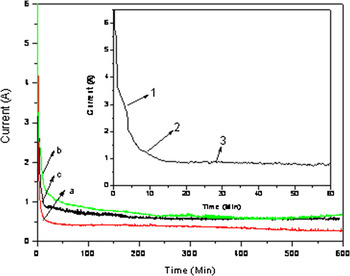
Plot of cell voltage against time recorded in potentiostatic electrolysis of V2O3 (a), TiO2 (b) and V2O3–TiO2 (c) in molten CaCl2 (1223 K, 3 V, 10 h).

When the applied potential was more positive than −0.2 V, close to onwards cyclic voltammetry peak (a) in correspondence, VO and other trace low-valence oxides of VO x were detected in tablet electrolysis products, while the mixture of partial reduced V2O3, CaVO3, and VO were determined in the MCE electrolysis, this is because V2O3 was more difficult to be reduced at the higher reduction potential, the entire reduction process pass through metal oxide → perovskite → low valence oxides → metal vanadium. Refer SEM spectrum of −0.4 and −0.2 V constant potential, both the intermediate product was in uneven particle size (∼300 nm in diameter). With the reduction potential decreased, the mixture in process was gradually reduced to metal vanadium, the size increased to a certain value at the same time (Table I).
Products after potentiostatic electrolysis of thin porous V2O3 pellets and V2O3-MCE (versus Ag/AgCl) in molten CaCl2 (5 h, 1173 K).

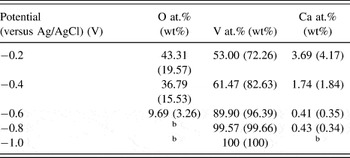
Table II shows the EDX analysis results of the electrolysis products of different potentials in potentiostatic electrolysis, it could be seen that a potential range of the reaction product was a mixture compounds containing of Ca, V, and O element corresponding to peak (a) in cyclic voltammetry. While in the potential range of peak (b), almost all vanadium was found except for small amounts of Ca and O mixture. Finally in the peak (c) range all metal vanadium was detected. Specific analysis is as follows:
Elemental compositions a of products from potentiostatic electrolysis of V2O3.

a EDX analyses (error: ±5%) on samples electrolyzed at 1173 K for 5 h in molten CaCl2 + ≤0.3 wt% MgCl2. The compositions were balanced by impurities, e.g., Si, Cl, and Fe.
b Below detection limit.
(i) When the applied potential was −0.2 V, to measure reactants in accordance with the stoichiometric of VO1.5, the electrolysis products were mainly CaTiO X mixture, and through calculating, get rid of the amount of Ca in the existence of CaVO3 based on above XRD results, the remaining group of vanadium and oxygen was V49.31O32.24, namely VO0.654; (ii) when the applied potential was −0.4 and −0.6 V, the content ratio of vanadium and oxygen was VO0.654 and VO0.09 respectively; (iii) when the applied potential was −0.8 and −1.0 V, only vanadium was detected in the sample by EDX, the content of metal V could reach 99.66% (wt%) or more. Since the deviation of EDX analysis on nonmetallic materials (such as oxygen) for quantitative detection is large, at potentials more negative than −0.6 V, indicating the complete reduction of the porous V2O3 pellets which combined XRD and SEM analysis, and the relatively high oxygen content of products was mainly due to the surface of metal vanadium exposed to the air is easy to be oxidized, otherwise, in the post-processing of electrolysis products (washing, drying) also introduced a certain amount of oxygen, which caused a relatively high oxygen content in the final. When decreasing the applied potential, O and Ca could not be detected, only a reduction peak was observed which was shown in Fig. 5(f). In summary, V2O3 could be completely electrochemical deoxidized between the potential −0.6 and −1.2 V [magnesium alloy deposition potential, see Fig. 2(b)] within a certain period of time, which fully confirmed reduction mechanism of perovskite and ionized oxygen by experiments.
From the above results, we can speculate that the peak (a–c) in Fig. 2(b) corresponding to the reaction is as follows:
 $$y{{\rm{V}}_2}{{\rm{O}}_3} + 2x{\rm{C}}{{\rm{a}}^{2 + }} + \left( {6y - 4z + 4x} \right){\rm{e}} = \,\,2{\rm{C}}{{\rm{a}}_x}{{\rm{V}}_y}{{\rm{O}}_z} + \left( {3y - 2z} \right){{\rm{O}}^{2 - }}\quad ,$$
 $${\rm{C}}{{\rm{a}}_x}{{\rm{V}}_y}{{\rm{O}}_z} + \left( {2d - 2c} \right){\rm{e}} = \,\,{\rm{C}}{{\rm{a}}_{\left( {x - c} \right)}}{V_{\left( {y - a} \right)}}{{\rm{O}}_{\left( {z - b - d} \right)}} + {{\rm{V}}_a}{{\rm{O}}_b} + c{\rm{C}}{{\rm{a}}^{2 + }} + d{{\rm{O}}^{2 - }}\quad ,$$
 $$2{\rm{C}}{{\rm{a}}_{\left( {x - c} \right)}}{{\rm{V}}_{\left( {y - a} \right)}}{{\rm{O}}_{\left( {z - b - d} \right)}} + {2_{\left( {z - b - d - x + c} \right)}}{\rm{e}} = 2\left( {y - a} \right)V + \left( {x - c} \right){\rm{C}}{{\rm{a}}^{2 + }} + \left( {z - b - d} \right){{\rm{O}}^{2 - }}\quad ,$$
 $${{\rm{V}}_a}{{\rm{O}}_b} + 2\left( {b - f} \right){\rm{e}} = {{\rm{V}}_a}{{\rm{O}}_f} + \left( {b - f} \right){{\rm{O}}^{2 - }}\quad ,$$
 $${\rm{2}}{{\rm{V}}_a}{{\rm{O}}_b} + 2\left( b \right){\rm{e}} = 2a{\rm{V}} + b{{\rm{O}}^{2 - }}\quad ,$$
 $${\rm{2}}{{\rm{V}}_a}{{\rm{O}}_f} + 2\left( f \right){\rm{e}} = 2a{\rm{V}} + f{{\rm{O}}^{2 - }}\quad ,$$
Reactions (1) and (2) represent to the peak a, shows the initial reaction of the calcium ions to form a perovskite embedded (e.g., CaVO3) process, however due to relatively high reduction potential which was applied, the perovskite can only be reduced to vanadium suboxide (e.g., VO, V16O3, VO0.2, and so on), it should be noted that the electrolysis was using a large reference electrode, the electrolysis reduction potential which was a little different from cyclic voltammetry with small reference electrode, so vanadium could be detected from the electrolysis product at −0.4 V. Reactions (3)–(5) were corresponded to the peak b, the perovskite and intermediates (vanadium suboxide) was reduced to metal, when the potentials were −0.6 and −0.8 V, the detection the Ca content was more similar, indicating the continuation of reduction of low vanadium oxide oxygen (4) in peak b interval. Reaction (6) was attributable to peak c, a small amount of residual dissolved oxygen of solid vanadium continued to prolapse in situ.
C. Study of electrolysis and alloying proportion of V–20Ti alloy prepared by molten salt
As a titanium-base alloy, V–20Ti alloy (mass proportion ratio of the elements V:Ti = 4:1) has important application prospects, as the reaction mechanism and the electrolytic reduction dynamical properties of TiNi and TiAl alloys has been discussed in the our former work before, Reference Li, Wang, Li, Cheng and Jiang35 so in this section, the effect of different potentiostatic on the V–20Ti alloy product morphology and V/Ti ratio of the products was discussed as follows:
1. Analysis of potentiostatic electrolysis curve on V–20Ti alloy
The electrolysis current–time curve of V2O3–TiO2 in molten CaCl2 at 900 °C at 3.0 V, 10 h was shown in Fig. 7, the details of former 60 min electrolysis were shown in the inset figure: (i) at about 1 min the first inflection point was appeared, the current time is about 3.6 A; (ii) the second inflection point occurred at about 4 min, when the current was about 2 A; (iii) the third inflection point occurred at about 18 min or so, the electrolysis current descended with time at about 6–7 h and then reduced to 600 mA. Compared to separately electrolysis of V2O3 and TiO2 under the same conditions, the differences of current–time curves were: (i) the current value at an initial stage and an intermediate reaction stage (<300 min) was between the two oxides, and the reaction background current was similar to TiO2; (ii) there was the evidence of these three current platforms, which could be corresponding to different alloying reduction processes. The conductivity of the test piece was remarkably improved probably due to a large number perovskite from V2O3 and rapid reduction to metal vanadium or low-valent vanadium oxide initially, and the latter may be extrusion of dissolved oxygen from titanium suboxides of titanium-based solid-phase. From the current–time curve integration data, the total power consumption, current efficiency, and energy consumption were 6.44 A h within 10 h, 26.4%, and 19.45 kW h/kg-V20Ti, respectively. Which were shown that the preparation of vanadium–titanium was of a low-cost, low-power consumption, and new method with greater prospect for development.
2. Analysis of potentiostatic electrolysis at different voltages and temperatures on V–20Ti alloy
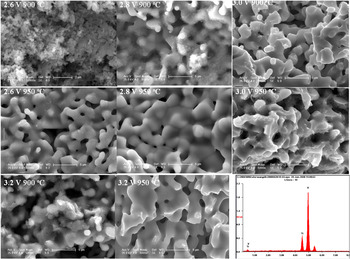
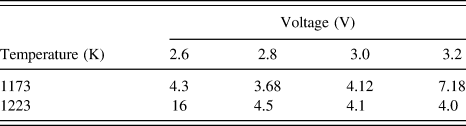
The SEM images of electrolysis products of V2O3–TiO2 mixed oxides at different voltages (2.6, 2.8, 3.0, and 3.2 V, 10 h, 900, and 950 °C) were shown in Fig. 8, a world of difference could be seen in the morphology due to distinctions of the component content in electrolysis products: when the reaction temperature was at 900 °C, as the reaction voltage increasing, the product particles becomes larger and larger in size, from 2.6 V (200 nm) to 3.2 V (the micrometer level), and the particle rooms from dispersed state to the sinteredly reunion together. When the reaction temperature was at 950 °C, compared with 900 °C electrolysis of the product, all the products can be found sintered together under different potentials electrolysis, when the voltage was risen to 3.2 V, the particle size was growing slightly larger. Figure 8(i) was the electrolysis products EDX spectra at 950 °C, 3.2 V, in addition to V and Ti peaks could be found in spectra, the other peaks were almost imperceptible. The V/Ti ratio of electrolysis products mixed was shown at different voltages, 900 and 950 °C in Table III, which can be seen from the table. The most appropriate V/Ti ratio of product was achieved at 950 °C, 3.0 and 3.2 V. In summary, to get a pure vanadium and titanium, the experimental conditions including the reaction temperature and electrolysis voltage must be increasing and elevated, respectively.
Typical SEM and EDX (3.2 V, 1223 K) images of the products from potentiostatic electrolysis of porous V2O3–TiO2 mixture pellets in molten CaCl2 under the indicated cell voltage.

V/Ti ratio of products from potentiostatic electrolysis of porous V2O3–TiO2 mixture pellets in molten CaCl2 under the indicated cell voltage at different temperatures.

3. Analysis of potentiostatic electrolysis at different times on V–20Ti alloy
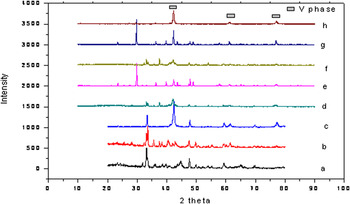
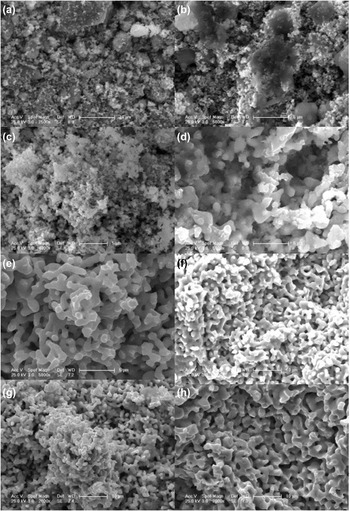
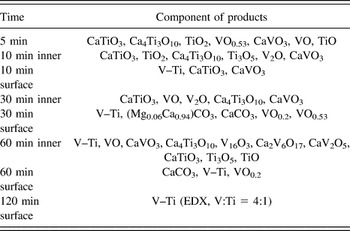
As discussed in the previous section above, when the electrolysis voltage was at 3.2 V the decomposition of molten CaCl2 would cause the precipitation of Ca, otherwise, EDX measurement errors should be taking into account, cell voltage of 3.0 V, reaction temperature of 950 °C and the electrolysis time of 5, 10, 30, 60, 120, 180, 300, 480, 900 min were selected for the potentiostatic electrolysis. When the product with electrolysis time exceeds 120 min a relatively hard metal is formed and the content ratio of product can be carried out through EDX analysis. The following table shows the product XRD, SEM, and EDX analysis results: XRD patterns of the products, SEM and EDX analysis of photographs were shown in Figs. 9 and 10, Tables IV, and V. We can find that as electrolysis time was changing, the features and compositions of the products was different and complex, the main mechanisms of reactions were concluded as follows:
-
(i) for 5 min electrolysis, products are mainly CaTiO3, Ca4Ti3O10, TiO2, VO0.53, CaVO3, VO, TiO, other vanadium suboxide, titanium suboxide, and perovskite compounds and so on. SEM photograph [Fig. 10(a)] showed that the reactants aggregated into different and featureless particles and some particles combined into many pieces. It may be because the reduction reaction occurred mainly in the surface layer, and the rate of the 3PI expanded vertically to the inner layer was low; further more the calcium ion intercalation and the reduction of reaction were also affected by concentration ohmic polarization, therefore some of TiO2 was not perovskited or reduced to suboxide, then the feature of product mixture was a black powder.
-
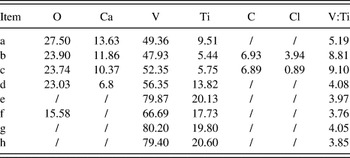
(ii) The inner products of electrolysis for 10 min were mainly CaTiO3, TiO2, Ca4Ti3O10, Ti3O5, V2O, CaVO3, etc. which can be seen from Fig. 10(b), compared with the product of electrolysis with 5 min, more blocks of large aggregates was observed and the metal or alloy particles was not clear, the presence of TiO2 still in the products at this stage showed that expand of the three-phase vertically through the inner layer was still limited to a certain depth, and from the results of EDX, the oxygen content decreased from 27.50 to 23.90%, as well as the calcium content decreased, corresponding to perovskite Ca x TiO y and Ca x VO y reduction, and detected CaCO3 could be formed from its product CaO and CO2 in the molten salt. The EDX results of each element content between outer and inner product of electrolysis for 10 min were similar, vanadium appearing in the products phase showed that rapid formation of the metal phase at three-phase boundary. As can be seen from Fig. 10(c), the product particles are relatively thin in outer layer, well-distributed, and no large particles existed.
-
(iii) When the electrolysis time reached to 120 min, as can be seen from the EDX results. calcium content of the inner product continued to decrease, while the titanium content was increasing on the contrary, SEM image [Fig. 10(d)] shows different particle dispersion prior to the morphology of electrolysis products, sintered product has shown its form large particles. As for the outer layer of the product, EDX analysis [Table V(e)] showed the product to have been detected in the presence of O and Ca, the V/Ti ratio of 3.97, this ratio is very close to the target product ratio (V/Ti = 4), the product showed a more regular morphology typical nodular particles, the metal particles into larger aggregates (3–5 μm).
-
(iv) when the electrolysis time reached 180 min, Ca element was not detected in the inner product, the oxygen content is decreased, for the outer product, which was similar to product of electrolysis time of 120 min, the resulting EDX analysis [Table V(g)] showed the product to have been detected in the absence of O and Ca, its V/Ti ratio was 4.05, indicating that when the reaction time was 120 min or more, the outer layer of the product can form the alloy target ratio. From Figs. 10(f) and 10(g) which could be seen that the inner and outer product's morphology was similar to Fig. 10(e), all particles were typical and nodular aggregates.
-
(v) The presence of oxygen of inner part was not detected at electrolysis EDX analysis [Table V(h)] until 900 min, then the whole test piece was completely reduced, the V/Ti ratio close to the target value of 3.85, the particle size products became large was due to sintering at a high temperature for a long time in electrolysis.
XRD patterns of the products from electrolysis (3.0 V, 1223 K) of porous V2O3–TiO2 mixture pellets in molten CaCl2 (a) 5 min powders; (b) 10 min inner part; (c) 10 min surface; (d) 30 min inner part; (e) 30 min surface; (f) 60 min inner part; (g) 60 min surface; (h) 120 min surface.

SEM images of the products from electrolysis (3.0 V, 1223 K) of porous V2O3–TiO2 mixture pellets in molten CaCl2. (a) 5 min powders; (b) 10 min inner part; (c) 10 min surface; (d) 120 min inner part; (e) 120 min surface; (f) 180 min inner part; (g) 180 min surface; (h) 900 min inner part.

Component analysis of the products from electrolysis (3.0 V, 1223 K) of porous V2O3–TiO2 mixture pellets in molten CaCl2.

EDX data of the products from electrolysis (3.0 V, 1223 K) of porous V2O3–TiO2 mixture pellets in molten CaCl2 (“/” indicates for “not detected”). (a) 5 min powders; (b) 10 min inner part; (c) 10 min surface; (d) 120 min inner part; (e) 120 min surface; (f) 180 min inner part; (g) 180 min surface; (h) 900 min inner part.

In summary, electrolysis of mixed oxides to V–20Ti alloy experienced the following processes: (i) product stratification, metal vanadium was quickly generated at a short time to the surface, the inner layer is mainly perovskite or partial reduction of metal suboxides, as time went on, electrolysis phase expanded vertically from boundary layer to the inside, the inner layer of the product contained the CaTiO3, TiO, Ca4Ti3O10, Ti3O5, V2O, CaVO3, and other phases, when the reaction time was 120 min or more, the outer layer of the products at target ratio of the alloy can be formed, as electrolysis time extended to achieve the overall reaction reduction is completed.
IV. SUMMARY
Electroreduction of solid V2O3 pellets to V in molten CaCl2 at 900 °C has been studied by cyclic voltammetry and potentiostatic electrolysis, together with SEM, EDX, and elemental analyses. The current efficiency and energy consumption were satisfactory. Moreover, the V–20Ti alloys were electrochemically synthesized by constant voltage electrolysis, the control of composition as well as the reduction optimization of the mixtures were demonstrated.
ACKNOWLEDGMENTS
We acknowledge the financial support from the National Natural Science Foundation of China (Grant Nos. 21303045 and 21173161), Natural Science Foundation of Hubei Province (2014CFA527), 2014 Young Talents Development Plan of Hubei Province, Wuhan Chenguang Project (2015070404010212). We thank the Center for Electron Microscopy at Wuhan University for helps in taking the TEM and high-resolution TEM images for the materials.