Introduction
Kawasaki disease is an acute self-limited vasculitis of childhood, characterised by inflammation of small-and medium-sized vessels and most often seen in children younger than five years. Reference McCrindle, Rowley and Newburger1 It remains a major cause of acquired heart disease among children. Reference Goel and Yalcindag2 The prognosis of Kawasaki disease is generally favourable after standard treatment. However, persistent inflammation and vascular endothelial injury may lead to cardiovascular complications in some children, especially coronary artery lesions, which can have long-term clinical consequences. Reference Lifeng, Danyan and Suyuan3 In patients with severe coronary involvement, complications may include coronary artery aneurysm, stenosis, thrombosis, myocardial infarction, and, in rare cases, sudden death. Reference McCrindle, Rowley and Newburger1 Given its potential cardiovascular sequelae, Kawasaki disease remains a clinically important disease in paediatrics and paediatric cardiology. Although its exact cause has not been established, Kawasaki disease is thought to arise from an aberrant immune response to unidentified infectious or environmental factors in children with genetic susceptibility. Reference Onouchi4 Overactivation of the inflammatory response may contribute to vascular wall injury, endothelial dysfunction, and immune-mediated vasculitis, which together increase the likelihood of coronary involvement. Reference Rife and Gedalia5 For this reason, Kawasaki disease should not be viewed simply as a transient febrile illness. Its clinical importance lies largely in the early identification of children at high risk of cardiovascular injury, especially coronary complications.
Coronary involvement remains one of the most clinically important complications of Kawasaki disease and often affects treatment planning. It may present as early coronary artery dilatation, coronary artery aneurysm, or other coronary arterial abnormalities. Even with the routine use of intravenous immunoglobulin, coronary artery lesions continue to occur in a subset of children with Kawasaki disease. Reference Newburger, Takahashi and Beiser6 In children at high risk, failure to recognise coronary involvement early may delay intensified surveillance, adjustment of treatment, and referral to specialised care. These delays may worsen cardiovascular outcomes. Thus, early prediction and risk stratification of coronary complications remain important in the clinical management of Kawasaki disease.
Children with Kawasaki disease are often first seen and initially managed in primary healthcare settings, where follow-up may also be provided after discharge. However, these institutions may have limited paediatric critical care resources, less experience with paediatric echocardiography, and weaker multidisciplinary support. This can make early recognition of children at high risk for coronary complications difficult. Risk stratification early in the disease course, using readily available clinical and laboratory data, may help clinicians recognise children at increased risk of coronary involvement. These patients could be referred earlier to specialised centres with paediatric intensive care facilities, paediatric cardiology services, and resuscitation support. In this way, care for critically ill children may be better coordinated, and the impact of delayed diagnosis and treatment may be reduced. A risk-based approach may allow more tailored follow-up and more efficient use of medical resources in Kawasaki disease. Patients at low risk could be managed with routine treatment and follow-up, whereas those at high risk may benefit from closer clinical observation, repeated echocardiographic evaluation, intensified inpatient monitoring, and early specialist involvement. Such a strategy may improve referral coordination between primary and tertiary institutions and support more efficient care delivery. In this study, we combined clinical and laboratory data from children with Kawasaki disease to identify predictors of coronary complications and establish an early risk prediction model. The goal was to provide a practical tool for individualised risk estimation during the early treatment course and to support post-intravenous immunoglobulin reassessment, echocardiographic surveillance, and specialist referral when appropriate.
Methods
Study design and participants
Children diagnosed with acute-phase Kawasaki disease at the Affiliated Hospital of Nantong University between March 2023 and June 2026 were retrospectively included in this study. Inclusion criteria: Eligible patients were children with a confirmed diagnosis of Kawasaki disease who had complete clinical and routine laboratory data for calculation of the candidate predictors, including the systemic immune-inflammation index and the C-reactive protein/albumin ratio. They were also required to have echocardiographic data sufficient to assess coronary artery lesions, defined as early coronary artery dilatation and/or coronary artery aneurysm. Exclusion criteria: Patients were excluded if they had incomplete records or missing key laboratory results, pre-existing CHD or other structural cardiovascular abnormalities, severe concomitant immune or infectious conditions that might confound inflammatory evaluation, or insufficient follow-up echocardiographic data to determine coronary outcomes. The primary outcome was the presence of echocardiographically detected coronary artery lesions, defined as coronary artery dilatation and/or coronary artery aneurysm. The outcome represented early structural coronary abnormalities detected by echocardiography and did not include clinical cardiovascular events such as coronary thrombosis, aneurysm rupture, myocardial infarction, or death. All patients received standardised treatment for Kawasaki disease according to the clinical guidelines, including initial intravenous immunoglobulin therapy and aspirin. Transthoracic echocardiography was performed according to a standardised institutional protocol within ten days of fever onset, two weeks after the first intravenous immunoglobulin administration, and four to six weeks after disease onset. To ensure consistency of outcome assessment, coronary artery lesions were determined exclusively from the echocardiographic examination performed at four to six weeks after disease onset. Echocardiographic findings obtained before and after intravenous immunoglobulin treatment were not combined for outcome classification. No echocardiographic parameter was included as a predictor in the nomogram; echocardiography was used solely to determine the presence or absence of coronary artery lesions. The patients were randomly allocated to a training set and an internal validation set in a 7:3 ratio. Model development was performed in the training set, and model performance was assessed in the validation set. No significant differences were found between the two sets in key demographic features, clinical presentations, laboratory findings, or coronary artery lesion incidence, indicating good baseline balance. Ethical approval: This retrospective cohort study was approved by the Institutional Ethics Committee of Affiliated Hospital of Nantong University (Approval No. 2026 K203-01).
Preliminary exploration of the nonlinear relationship of age
An XGBoost model was first fitted in the training cohort and interpreted with SHapley Additive exPlanations to assess potential nonlinear relationships between continuous predictors and coronary artery lesions. The relationship between age and coronary artery lesion risk was further examined using a SHapley Additive exPlanations dependence plot with Lowess smoothing. An exploratory U-shaped pattern was observed. To preserve this data-derived nonlinear effect while maintaining clinical interpretability, age was categorised into three groups in the subsequent regression models: <17 months, 17–58 months, and >58 months.
Elastic net stability analysis
Before constructing the nomogram, elastic net regression was performed on the predictors identified by multivariable logistic regression to examine the stability of variable selection. The optimal penalty parameter was determined by 10-fold cross-validation. Coefficient path plots and cross-validation error curves were used to assess variable retention under penalisation and the balance between model fit and complexity. This regularised regression analysis was used as a supplementary assessment of the final predictor combination.
Nomogram construction and model evaluation
Using the predictors identified in the multivariable logistic regression model and further supported by elastic net analysis, we constructed a clinical nomogram to estimate the probability of coronary artery lesions for individual patients. The final nomogram included sex, age group, fever duration, systemic immune-inflammation index, C-reactive protein/albumin ratio, and intravenous immunoglobulin resistance, as shown in Figure 3. To apply the nomogram, the value or category of each predictor is first located on its corresponding axis. A vertical line is then drawn upward to the “Points” axis to determine the score assigned to that predictor. The six individual scores are summed to obtain the total points, which are subsequently located on the “Total Points” axis and projected downward to the probability axis to estimate the individual risk of coronary artery lesions. Because the nomogram is a graphical tool, manually derived scores and probabilities should be regarded as approximate values. Model performance was evaluated in the training and validation cohorts separately. Discrimination was measured by receiver operating characteristic analysis and area under the curve. Calibration plots were used to assess the agreement between predicted and observed coronary artery lesion risks. Decision curve analysis was used to examine whether the model provided clinical net benefit across different threshold probabilities.
Post hoc interpretability analysis of the final model
To further interpret the final nomogram, we conducted a post hoc machine-learning analysis focused on variable importance and effect direction. An XGBoost model was refitted with the same predictors used in the nomogram, and SHapley Additive exPlanations beeswarm plots were generated. The mean absolute SHapley Additive exPlanations value was calculated for each predictor to estimate global importance and was normalised to show its relative contribution. The beeswarm plot illustrated the ranking of predictors and the direction of their influence on the predicted probability of coronary artery lesions. This analysis was performed only for supplementary interpretation and did not affect variable selection or nomogram construction.
Statistical analysis
Continuous variables were compared between groups using the independent-samples t-test or the Mann–Whitney U test, as appropriate. Categorical variables were compared using the χ2 test or Fisher’s exact test. All tests were two-sided, and P < 0.05 was considered statistically significant.
Results
Baseline characteristics and cohort partitioning
Among the 216 children with Kawasaki disease included in this study, 46 (21.3%) developed coronary artery lesions, and 170 (78.7%) did not (Table 1). Children in the event group were more frequently male, were younger, and had a longer fever duration than those without coronary artery lesions. They also had evidence of stronger systemic inflammation and impaired nutritional status, including higher white blood cell counts, neutrophil percentage, platelet counts, systemic immune-inflammation index, C-reactive protein levels, and C-reactive protein/albumin ratio, together with lower albumin levels. Intravenous immunoglobulin resistance was observed more often in the event group. Using stratified random sampling at a 7:3 ratio, 151 patients were assigned to the training cohort and 65 to the validation cohort. No significant differences were found between the two cohorts in key demographic features, clinical manifestations, laboratory indicators, or coronary artery lesion rates, indicating good baseline balance (Table 2).
Baseline characteristics of the study cohort according to coronary artery lesions status

Table 1. Long description
A table comparing baseline characteristics of children with Kawasaki disease based on coronary artery lesions status. The table has 216 rows and 46 columns. Column headers include Variable, Total (N = 216), CALs (n = 46), Non-CALs (n = 170), and P-value. Row labels include variables such as Sex, Age, Weight, Height, BMI, Fever duration, Rash, Conjunctival injection, Strawberry tongue, and more. Each row provides mean values, percentages, and standard deviations for each variable across the total population, those with coronary artery lesions (CALs), and those without (Non-CALs), along with P-values indicating statistical significance. Notable trends include higher percentages of males, younger age, longer fever duration, and higher levels of inflammation markers in the CALs group compared to the Non-CALs group.
Baseline demographic, clinical, and laboratory characteristics of the study cohort stratified by coronary artery lesions. Coronary artery lesions were defined as early coronary dilation and/or coronary aneurysm. Continuous variables are presented as mean ± standard deviation or median (interquartile range), as appropriate, and categorical variables are presented as number (percentage). P values were calculated to compare patients with and without coronary artery lesions.
CALs = coronary artery lesions; BMI = body mass index; WBC = white blood cell; NLR = neutrophil-to-lymphocyte ratio; PLT = platelet count; HCT = haematocrit; MCV = mean corpuscular volume; MCH = mean corpuscular haemoglobin; MPV = mean platelet volume; PDW = platelet distribution width; SII = systemic immune-inflammation index; CRP = C-reactive protein; ESR = erythrocyte sedimentation rate; PCT = procalcitonin; Alb = albumin; FIB = fibrinogen; PT = prothrombin time; APTT = activated partial thromboplastin time; INR = international normalised ratio; IVIG = intravenous immunoglobulin.
Comparison of full-variable characteristics between the training and validation cohorts

Table 2. Long description
The table compares characteristics of children with Kawasaki disease between training and validation cohorts. It has 216 rows and 45 columns. Column headers include Variable, Total (N = 216), Training set (n = 151), Validation set (n = 65), and P-value. Row labels include various demographic, clinical, and laboratory indicators. Notable indicators include sex, age, weight, height, BMI, fever duration, rash, conjunctival injection, strawberry tongue, hard edema of hands/feet, cervical lymphadenopathy, BCC scar redness, WBC count, neutrophil percentage, lymphocyte percentage, neutrophil count, lymphocyte count, NLR ratio, haemoglobin, platelet count, haematocrit, MCV, MCH, MPV, PDW, SII, CRP, ESR, PCT, CRP/Alb ratio, albumin, total bilirubin, serum sodium, serum potassium, D-dimer, FIB, PT, APTT, INR, IL-6, IgA, IgG, IgM, C3, C4, urine protein, urine WBC, IVIG resistance, and coronary artery aneurysm. Each row provides data for the total number of children, training set, validation set, and P-value for comparison.
Comparison of demographic, clinical, laboratory, and treatment-related characteristics between the training cohort and the validation cohort. Continuous variables are presented as mean ± standard deviation or median (interquartile range), as appropriate, and categorical variables are presented as number (percentage). P values were used to assess differences between the two cohorts. The lack of significant between-cohort differences indicates good baseline comparability between the training and validation sets.
CALs = coronary artery lesions; BMI = body mass index; WBC = white blood cell; NLR = neutrophil-to-lymphocyte ratio; PLT = platelet count; HCT = haematocrit; MCV = mean corpuscular volume; MCH = mean corpuscular haemoglobin; MPV = mean platelet volume; PDW = platelet distribution width; SII = systemic immune-inflammation index; CRP = C-reactive protein; ESR = erythrocyte sedimentation rate; PCT = procalcitonin; Alb = albumin; FIB = fibrinogen; PT = prothrombin time; APTT = activated partial thromboplastin time; INR = international normalised ratio; IVIG = intravenous immunoglobulin.
Nonlinear age pattern and univariate analysis
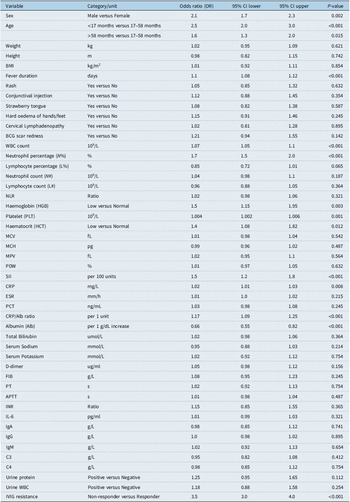
Before developing the prediction model, SHapley Additive exPlanations dependence analysis suggested a U-shaped association between age and coronary artery lesion risk. Age was therefore categorised into three groups: <17 months, 17–58 months, and >58 months (Figure 1). Univariate logistic regression identified male sex, age group, fever duration, white blood cell count, neutrophil percentage, low haemoglobin, platelet count, low haematocrit, systemic immune-inflammation index, C-reactive protein, C-reactive protein/albumin ratio, albumin, and intravenous immunoglobulin resistance as factors associated with coronary artery lesions (Table 3).
SHapley Additive exPlanations dependence plot of age in relation to Coronary artery lesions. The SHapley Additive exPlanations dependence plot illustrates the nonlinear relationship between age and its contribution to predicted Coronary artery lesions risk. Each point represents an individual patient. The red solid line shows the Lowess-smoothed trend, and the shaded band represents the corresponding trend envelope. The horizontal dashed line at SHapley Additive exPlanations = 0 indicates the shift from negative to positive contributions to predicted risk. The vertical dashed lines mark the data-driven inflection points at 17 and 58 months, which were used to categorise age as <17 months, 17–58 months, and >58 months. The plot suggests a U-shaped age-risk pattern, supporting the use of these age groups in the subsequent regression models.

Univariable logistic regression analysis of factors associated with coronary artery lesions

Table 3. Long description
The table presents a univariate logistic regression analysis of factors associated with coronary artery lesions. It includes 42 rows and 7 columns. The columns are labeled Variable, Category/unit, Odds ratio (OR), 95% CI lower, 95% CI upper, and P-value. The variables include sex, age, weight, height, BMI, fever duration, rash, conjunctival injection, strawberry tongue, hard oedema of hands/feet, cervical lymphadenopathy, BCG scar redness, WBC count, neutrophil percentage, lymphocyte percentage, neutrophil count, lymphocyte count, NLR, haemoglobin, platelet count, haematocrit, MCV, MCH, MPV, PDW, SII, CRP, ESR, PCT, CRP/Alb ratio, albumin, total bilirubin, serum sodium, serum potassium, D-dimer, FIB, PT, APTT, INR, IL-6, IgA, IgG, IgM, C3, C4, urine protein, urine WBC, and IVIG resistance. Each row lists the odds ratio, 95% confidence interval lower and upper bounds, and P-value for each variable.
Univariable logistic regression analysis evaluating the associations between candidate demographic, clinical, laboratory, and treatment-related variables and coronary artery lesions. Odds ratios, 95% confidence intervals, and P values are presented for each variable. Coronary artery lesions were defined as early coronary dilation and/or coronary aneurysm. For categorical variables, the indicated reference category was used for comparison. For continuous variables, odds ratios represent the effect per unit increase unless otherwise specified.
OR = odds ratio; CI = confidence interval; BMI = body mass index; WBC = white blood cell; NLR = neutrophil-to-lymphocyte ratio; PLT = platelet count; HCT = haematocrit; MCV = mean corpuscular volume; MCH = mean corpuscular haemoglobin; MPV = mean platelet volume; PDW = platelet distribution width; SII = systemic immune-inflammation index; CRP = C-reactive protein; ESR = erythrocyte sedimentation rate; PCT = procalcitonin; Alb = albumin; FIB = fibrinogen; PT = prothrombin time; APTT = activated partial thromboplastin time; INR = international normalised ratio; IVIG = intravenous immunoglobulin.
Multivariable analysis, elastic net validation, and nomogram construction
Multivariable logistic regression identified male sex, age group, fever duration, systemic immune-inflammation index, C-reactive protein/albumin ratio, and intravenous immunoglobulin resistance as independent predictors of coronary artery lesions (Figure 2). Male sex, age < 17 months, age > 58 months, longer fever duration, higher systemic immune-inflammation index, higher C-reactive protein/albumin ratio, and intravenous immunoglobulin resistance were each associated with increased risk. After adjustment, white blood cell count, neutrophil percentage, low haemoglobin, platelet count, low haematocrit, C-reactive protein, and albumin were no longer statistically significant. In the elastic net analysis, the coefficients of most candidate variables decreased toward zero with increasing penalisation. The variables retained by elastic net were broadly consistent with the predictors selected by multivariable logistic regression, suggesting that the final variable set was stable (Figure S1). A nomogram was then constructed using these predictors to estimate the probability of coronary artery lesions for individual patients (Figure 3). The practical use of the nomogram is illustrated in Figure S2. For example, a female patient aged < 17 months with an systemic immune-inflammation index of 443.72, a C-reactive protein/albumin ratio of 1.07, a fever duration of 5 days, and intravenous immunoglobulin resistance would receive approximately 0, 47, 54, 6, 21, and 55 points for systemic immune-inflammation index, C-reactive protein/albumin ratio, fever duration, age group, sex, and intravenous immunoglobulin resistance, respectively. The resulting total score of approximately 183 points corresponds to an estimated probability of coronary artery lesions of approximately 35%.
Forest plot of the multivariable logistic regression model for CALs. Adjusted odds ratios (aORs) and 95% confidence intervals are shown for all variables included in the multivariable model, including sex, age group, fever duration, WBC count, neutrophil percentage, haemoglobin, platelet count, haematocrit, SII, CRP, CRP/Alb ratio, albumin, and IVIG resistance. Variables with 95% confidence intervals excluding 1.0 were regarded as independently associated with CALs. In the final model, male sex, age < 17 months, age > 58 months, longer fever duration, higher SII, higher CRP/Alb ratio, and IVIG resistance were identified as independent predictors.

Nomogram for estimating the risk of Coronary artery lesions in Kawasaki disease. This nomogram was constructed from the final multivariable logistic regression model and includes six predictors: SII, CRP/Alb ratio, fever duration, IVIG resistance, age group, and sex. Each variable contributes a specific number of points according to its model coefficient. The sum of these points gives the total score, which is then projected onto the bottom scale to estimate the probability of Coronary artery lesions. Higher total scores correspond to higher predicted risk.

Model performance and post hoc interpretability analysis
The final nomogram showed stable performance in both the training and validation cohorts. Receiver operating characteristic analysis yielded area under the curve of 0.835 (95% CI, 0.804–0.867) and 0.818 (95% CI, 0.767–0.869), respectively, indicating good discrimination in the development cohort and preserved performance in the internal validation cohort (Figure 4A). Calibration plots showed good agreement between predicted and observed coronary artery lesion risks (Figure 4B). Decision curve analysis further supported the potential clinical benefit of the model across a range of threshold probabilities (Figure 4C). A post hoc XGBoost-SHAP analysis was then conducted using the same predictors included in the nomogram (Figure 5). In the SHapley Additive exPlanations beeswarm plot, systemic immune-inflammation index, C-reactive protein/albumin ratio, and fever duration showed the largest contributions among the continuous predictors. Age, intravenous immunoglobulin resistance, and sex also contributed to model prediction. Higher systemic immune-inflammation index, higher C-reactive protein/albumin ratio, and longer fever duration were mainly associated with positive SHapley Additive exPlanations values, suggesting an increase in predicted coronary artery lesion risk. Intravenous immunoglobulin resistance and male sex also contributed in the same direction. Overall, the SHapley Additive exPlanations results were consistent with the directions of effect observed in the multivariable regression analysis and reflected in the nomogram.
Discrimination, calibration, and decision curve analysis of the nomogram. ( a ) Receiver operating characteristic curves for the training and validation cohorts. The nomogram showed good discrimination, with area under the curve of 0.835 (95% CI, 0.804–0.867) and 0.818 (95% CI, 0.767–0.869), respectively. ( b ) Calibration curves for the training and validation cohorts. The diagonal dashed line indicates ideal agreement between predicted and observed Coronary artery lesions probabilities. Patients were divided into deciles according to predicted risk. Each point represents one risk decile, plotted by mean predicted probability and observed event rate. The solid lines show the fitted calibration trends, and the shaded bands represent bootstrap-derived confidence intervals. ( c ) Decision curve analysis for the training and validation cohorts. The nomogram showed positive net benefit over a range of threshold probabilities compared with the “treat all” and “treat none” strategies.

Figure 4. Long description
Panel A: A receiver operating characteristic curve graph shows the true positive rate against the false positive rate for both the training and validation cohorts. The training set is represented by a red line with an area under the curve of 0.835, while the validation set is shown by a blue line with an area under the curve of 0.818. The shaded areas around the lines indicate confidence intervals. Panel B: A calibration curve graph plots the predicted probability on the x-axis against the observed proportion on the y-axis for both the training and validation cohorts. The training set is marked with red circles and a solid red line, while the validation set is marked with blue circles and a solid blue line. The diagonal dashed line represents ideal agreement. The shaded bands around the lines show bootstrap-derived confidence intervals. Panel C: A decision curve analysis graph displays the net benefit on the y-axis against the threshold probability on the x-axis for both the training and validation cohorts. The training set is shown by a red line, and the validation set is shown by a blue line. The dashed lines represent the ’treat all’ and ’treat none’ strategies.
SHapley Additive exPlanations-based post hoc interpretation of the final nomogram. SHapley Additive exPlanations analysis was applied to the six predictors retained in the final nomogram. The Nightingale rose chart on the left presents the normalised relative contribution of each predictor, calculated from mean absolute SHapley Additive exPlanations values. SII, CRP/Alb ratio, and fever duration had the largest contributions. The SHapley Additive exPlanations beeswarm plot on the right shows how each predictor contributed to model prediction across individual patients. Each dot represents one patient, and the colour scale indicates the original feature value from low (blue) to high (red). Positive SHapley Additive exPlanations values indicate higher predicted Coronary artery lesions risk, whereas negative values indicate lower predicted risk. Higher SII, higher CRP/Alb ratio, longer fever duration, IVIG resistance, male sex, and age at the younger or older extremes were mainly associated with positive SHapley Additive exPlanations values, consistent with their roles in the nomogram.

Discussion
Using data from 216 children with Kawasaki disease in a single-centre retrospective cohort, we developed a clinical model to predict coronary artery lesions and constructed a nomogram for individualised risk assessment. The final model retained male sex, age group, fever duration, systemic immune-inflammation index, C-reactive protein/albumin ratio, and intravenous immunoglobulin resistance. Age was not linearly associated with coronary artery lesion risk; instead, a U-shaped pattern was observed, with higher risk in children younger than 17 months and older than 58 months than in those aged 17–58 months. The nomogram showed good discrimination, calibration, and clinical net benefit in the training and validation cohorts. These results support its potential use as an early risk-stratification tool for coronary involvement in children with Kawasaki disease. Post hoc SHapley Additive exPlanations analysis showed that the systemic immune-inflammation index, C-reactive protein/albumin ratio, and fever duration made the largest contributions to model output. This finding suggests that both the intensity and duration of inflammation are important for assessing the risk of coronary injury in Kawasaki disease. Recent American Heart Association updates and related risk-modelling studies have also emphasised that, although intravenous immunoglobulin has markedly improved outcomes, predicting coronary complications remains a key issue in Kawasaki disease management. Reference Jone, Tremoulet and Choueiter7 Meanwhile, nomogram-and machine-learning-based models for coronary artery lesion and coronary artery aneurysm are still being refined. Reference Hu, Yan and Song8–Reference Duan, Chen and Cheng10
The individual predictors retained in the final model are not entirely novel, as sex, fever duration, systemic inflammatory markers, the C-reactive protein/albumin ratio, systemic immune-inflammation index, and intravenous immunoglobulin resistance have previously been associated with coronary involvement in Kawasaki disease. Therefore, the principal contribution of the present study does not lie in identifying previously unrecognised risk factors. Rather, it lies in integrating routinely available clinical and laboratory variables into an individualised nomogram and combining conventional regression with explainable machine-learning methods. Specifically, XGBoost-SHapley Additive exPlanations dependence analysis was used to explore the nonlinear association between age and coronary risk, rather than assuming a linear effect or applying only predefined age categories. The resulting risk pattern was subsequently translated into a clinically interpretable nomogram, while post hoc SHapley Additive exPlanations analysis further illustrated the relative contribution and direction of effect of each predictor. Thus, the added value of this study is primarily methodological and interpretive, providing an accessible risk-estimation tool with improved transparency. However, because previously published prediction models were not reconstructed and evaluated in the same cohort, the present study cannot establish statistical superiority or incremental discrimination over existing models.
A major finding of this study was that inflammation-related variables played a central role in coronary artery lesion prediction. The systemic immune-inflammation index and C-reactive protein/albumin ratio remained important across multivariable regression, nomogram scoring, and SHapley Additive exPlanations-based importance ranking. Fever duration also contributed consistently to increased risk. These findings are biologically plausible given the inflammatory basis of Kawasaki disease. Reference Shimizu, Pérez Pomares and Loy11 Kawasaki disease is an acute immune-mediated vasculitis that mainly affects medium-sized arteries. In this context, coronary injury is better understood as a manifestation of systemic inflammation, endothelial dysfunction, increased vascular permeability, and coagulation–immune dysregulation. Recent reviews on Kawasaki disease biomarkers have similarly noted that composite inflammatory indices, which capture several aspects of the host response, may offer better support for coronary artery lesion/coronary artery aneurysm risk stratification than individual laboratory parameters. Reference Kim, Son and Lee12,Reference Liao, Guo and Li13 The prominent role of the systemic immune-inflammation index in the present model appears biologically reasonable. Because it incorporates neutrophils, platelets, and lymphocytes, the systemic immune-inflammation index can capture several processes relevant to Kawasaki disease, including systemic inflammation, platelet–endothelial activation, and immune imbalance. This is supported by recent studies showing that the systemic immune-inflammation index is associated with coronary artery lesions in Kawasaki disease, Reference Huang, Peng, Zhang, Zhu and Fan14 as well as by a prospective study in 2021 reporting its potential value for predicting intravenous immunoglobulin resistance and cardiovascular complications. Reference Liu, Shao and Wang15 Although the systemic immune-inflammation index does not necessarily outperform the neutrophil-to-lymphocyte ratio in every clinical context, it has gained attention as a composite marker of systemic inflammation. In line with previous studies, our results showed that the systemic immune-inflammation index retained an independent association with coronary artery lesions in a multivariable model. This finding supports its potential role as a clinically useful marker of the combined inflammatory and vascular response in the acute phase of Kawasaki disease.
Besides the systemic immune-inflammation index, the C-reactive protein/albumin ratio was also retained as a key predictor in the present model. Previous studies have shown that children with Kawasaki disease who develop coronary artery lesion tend to have higher C-reactive protein/albumin ratios than those without coronary artery lesion. Increased C-reactive protein/albumin ratios have also been associated with higher risks of coronary artery lesion, coronary artery aneurysm, and intravenous immunoglobulin resistance. Reference Chih-Min, Hong-Ren, Kuo-Shu, Ying-Hsien and Ho-Chang16 A 2024 review of nutrition-related biomarkers also highlighted albumin, the C-reactive protein/albumin ratio, and PNI as potentially useful markers for predicting coronary artery lesion and intravenous immunoglobulin resistance. Reference Liu, Chen, Wang, Yu, Ai and Zhang17 C-reactive protein reflects the intensity of acute inflammation, whereas reduced albumin may be related to inflammatory consumption, capillary leakage, and systemic stress. In this context, the C-reactive protein/albumin ratio may capture both inflammatory burden and host reserve, making it a useful marker of disease severity in Kawasaki disease. Reference Wang, Ding and Zhang18 Longer fever duration was another factor that consistently increased predicted risk in the present model. This result is in line with previous studies. A 2024 systematic review identified fever persisting for more than 10 days as an independent risk factor for CA, Reference Morana, Guida and Andreozzi19 and earlier meta-analyses also considered delayed treatment and persistent fever to be warning signs for coronary involvement. Reference Yan, Pan, Sun, Tian and Li20 In Kawasaki disease, fever may be better understood as a clinical marker of ongoing acute vasculitic activity rather than a nonspecific symptom alone. In the present model, the systemic immune-inflammation index and C-reactive protein/albumin ratio mainly reflected inflammatory intensity, whereas fever duration reflected inflammatory persistence. Taken together, these variables may describe an inflammation-driven risk profile for coronary injury. This explanation is supported by the SHapley Additive exPlanations beeswarm plot, in which all three variables were among the leading contributors to model prediction.
Age was one of the more informative findings in the present study. Rather than assuming a linear effect, we used XGBoost-SHAP dependence analysis to examine the age-risk relationship and observed a U-shaped pattern, with inflection points at 17 and 58 months. When age was grouped according to these cutoffs, it remained a meaningful contributor in both the multivariable model and the nomogram. This suggests that the association between age and coronary risk in Kawasaki disease may be stage-specific, with increased risk at both younger and older ages. This interpretation may help integrate previous findings that appear inconsistent at first glance. Younger age, particularly <6 months or <18 months, has been repeatedly associated with coronary artery lesion/coronary artery aneurysm in prior studies and meta-analyses. At the same time, some studies have reported increased risk in older children, including a 2022 study that associated age > 36 months with coronary artery lesion progression. Reference Xia, Qiu and Wen21 A 2024 systematic review further supported age < 18 months as an independent risk factor. Reference Liu, Su and Yuan22 The U-shaped association observed in this study suggests that the reported higher risk in younger children and the persistent risk in older children may represent two parts of the same nonlinear age-risk relationship. In younger children, immune immaturity, atypical clinical presentation, and delayed recognition may increase susceptibility to coronary involvement. In older children, phenotypic heterogeneity, differences in disease presentation, and reduced clinical suspicion may contribute to renewed risk. These findings indicate that modelling age as a simple linear term may not fully capture its association with coronary complications in Kawasaki disease. Nevertheless, the cut-off points of 17 and 58 months were derived empirically from the present single-centre cohort and should be regarded as exploratory rather than universally applicable clinical thresholds. Their location may be influenced by the sample size, age distribution, population characteristics, treatment practices, and modelling procedure. External validation in larger and more heterogeneous cohorts, together with analyses retaining age as a continuous nonlinear variable, is required before these thresholds can be adopted for routine clinical decision-making.
In the present study, male sex remained independently associated with coronary artery lesions after multivariable adjustment, which is consistent with previous reports. A 2019 meta-analysis, a 2024 systematic review, and several recent studies have identified male sex as a relatively stable risk factor for coronary artery lesion/coronary artery aneurysm. Reference Morana, Guida and Andreozzi19,Reference Yan, Pan, Sun, Tian and Li20 The biological basis for the association between male sex and coronary risk has not been fully defined. Possible explanations include sex-related differences in immune responsiveness, inflammatory activity, and vascular remodelling. Although sex contributed less than inflammatory markers in the SHapley Additive exPlanations analysis, its effect direction remained consistent, suggesting that it may serve as a host-related modifier rather than a dominant driver of coronary risk. Intravenous immunoglobulin non-response also retained independent predictive value in our study, in line with clinical experience and previous Kawasaki disease reports. American Heart Association-related studies and observational data have shown that children with intravenous immunoglobulin resistance have a higher risk of coronary abnormalities or aneurysm formation. Reference Liu, Su and Yuan22,Reference Son, Gauvreau and Kim23 A recent review on intravenous immunoglobulin resistance similarly emphasised that intravenous immunoglobulin resistance may indicate not only poor response to treatment but also a higher risk of coronary complications. Reference Peng, Jing and Liu24 From a biological perspective, intravenous immunoglobulin non-response may indicate a refractory inflammatory state in which the initial treatment has not sufficiently interrupted ongoing vasculitis. This supports its inclusion in the prediction model. At the same time, intravenous immunoglobulin non-response is a dynamic variable that becomes available only after completion of initial treatment. Therefore, the present nomogram is not intended for baseline prediction at first presentation or for guiding the initial decision to administer intravenous immunoglobulin. Its appropriate clinical position is early post-intravenous immunoglobulin reassessment, after treatment response has been determined, but while intensified coronary surveillance and specialist management may still be considered.
The clinical value of this study lies not only in the model’s discriminatory performance but also in the accessibility of its predictors. Age, sex, fever duration, blood count–derived indices, and C-reactive protein/albumin ratio are routine, low-cost, and reproducible variables. Intravenous immunoglobulin non-response, although dynamic, can be recognised early during hospitalisation and adds useful information about the clinical course. Thus, the model may be best positioned as a reassessment tool after initial screening in primary care, during early hospitalisation, or before referral. In primary healthcare institutions, it may support clinical practice in several ways: early recognition of children at increased risk of coronary complications, adjustment of echocardiographic follow-up and inpatient monitoring intensity, and referral decisions to centres with paediatric cardiology and paediatric intensive care resources. Several limitations should be acknowledged. First, this was a retrospective single-centre study with a relatively small sample and only 46 coronary artery lesion events. The limited number of events relative to the candidate predictors may have increased the risk of model instability and overfitting, although elastic net analysis and internal validation were performed as supplementary assessments. Second, the validation cohort was derived from a random split of the same institutional population and therefore does not constitute external validation. Third, because intravenous immunoglobulin resistance is determined only after treatment initiation, the nomogram should be interpreted as an early post-intravenous immunoglobulin reassessment tool rather than a baseline prediction model at first presentation. Finally, potential differences in treatment timing or rescue therapy may have influenced coronary outcomes, and the age cut-off points of 17 and 58 months were data-driven thresholds derived from this cohort. Larger prospective multicentre studies are required to validate the model and confirm the generalisability of these age thresholds.
Conclusion
In this study, we developed and internally validated an interpretable nomogram for predicting echocardiographically detected coronary artery lesions in children with Kawasaki disease. By integrating routinely available clinical and laboratory variables with XGBoost-SHapley Additive exPlanations analysis, the model translated the nonlinear age-risk pattern and established predictors into individualised risk estimates, with potential value for early post-intravenous immunoglobulin reassessment and surveillance planning. However, these findings remain preliminary, and prospective external validation in larger multicentre cohorts is required before routine clinical implementation.
Supplementary material
The supplementary material for this article can be found at https://doi.org/10.1017/S1047951126124445.
Data availability statement
The datasets used and analysed during the current study are available from the corresponding author on reasonable request.
Acknowledgements
Not applicable.
Competing interests
The authors declare no competing interests.