INTRODUCTION
Leaf morphology may affect yield, quality, maturity, water-use efficiency, pest preference, photosynthesis, canopy penetration of plant growth regulators and other important production characteristics in many plants (Parkhurst & Loucks Reference Parkhurst and Loucks1972; Stettler et al. Reference Stettler, Fenn, Heilman and Stanton1988; Gurevitch Reference Gurevitch1992; Wu & Stettler Reference Wu and Stettler1994; Wu Reference Wu2000). Cotton is produced as a raw material for the textile industry and is considered a high-value crop. Cultivated cotton is dominated by two tetraploid species, Gossypium hirsutum and Gossypium barbadense L., which have two major leaf types (normal and okra leaf), as well as a minority of oval, ovate, crispate and palm shapes in some wild cotton (Du & Zhou Reference Du and Zhou2005). Normal leaf, also known as broad leaf, is predominant among cultivated cottons while okra leaf, also known as narrow leaf, usually has a deeply cut leaf edge. Okra leaf is further divided into superokra, okra and subokra based on morphological differences in leaf size and shape (i.e. lobe numbers, lobe length (LL), width (LW), etc.). A number of previous studies identified a leaf shape variant, okra leaf (L 20L 20), which usually confers earlier maturity than its isoline with the normal leaf (l 2l 2) shape (Andries et al. Reference Andries, Jones, Sloane and Marshall1969; Heitholt Reference Heitholt1993; Heitholt & Meredith Reference Heitholt and Meredith1998). Other agronomic and morphological characteristics that are (LA) different in okra-leaf cotton include less boll rot (Andries et al. Reference Andries, Jones, Sloane and Marshall1969), reduced leaf area (LA) index and higher canopy CO2-uptake per unit LA (Kerby et al. Reference Kerby, Buxton and Matsuda1980), increased light saturation and single-leaf photosynthesis per unit LA (Pettigrew et al. Reference Pettigrew, Heitholt and Vaughn1993), a shorter sympodial plastochron (Kerby & Buxton Reference Kerby and Buxton1978), an increased number of flowers per season (Wells & Meredith Reference Wells and Meredith1986), better pesticide penetration, higher water-use efficiency (Stiller et al. Reference Stiller, Read, Constable and Reid2005) and the genetic potential for improving agronomic and fibre traits (Ulloa Reference Ulloa2006). In China particularly, two registered okra-leaf hybrid cotton varieties, BiaozaA1 and BiaozaA2, are already widely grown (Ma et al. Reference Ma, Yang, Liu, Wang, Cheng, Niu and Xing2004).
Because a great diversity in leaf morphology exists among species within the cotton genus (Gossypium), the genetic basis of the variation found in these organs has been well explored, but the genetic mechanisms involved have not been clearly elucidated. Initially, Andries et al. (Reference Andries, Jones, Sloane and Marshall1969) reported that compared with the normal leaf, the okra leaf is controlled by one incomplete dominant major gene. As molecular technologies advance, quantitative trait loci (QTL) analysis has been used in the identification of the novel genes involved in leaf morphology. The two genetic mappings between G. hirsutum and G. barbadense (Jiang et al. Reference Jiang, Wright, Woo, Delmonte and Paterson2000), and between G. hirsutum and Gossypium tomentosum L. (Waghmare et al. Reference Waghmare, Rong, Rogers, Pierce, Wendel and Paterson2005) examined some QTLs of the morphological traits. However, a comparative study between these two genetic mappings, both of which were from an interspecific cross, suggested different genetic controls of leaf morphology (Waghmare et al. Reference Waghmare, Rong, Rogers, Pierce, Wendel and Paterson2005). The quantitative inheritance of leaf morphological traits from an intraspecific cross, especially leaf size, leaf perimeter (LP) and leaf petiole length (PL), has been less well explored in upland cotton (G. hirsutum) and cotton-breeding programmes to improve traits among the intraspecific crosses in G. hirsutum is still popular. Moreover, the relatively low polymorphism level of upland cotton, due to its polyploidy and the origin of the genome, has largely hampered its genetic mapping. In addition, the epistasis effects among QTLs controlling leaf morphological traits have not been identified in the F2 population.
Acting upon the genetic potential for improving cotton agronomics, quality traits that may exist in okra-leaf cotton and the ways in which they can be used could be further considered in producing future cultivars (Heitholt & Meredith Reference Heitholt and Meredith1998). The present study reports quantitative genetic analysis from two intraspecific crosses using generation mean analysis. The objectives of the study were: (i) to ascertain whether intraspecific variability might be a source of information with regard to the genetic controls underlying cotton leaf morphology; (ii) to elucidate the quantitative inheritance of leaf morphological traits; (iii) to determine the importance of additive, dominant and epistasis gene action; (iv) to calculate broad- and narrow-sense heritabilities and (v) to estimate the minimum number of genes involved in leaf morphology.
MATERIALS AND METHODS
Plant materials
Four cotton inbred lines, viz Kang3 and Han109 with normal leaves, Ji98 with okra leaves and Chaoji463 with superokra leaves (provided by the Plant Protection Institute, Henan Academy of Agricultural Science) were used as parents in the following two crosses: Kang3×Chaoji463 and Han109×Ji98. F1 plants of both the crosses were allowed to self-pollinate in order to produce the F2 generations in 2003 and seeds of the first backcross generations per cross (BC1 and BC2, where BC1 was the cross of F1×female parent and BC2 was that of F1×male parent) were also produced.
Field procedures
Plants of all the generations of the two crosses (P1, F1, P2, F2, BC1 and BC2 of each) were raised in 170 g paper cups in the greenhouse. At approximately 3 weeks of age (6 May 2005), the seedlings were transplanted to a field at the experiment station of the Henan Academy of Agricultural Science in Zhengzhou (34°48′N, 113°42′E, 100 m asl), China. Rows were 0·85 m apart and seedlings were planted 0·34 m apart within the rows. The experimental design was a randomized complete block design with three replications. After flowering, six plants in each P1, P2 and F1 plot, 32 in each BC1 and BC2 plot, and 80 in each F2 plot were randomly selected and tagged.
Phenotypic analysis
To ensure proper comparison of leaves of similar developmental stages, two leaves were harvested from the main stem (i.e. the 11–14th nodes above the cotyledon node). Two fully expanded mature leaves were collected from each plant per plot, and their digital images were taken using a Canon AF camera. Images from this experiment were then evaluated using the public-domain software program NIH Image developed at the US National Institute of Health (http://rsb.info.nih.gov/nih-image/), and six leaf morphologic traits were recorded or calculated. They include LA, LP, LL and LW, PL, and main LL/LW ratio. The average values from the two representative leaves per plant were used in the genetic analysis, mainly following the methodology described by Jiang et al. (Reference Jiang, Wright, Woo, Delmonte and Paterson2000), Perez-Perez et al. (Reference Perez-Perez, Serrano-Cartagena and Micol2002) and Waghmare et al. (Reference Waghmare, Rong, Rogers, Pierce, Wendel and Paterson2005).
Statistical and genetic analyses
Analyses of variances were performed using PROC MIXED (SAS Institute 1999). Generation mean analyses were conducted using a joint scaling test to elucidate the inheritance of leaf morphological traits in upland cotton (Cavalli Reference Cavalli, Reevea and Waddington1952; Mather & Jinks Reference Mather and Jinks1982). The joint-scaling test also evaluated the goodness of fit of the three-parameter model (mid-parent (m), additive (a) and dominance (d) effects) to the observed data by assuming that the sum of the squared deviations weighted with the appropriate coefficients follows a chi-square distribution with three degrees of freedom. The additive-dominance model was accepted if P>0·05. In contrast, lack of fit implied the existence of non-additive gene effects other than dominance (Cavalli Reference Cavalli, Reevea and Waddington1952).
When the three-parameter model did not show good fit, a six-parameter scaling test to determine the adequacy of a digenic epistatic model was performed. This test, which requires a minimum of six family means, m, a and d, also provides estimates of three epistatic parameters: additive×additive (i), additive×dominance (j) and dominance×dominance (l). These six genetic parameters were tested for significance using t-test at P⩽0·05. The three- and six-parameter scaling tests have been described in detail by Mather & Jinks (Reference Mather and Jinks1982) and the calculations were completed using JNTSCALE software (Ng Reference Ng1990).
Estimates of broad- and narrow-sense heritability were calculated for leaf morphological traits by using the variances of the parents, F1, F2, and backcross generations (BC1 and BC2) to estimate phenotypic (V P), environmental (V E), total genetic (V G), additive genetic (V A) and dominance genetic variances (V D), where:

Broad-sense heritability=H=(V A+V D)/V F2, where V A+V D represent the genetic variance of F2 (Allard Reference Allard1960), while narrow-sense heritability=h=V A/V F2 (Warner Reference Warner1952).
The minimum number of genes controlling leaf morphological traits was estimated using the equation (Lande Reference Lande1981)

where N=number of genes, P1=mean of parent 1, P2=mean of parent 2, V F2=variance of F2 population and V E=environmental variance.
RESULTS
Correlations between traits
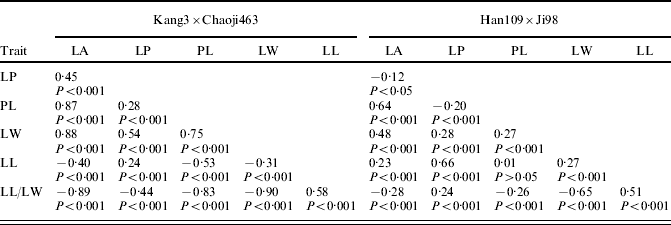
Aside from the relationship between PL and LL in the Han109×Ji98 cross (P>0·05), significant (P<0·001 or P<0·05) correlations were observed between other traits in both the Kang3×Chaoji463 and Han109×Ji98 crosses (Table 1). The results also showed that there are positive or negative differences among leaf morphological traits or between the same traits in different crosses. Positive correlations were observed between LA, LP, PL and LW (r=0·281–0·880) and between LP and LL/LW with LL (r=0·240 and 0·581, respectively) in the Kang3×Chaoji463 cross. Moreover, in the Han109×Ji98 cross, LA was positively correlated with PL, LW and LL (r=0·225–0·638); positive correlations were also detected between LP and PL with LW (r=0·280 and 0·272, respectively), between LP and LW with LL (r=0·661 and 0·226, respectively) and between LL and LL/LW (r=0·506). Positive or negative correlations among the same traits were possibly different between the two crosses, such as LP and LL with LA, PL and LL/LW with LP, and LW and LL.
Correlations between traits of leaf area (LA), leaf perimeter (LP), main lobe length (LL) and width (LW), petiole length (PL), and main lobe length/width ratio (LL/LW)in two crosses of upland cotton

Gene action, heritability and minimum number of genes
LA
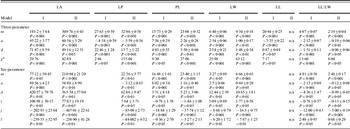
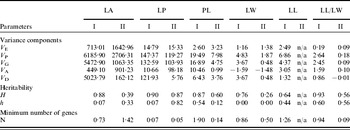
For the Kang3×Chaoji463 and Han109×Ji98 crosses, generation mean analyses were conducted using a joint scaling test, which revealed that the three parameters based on the additive-dominance model were not acceptable (P<0·001), so the six-parameter analysis (i.e. additive, dominance and interactions) was applied (Table 2). With the exception of the mid-parent value (m) in the Kang3×Chaoji463 cross (P>0·05), additive (a), dominance (d), additive×additive interactions (i), additive×dominance interactions (j) and dominance×dominance interactions (l) were all significant in the two crosses. Moreover, the signs of genetic effects were all consistent in both the crosses. Variance component estimates were also presented in Table 3. As can be seen, additive variance was lower than dominance variance in the Kang3×Chaoji463 cross, and narrow- and broad-sense heritabilities were 0·07 and 0·88, respectively. Conversely, additive variance was comparatively higher than dominance variance in the Han109×Ji98 cross, and narrow- and broad-sense heritabilities were 0·33 and 0·39, respectively, indicating that the generation selection should have different effects between the two crosses. Estimates of the minimum number of genes were 0·7 and 1·4 for the Kang3×Chaoji463 and Han109×Ji98 crosses, respectively (Table 3).
Estimates of additive, dominance and epistatic effects (and the standard errors) from the joint scaling test for leaf morphological traits in upland cotton crosses Kang3×Chaoji463 (I) and Han109×Ji98 (II)

m=mid-parent effect, a=additive effect, d=dominance effect, i=additive×additive effect, j=additive×dominance effect and l=dominance ×dominance effect.
n/a, Data not analysed statistically.
Estimates of additive (VA), dominance (VD), phenotypic (VP), genetic (VG) and environmental variances (VE); broad-sense (H) and narrow-sense (h) heritabilities; and minimum number of genes (N) for leaf morphological traits in upland cotton crosses Kang3×Chaoji463 (I) and Han109×Ji98 (II)

n/a, Data not analysed statistically.
LP
For the Kang3×Chaoji463 population, the trait LP showed better fit to an additive-dominance inheritance model, and the three parameters (mid-parent value (m), additive (a) and dominance (d)) were all found to be highly significant (P<0·001); however, additive effects were negative (Table 2). Nevertheless, the six-parameter model was used to determine gene action in the Han109×Ji98 cross. The results showed that all effects were highly significant except for the additive×additive (i) (P>0·05). Comparing additive and dominance variance, the estimates were similar to those in LA. Narrow-sense heritability (0·07) was found to be relatively lower than broad-sense heritability (0·90) in the Kang3×Chaoji463 population, while both were quite high (0·82 and 0·87, respectively) in the Han109×Ji98 cross. Estimates of the minimum number of genes were 0·07 and 0·05 for the Kang3×Chaoji463 and Han109×Ji98 crosses, respectively (Table 3).
PL
For the Kang3×Chaoji463 and Han109×Ji98 crosses, the additive-dominance model was not sufficient to explain the genetic variation of PL (Table 2), suggesting the presence of epistasis. The six-parameter model revealed the presence of significant additive×dominance interactions (j) (P<0·001) in the direction of the shorter PL, but both additive×additive (i) and dominance×dominance (l) were not significant (P>0·05). Furthermore, additive effects also played a more important role (P<0·05) than dominance effects (P>0·05). In comparison, the significance of the genetic effects was relatively consistent for both the Kang3×Chaoji463 and Han109×Ji98 populations (Table 3). For the Kang3×Chaoji463 population dominance variance was rather low, with broad-sense heritability at 0·87. Additive genetic variability was important and narrow-sense heritability was 0·54. When compared with the Han109×Ji98 population, dominance variance was higher (3·76) than additive variance (0·99) and, broad- and narrow-sense heritabilities were 0·60 and 0·12, respectively. The estimated minimum number of genes was 1·9 for the Kang3×Chaoji463 cross and 0·2 value for the Han109×Ji98 cross (Table 3).
Main LW
The joint scaling tests indicated that an additive-dominance model was not sufficient to account for the genetic variation of LW in the Kang3×Chaoji463 and Han109×Ji98 crosses (P<0·001) (Table 2). In the six-parameter model, all effects were significant except for additive effects in the Han109×Ji98 (P>0·05); the signs were the same between the two crosses, but negative additive×dominance (j) and dominance×dominance (l) were detected, where dominance effects relatively predominated in both the populations. Here, the negative additive variance was detected in the Kang3×Chaoji463 and Han109×Ji98 populations. According to Robinson et al. (Reference Robinson, Comstock and Harvey1955), the negative estimates were assumed to be zero. Therefore, where dominance variance was equal to genetic variance, selection should have no effect on LW. In addition, broad-sense heritabilities were 0·76 and 0·26 for both the crosses, respectively. Estimates of the minimum number of genes were low for the Kang3×Chaoji463 and Han109×Ji98 crosses at 0·9 and 0·5, respectively (Table 3).
Main LL
The parents did not differ in the Han109×Ji98 cross and thus the inheritance of LL was only analysed in the Kang3×Chaoji463 population. An additive-dominance model might elucidate on genetic variation and reveal that only dominance effects were not significant (P>0·05). However, additive effects were negative. Dominance variance was lower than additive variance, while broad- and narrow-sense heritabilities were 0·64 and 0·44, respectively. The estimated minimum number of genes was at 1·3.
Main LL/LW ratio
According to joint scaling tests (Table 2), the additive-dominance model did not explain genetic variation controlling LL/LW for the Kang3×Chaoji463 (P<0·001) and Han109×Ji98 (P<0·05) populations. In the six-parameter model, significant mid-parent value (m) (P<0·001), additive (a) (P<0·001), dominance (d) (P<0·05) and additive×dominance interactions (j) (P<0·001) were observed for the Kang3×Chaoji463 population (Table 2). However, only the mid-parent value (m) (P<0·001) and additive×dominance (j) (P<0·001) were significant for the Han109×Ji98 population. Dominance variance was lower than additive variance in the Kang3×Chaoji463 population (Table 3), while broad- and narrow-sense heritabilities were 0·93 and 0·60, respectively. However, the dominance variance in the Han109×Ji98 population was negative and assumed to be zero (Robinson et al. Reference Robinson, Comstock and Harvey1955), while both broad- and narrow-sense heritabilities were at 0·56. Estimates of the minimum number of genes were low for both the Kang3×Chaoji463 and Han109×Ji98 populations at 0·9 and 0·09, respectively (Table 3).
DISCUSSION
In the present study, six generations (P1, P2, F1, F2, BC1 and BC2) were obtained from two intraspecific crosses in upland cotton (G. hirsutum). The generation means approach for genetic analysis appeared to be a useful method for establishing the major features of quantitative variation of leaf morphological traits. Following Mather & Jinks (Reference Mather and Jinks1982), the inheritance of traits with no significant difference between parents was not analysed. The results of the present study revealed that the six-parameter model showed better fit with an additive-dominance model for majority of leaf morphological traits (Table 2), suggesting the relative importance of epistatic effects that control leaf morphology in upland cotton. However, a simple additive-dominance model accounted for the genetic variation of LL only in the Kang3×Chaoji463 cross. Nevertheless, the model selection for LP showed a difference between the two crosses (Table 2), which might be due to the different leaf types of the parental lines: Kang3 and Han109 were both normal-leaf, Chaoji463 was a superokra-leaf and Ji98 was an okra-leaf. In fact, okra- or subokra-leaves often have more lobe and sublobe numbers than superokra-leaves (Jiang et al. Reference Jiang, Wright, Woo, Delmonte and Paterson2000). However, both lobe and sublobe numbers influence LP, which probably led to the differences noted.
Previous reports on the inheritance of leaf morphology in cotton consisted of came to different conclusions. Endrizzi et al. (Reference Endrizzi, Turcotte, Kohel, Kohel and Lewis1984) and Jiang et al. (Reference Jiang, Wright, Woo, Delmonte and Paterson2000) summarized previous studies and indicated that variations in LL and LW were controlled by alleles at the l 2 locus, which was located on the D subgenome. Broad leaf l 2 was recessive to the most common okra-leaf mutant L 20 (Shoemaker Reference Shoemaker1908), which was found in cultivated cotton and certain wild forms such as G. hirsutum race palmeri (Stephens Reference Stephens1945). An intermediate form termed sub-okra, L 2u, was found in wild G. hirsutum and G. barbadense, while an extreme type, super-okra L 28, which develops a single leaf blade at maturity, was found as a mutant in okra leaf and as a variant in the okra-leaf wild forms of G. hirsutum (Stephens Reference Stephens1945). These reported genes conferring LL and LW might be different alleles at the locus (Jiang et al. Reference Jiang, Wright, Woo, Delmonte and Paterson2000). The above conclusions suggested that the origin and diversity was complex for leaf morphology in cotton. Jiang et al. (Reference Jiang, Wright, Woo, Delmonte and Paterson2000) mapped and characterized the QTLs determining 14 cotton leaf morphological traits from an interspecific cross between a G. hirsutum genotype carrying an okra-leaf mutant, and a wild-type G. barbadense. Furthermore, the genetic mapping of a cross between G. hirsutum and the Hawaiian endemic G. tomentosum was also reported (Waghmare et al. Reference Waghmare, Rong, Rogers, Pierce, Wendel and Paterson2005). That study suggested that the small rounded leaves of G. tomentosum were under novel genetic control (Waghmare et al. Reference Waghmare, Rong, Rogers, Pierce, Wendel and Paterson2005) and that compared with okra leaf traits (Jiang et al. Reference Jiang, Wright, Woo, Delmonte and Paterson2000), no QTL was detected for LL. For example, with respect to LW, Jiang et al. (Reference Jiang, Wright, Woo, Delmonte and Paterson2000) identified two QTLs detected with LOD⩾3·0 and P⩽0·001. Two more possible QTLs were suggested, explaining 0·60 of the phenotypic variation. They were probably on chromosomes 15, 5 and 2 or other linkage groups, and they presented different additive and dominance effects. However, Waghmare et al. (Reference Waghmare, Rong, Rogers, Pierce, Wendel and Paterson2005) detected a QTL on chromosome 9 with additive and dominance effects. The two above-mentioned groups of QTLs do not correspond, suggesting a different genetic control for leaf morphology between the different interspecific crosses. On the other hand, the present study showed that the six-parameter model had a higher fit than an additive-dominance model for LW from the two intraspecific crosses in upland cotton, suggesting that the epistatic effect produced a highly significant contribution. The distinctions cited might be due to differences in the analysis method used in the interspecific or intraspecific crosses, and in the cotton genus and leaf types of the parental lines.
Few studies have been published on LA, LP and PL traits in cotton. In the present paper, however, the genetic variations among these traits were analysed (Table 2). For LA and PL, a simplistic additive-dominance model did not adequately explain the observed variation and served as evidence for the presence of digenic or epistatic interactions. Regarding LP, differences in leaf type of the parental lines and alleles at the l 2 locus and origin of leaf type in cotton may have possibly led to the different genetic model decisions between the two crosses (Table 2).
In the past decade, a few studies have been published using QTL mapping analyses on leaf morphological traits in several plant species including Lolium perenne, Populus, Brassica oleracea, Arabidopsis thaliana, Gossypium and Lycopersicon (Wu et al. Reference Wu, Bradshaw and Stettler1997; Jiang et al. Reference Jiang, Wright, Woo, Delmonte and Paterson2000; Wu Reference Wu2000; Sebastian et al. Reference Sebastian, Kearsey and King2002; Perez-Perez et al. Reference Perez-Perez, Serrano-Cartagena and Micol2002; Frary et al. Reference Frary, Fritz and Tanksley2004; Yamada et al. Reference Yamada, Jones, Cogan, Vecchies, Nomura, Hisano, Shimamoto, Smith, Hayward and Forster2004; Waghmare et al. Reference Waghmare, Rong, Rogers, Pierce, Wendel and Paterson2005). In general, the results revealed that the range from several to tens of QTLs controlled the variation in leaf morphology. Some authors also reported the pleiotropic activity of a single gene as well as the epistatic interactions between QTLs (Perez-Perez et al. Reference Perez-Perez, Serrano-Cartagena and Micol2002; Sebastian et al. Reference Sebastian, Kearsey and King2002; Frary et al. Reference Frary, Fritz and Tanksley2004), which were partially similar to those made in cotton (Jiang et al. Reference Jiang, Wright, Woo, Delmonte and Paterson2000). Similarly, most data on the present work were on the relative importance of epistatic effects in the expression of leaf morphology in upland cotton.
In the present study, the negative variance components were estimated, and similar results were also reported (Dudley & Moll Reference Dudley and Moll1969; Hallauer & Miranda Reference Hallauer and Miranda1988; Zalapa et al. Reference Zalapa, Staub and McCreight2006). According to Robinson et al. (Reference Robinson, Comstock and Harvey1955), these negative estimates were assumed to be zero under study. Broad- or narrow-sense heritability values for the same trait showed different degrees of similarity between the two crosses; for example, broad-sense heritabilities were almost equal for LP, while in contrast, narrow-sense heritability values were different. The differences in heritability between crosses suggested that the efficiencies were different for genetic manipulation and progeny selection. In addition, the estimated minimum number of genes controlling each leaf morphological trait ranged from 0·05 to 1·9 in the two crosses. However, the sums of the minimum number of genes controlling leaf morphology were 5·8 and 2·2 in the Kang3×Chaoji463 and Han109×Ji98 populations, respectively. Furthermore, five methods for estimating the minimum number of genes have been reported (Wright Reference Wright1968; Lande Reference Lande1981; Mather & Jinks Reference Mather and Jinks1982) and Xu et al. (Reference Xu, Kang, Shi, Shen and Wehner2004) indicated that the estimated minimum number of genes controlling resistance to watermelon mosaic virus showed different values using these methods. Because all formulas of the minimum number of genes assumed that the segregating genes were all located in one parent, were not linked, had equal effects and did not show epistatic and dominance effects, genotype×environment effects were absent (Wright Reference Wright1968). Obviously, the assumptions of no epistatic and dominance effects and genetic linkage appear to be the problems in this study. Therefore, the true minimum number of genes controlling leaf morphological traits under study was underestimated.
In the present study, the quantitative inheritance of leaf morphological traits in upland cotton was analysed by generation mean analysis using a joint scaling test. For the above-mentioned differences between the Kang3×Chaoji463 and Han109×Ji98 populations as well as for previous results, these disparities were likely due to the use of different analysis methods and the differences of parents for the leaf type, origin of leaf type, degree of difference of leaf type, and the Gossypium species. These results indicated that there was considerable genetic diversity and complexity for leaf morphology in cotton, suggesting that there exists a substantial opportunity to breed cottons that transgress the present range of leaf phenotypes found.
We are grateful to the National 973 Program of China (2004CB117300) and the National 11.5 Key Technology Program (2006BAD01A05-11) that supported this research. We are likewise thankful to our reviewers for their relevant comments and suggestions for the manuscript's improvement.