1. Introduction
Insurance plays a vital role in protecting customers from rare but costly perils. Insurance companies accept to cover a policyholder’s peril in exchange for a fixed premium. For insurance costs to be fair, customers must pay premiums corresponding to their expected future costs. Actuaries accomplish this task by segmenting customers in similar risk profiles and using historical data from these classes to estimate future costs. Advances in computation and statistical learning, along with more information, drive insurance companies to create more individualized risk profiles.
An important factor that influences insurance risk is where a customer lives. Locations explain socio-demographic perils like theft, irresponsible driving or responsible home maintenance. Natural phenomena such as weather-based perils depend on natural factors such as elevation and historic rainfall. Geographic ratemaking attempts to capture geographic effects within the rating model. Historically, actuaries have used spatial models to perform geographic ratemaking.
One may think that one must include a geographic component for a model to capture geographic effects: either depending on coordinates or on indicator variables that identify a territory. Indeed, the related research from actuarial science uses the latter approach. These models require a large quantity of data to learn granular geographic effects and do not scale well for large territories. Until we model the geographic variables that generate the geographic risks, it is unfeasible to model postal code-level risk in a country-wide geographic model. In the present paper, we propose a method to construct geographic features that capture the relevant geographic information to model geographic risk. We find that a model using these features as input to a generalized linear model (GLM) can model geographic risk more accurately and more parsimoniously than previous geographic ratemaking models.
In this paper, we construct geographic features from census data. The intuition through this paper is that since people generate risk, the geographic distribution of the population (as captured by census data) relates to the geographic distribution of risk. If we capture the geographic characteristics of the population correctly, then a ratemaking model using the geographic distribution of the population as input may not require any geographic component since the geographic distribution of the population will implicitly capture some of the geographic distribution of risk. We focus on the geographic distribution of populations as an intermediate step of the predictive model.
We now review the literature of geographic ratemaking in actuarial science. Early geographic models in actuarial science were correction models that smoothed the residuals of a regression model, that is, capturing geographic effects after the main regression model, in a smoothing model. Notable examples include Taylor (Reference Taylor1989), Boskov and Verrall (Reference Boskov and Verrall1994) and Taylor (Reference Taylor2001). If we address the geographic effects during or before the main regression model, then the smoothing is not required. Dimakos and Di Rattalma (Reference Dimakos and Di Rattalma2002) propose a Bayesian model that estimate geographic trend and dependence simultaneously to the main regression model. This model was later refined and studied as conditional autoregressive models by Gschlößl and Czado (2007) and Shi and Shi (Reference Shi and Shi2017). Another approach is spatial interpolation, which uses geographically varying intercepts in the model. Examples include Fahrmeir et al. (Reference Fahrmeir, Lang and Spies2003), Denuit and Lang (Reference Denuit and Lang2004), Wang et al. (Reference Wang, Schifano and Yan2017) and Henckaerts et al. (Reference Henckaerts, Antonio, Clijsters and Verbelen2018) and other spatial interpolation methods like regression-kriging Hengl et al. (Reference Hengl, Heuvelink and Rossiter2007). These methods use the geographic coordinates of the risk along with multivariate regression functions to estimate geographic trend.
The above models capture geographic effects directly and non-parametrically, increasing model complexity and making estimation difficult (increasing the number of parameters, making them less competitive when comparing models based on criteria that penalize model complexity). As a result, geographic smoothing methods adjusted on residuals are still the prevalent geographic methods in practice for geographic ratemaking.
In the present paper, we take a fundamentally different approach, capturing the geographic effects during feature engineering. Instead of capturing geographic effects non-parametrically with geographic models, we introduce geographic data in the ratemaking model. Geographic data are “data with implicit or explicit reference to a location relative to the Earth” (ISO 19109, 2015). Geographic data can describe natural variables like the ecosystem and the landform of a location, or artificial variables including human settlement and infrastructure information. We study the effectiveness of automatically extracting useful representations of geographic information with representation learning, see Bengio et al. (Reference Bengio, Courville and Vincent2013) for a review of this field of computer science.
Early geographic representation models started with a specific application and then constructed representations useful for their applications. These include Eisenstein et al. (Reference Eisenstein, O’Connor, Smith and Xing2010) and Cocos and Callison-Burch (Reference Cocos and Callison-Burch2017) for topical variation in text, Yao et al. (Reference Yao, Li, Liu, Liu, Liang, Zhang and Mai2017) to predict land use, Xu et al. (Reference Xu, Cao, Legg, Liu and Li2020) for user location prediction and Jeawak et al. (Reference Jeawak, Jones and Schockaert2019) and Yin et al. (Reference Yin, Liu, Zhang, Wang, Shah and Zimmermann2019) for geo-aware prediction. More recent approaches aim to create general geographic embeddings. See Blier-Wong et al. (Reference Blier-Wong, Baillargeon, Cossette, Lamontagne and Marceau2020), Hui et al. (Reference Hui, Yan, Ku and Wang2020), Wang et al. (Reference Wang, Li and Rajagopal2020) and references therein for alternative model architectures.
The remainder of this paper is structured as follows. In Section 2, we explain how we can capture spatial models’ desirable properties within representations models. Section 3 presents a spatial representation model, while Section 4 provides the details of an implementation on Canadian census data. Sections 2, 3 and 4 present the same ideas, the first presenting general ideas and the last including concrete model architectures. We present applications of the spatial embeddings on insurance-related datasets in Section 5, comparing spatial embeddings to an existing spatial model. Section 6 concludes the paper.
2. Spatial representations
In Blier-Wong et al. (Reference Blier-Wong, Baillargeon, Cossette, Lamontagne and Marceau2021), we propose a framework for actuarial modeling with emerging sources of data. This approach separates the modeling process into two steps: a representation model and a predictive model. Using this deconstruction, we can leverage modern machine learning models’ complexity to create useful representations of data and use the resulting representations within a simpler predictive model like a GLM. This section presents an overview of representation models, with a focus on spatial embeddings.
2.1. Overview of representation models
The defining characteristic of a representation model (as opposed to an end-to-end model) is that representation models never use the response variable of interest during training, relying instead on the input variables themselves or other response variables related to the insurance domain. We propose using encoder/decoder models to construct embeddings, typically with an intermediate representation (embedding) with a smaller dimension than the input data; see Figure 1 for the outline of a typical process. When training the representation model, we adjust the parameters of the encoder and the decoder, two machine learning algorithms. To construct the simpler regression model, one extracts embedding vectors for every observation and stores them in a design matrix. The representation construction process has four steps:
Encoder/decoder architecture.

Step 1: Construct an encoder, transforming input variables into a latent embedding vector.
Step 2: Construct a decoder, which will determine which information the representation model must capture.
Step 3: (Optional) Combine features from different sources into one combined embedding.
Step 4: (Optional) Evaluate different embeddings and validate the quality of representations.
Representation models have many advantages: they transform categorical variables into dense vectors, reduce the input variable dimension, construct reusable representations, automatically learn non-linear transformations and interactions and reduce the predictive model’s complexity.
The geographic methods proposed in actuarial science address the data’s geographic nature within or after the predictive model. Geographic embeddings are a fundamentally different approach to geographic models studied in actuarial science. The geographic embeddings approach that we propose is largely inspired by word embeddings in natural language processing (NLP). We first transform geographic data into geographic embedding vectors, during feature engineering. Using geographic embeddings in the main regression model, we capture the geographic effects and the traditional variables at the same time. Figure 2 provides an overview of the method. The representation model takes geographic data as input to automatically create geographic features (Sections 3 and 4, respectively, present architectures and implementations of geographic embedding models). Then, we combine the geographic embeddings with other sources of data (such as traditional actuarial variables, e.g., customer age). Finally, we use the combined feature vector within a predictive model.
Proposed geographic ratemaking process.

2.2. Desirable attributes of spatial embeddings
The representation learning framework enables one to select an architecture that captures specific desirable attributes from various data sources. There is one generally accepted desirable attribute for geographic models, called Tobler’s first law (TFL) of geography. We also propose two new attributes that make geographic embeddings more useful. Below is a list of these three desirable attributes for geographic embeddings.
Attribute 1 (TFL) Geographic embeddings must follow TFL of geography. As mentioned in Tobler (Reference Tobler1970), “everything is related to everything else, but near things are more related than distant things.” This attribute is at the core of spatial autocorrelation statistics. Spatial autocorrelation is often treated as a confounding variable, but these variables constitute information since it captures how territories are related (see, e.g., Miller, Reference Miller2004 for a discussion). A representation model, capturing the latent structure of underlying data, generates geographic embeddings.
Attribute 2 (coordinate) Geographic embeddings are coordinate-based. A coordinate-based model depends only on the risk’s actual coordinates and its relation to other coordinates nearby. Polygon-based models highly depend on the definition of polygon boundaries, which could be designed for tasks unrelated to insurance.
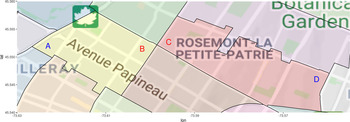
We motivate this attribute with an example. Consider four customers A, B, C and D that have home insurance for their house in the Island of Montreal, Quebec, Canada. Figure 2 identifies each coordinate on a map. We also included the borders of polygons, represented by bold black lines. These polygons correspond to forward sortation areas (FSAs), a unit of geographic coordinate in Canada (further explained in Section 4). Observations A and B belong to the same polygon, while observations B and C belong to different ones. However, B is closer to C than to A. Polygon-based representation models and polygon-based ratemaking models assume that the same geographic effect applies to locations A and B, while different geographic effects apply to locations B and C. However, following TFL, one expects the geographic risk between customers B and C to be more similar than the geographic risk between A and B.
There are two other issues with the use of polygons. The first is that the actual shapes of polygons could be designed for purposes that are not relevant for capturing geographic risk. If an insurance company uses polygons for geographic ratemaking, it is crucial to verify that risks within each polygon are geographically homogeneous. The second issue is that polygon boundaries may change in time. If postal codes are split, moved, merged or created, the geographic ratemaking model will require changes. Finally, the type of location information (coordinate or polygon) for the ultimate regression task may be unknown while training the embeddings. For this reason, one should not make the polygon depend on a specific set of boundary polygon shapes.
Attribute 3 (external) Geographic embeddings encode relevant external information. There are two reasons for using external information. The first is that geographic effects are complex, so we need a large volume of geographic information to capture the confounding variable that generates them. Constructing geographic embeddings with a dataset external to one’s specific problem may increase the quantity and quality of data, providing new information for spatial prediction. The second reason is that geographic embeddings can produce rates in territories with no historical loss experience, as long as we have external information for the new territory. Traditional geographic models capture geographic effects from experience but are useless to rate new territories. If we train geographic embeddings on external datasets that cover a wider area than the loss experience of an insurance company, we may use the geographic embeddings to capture geographic effects in territories with no loss experience. This reason is related to using one-hot encodings of territories; see Blier-Wong et al. (Reference Blier-Wong, Baillargeon, Cossette, Lamontagne and Marceau2021) for further illustrations. Finally, the external information should be relevant to the insurance domain. Although geographic embeddings could be domain agnostic (general geographic embeddings for arbitrary tasks), our ultimate goal is geographic ratemaking, so we select the external information that is related to causes of geographic risks.
Step of the embedding construction process is to evaluate representations. There are two types of evaluations for embeddings: the most important are extrinsic evaluations, but intrinsic evaluations are also significant (Jurafsky and Martin, Reference Jurafsky and Martin2009). One evaluates embeddings extrinsically by using them in downstream tasks and comparing their predictive performance. In P&C actuarial ratemaking, one can use the embeddings within ratemaking models for different lines of business and select the embedding model that minimizes the loss on out-of-sample data.
According to our knowledge, there are no intrinsic evaluation methods for geographic embeddings. We propose one method in this paper and discuss other approaches in the conclusion. Intrinsic evaluations determine if the embeddings behave as expected. To evaluate embeddings intrinsically, one can verify if they satisfy the three attributes proposed in Section 2. To validate TFL, we can plot individual dimensions of the embedding vector on a map. Embeddings that satisfy TFL vary smoothly, and one can inspect this property visually. Section 4.6 presents the implicit evaluation for the implementation on Canadian census data.
3. Convolution-based geographic embedding model
In this section, we describe an approach to construct geographic embeddings. We will prepare the data and explain the representation model choices for the encoder in Step and the decoder in Step .
3.1. Preparing the data
Suppose we are interested in creating a geographic feature that characterizes a location s. Following attribute (external), we must first collect geographic information for location s. Objects characterized by their location in space can be stored as point coordinates or polygons (boundary coordinates) (Anselin et al., Reference Anselin, Syabri and Kho2010). In Figure 3, the individual marks A, B, C and D are point patterns, and the different shaded areas are polygons.
Coordinates vs polygons.

To construct the representation model, we assume that we have one or many external datasets in polygon format, with a vector of data for each polygon. This is the case for census data in North America. Suppose the coordinate of s is located within the boundaries of polygon
 $\textbf{S}$
, then one associates the external geographic data from polygon S to location s. We will use the notation
 ${\gamma} \in \mathbb{R}^d$
to denote the vector of geographic variables.
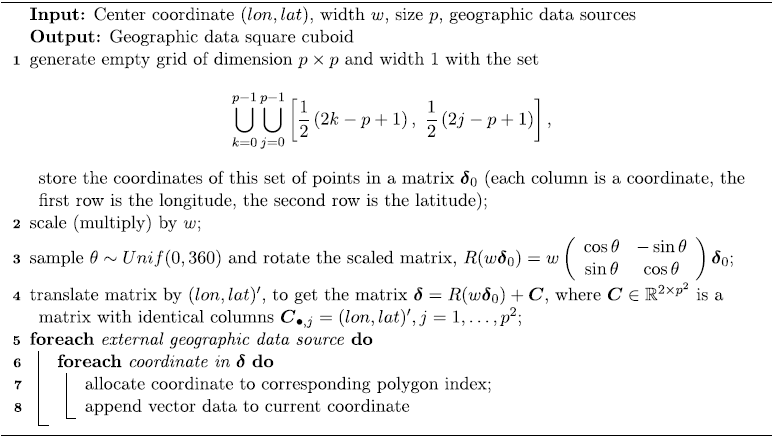
We first modify the input data for the representation model to satisfy the TFL and coordinate attributes. To create an embedding of location s, we will not only use information from location s but also data from surrounding locations. Since each coordinate within a polygon may have different surrounding locations, the resulting embeddings will not be polygon-based, satisfying the coordinate attribute. An approach to satisfy TFL is to use an encoder that includes a notion of nearness. Convolutional neural networks (CNNs) have the property of sparse interactions, meaning the outputs of a convolutional operation are features that depend on local subsets of the input (Goodfellow et al., Reference Goodfellow, Bengio and Courville2016). CNNs accept matrix data as input. For this reason, we will define our neighbors to form a grid around a central location. The representation model’s input data are the geographic data square cuboid (GDSC) from Blier-Wong et al. (Reference Blier-Wong, Baillargeon, Cossette, Lamontagne and Marceau2020), which we present in Algorithm 1 and explain below.
Generating a geographic data square cuboid

To create the geographic data cuboid for a location s with coordinate (lon, lat), we span a grid of
 $p\times p$
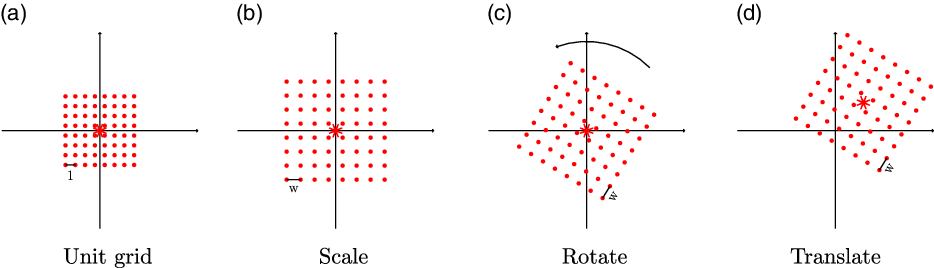
neighbors, centered around (lon, lat). Each neighbor in the grid is separated horizontally and vertically by a distance of w. The lines 1 to 4 of Algorithm 1 create the matrix of coordinates for the neighbors, and we illustrate each transformation in Figure 4.
Creating the grid of neighbors.

Each coordinate in
 $\boldsymbol{\delta}$
has geographic variables
 ${\gamma} \in \mathbb{R}^d$
, extracted from different external data sources of polygon data. The set of variables for every location in
 $\boldsymbol{\delta}$
, which we note
 $\underline{{\gamma}}_{\boldsymbol{\delta}}$
, forms a square cuboid of dimension
 $p\times p \times d$
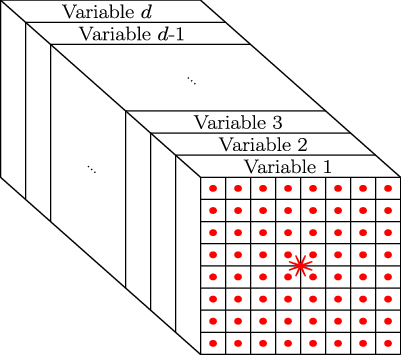
, which we illustrate in Figure 6. We can interpret the GDSC as an image with d channels, with one channel for each variable. Algorithm 1 presents the steps to create the data square cuboid for a single location. Lines 1 to 4 generate the set
 $\boldsymbol{\delta}$
for the center location (the matrix of neighbor coordinates), while lines 5 to 8 fill each coordinate’s variables. The random rotation is present such that our model does not exclusively learn effects in the same orientation.
If the grid size p is even,
 $\boldsymbol{\delta}$
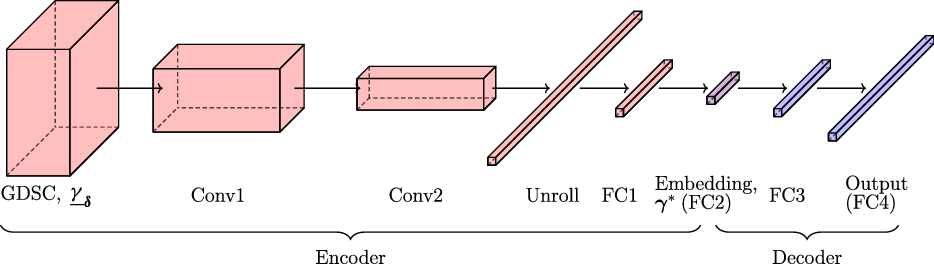
does not include the center coordinate. This means the GDSC depends only on neighbor information and not information of the center point itself. We present, in Figure 7, the entire convolution-based model architecture of Continuous Bag of Word (CBOW)-convolutional regional autoencoder (CRAE). The following two subsections will detail the components of the encoder and of the decoder.
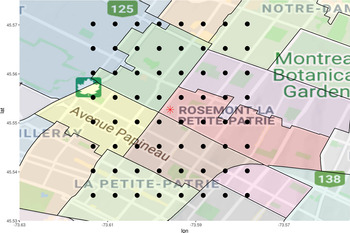
Set of neighbor coordinates
 $\boldsymbol{\delta}$
.

Data square cuboid
 $\underline{{\gamma}}_{\boldsymbol{\delta}}$
.

Convolution-based geographic embedding model.

3.2. Step 1: Constructing the encoder
As explained in Section 2.1, the encoder generates a latent representation from a bottleneck, which we then extract as embeddings. Above, we constructed the input data to have a square cuboid shape to use CNNs as an encoder. The encoder accomplishes two types of transformations: reducing the size of the features and transforming a three-dimensional tensor into a one-dimensional vector. The encoder has convolutional operations (Conv1 and Conv2 in Figure 7), reducing the size of the hidden square cuboids (also called feature maps in computer vision) after each set of convolutions. Then, we unroll (from left to right, top to bottom, front to back, see Unroll in Figure 8) the square cuboid into a vector. The unrolled vector will be highly autocorrelated: since the output of the convolutions includes local features, features from the same convolutional layer will be similar to each other, causing collinearity if we use the unrolled vector directly within a GLM. For this reason, we add fully connected layers after the unrolled vector (see FC1 and FC2 in Figure 7). The last fully connected layer of the encoder is the geographic embedding vector, noted
 ${\gamma}^*$
. This layer typically has the smallest dimension of the entire representation model. For a geographic embedding of dimension
 $\ell$
, the encoder will be a function
 $\mathbb{R}^{p\times p \times d} \to \mathbb{R}^\ell$
.
Unrolling example for a
 $2\times 2 \times 2$
cuboid. Different colors are different variables.

3.3. Step 2: Constructing the decoder
The decoder guides the type of information that the embeddings encode, that is, selects which domain knowledge to induce into the representations. In our model, the decoder attempts to predict the input variables
 ${\gamma}$
, so that the complete model is similar to an autoencoder.
In this paper, we present an improvement of the CRAE from Blier-Wong et al. (Reference Blier-Wong, Baillargeon, Cossette, Lamontagne and Marceau2020) by changing the decoder, see the Supplementary Materials for details on the original model. One can interpret the new model as using contextual variables to predict the central variables, directly satisfying the coordinate attribute. This same motivation was suggested for NLP in Collobert and Weston (Reference Collobert and Weston2008) and applied in a model called CBOW (Mikolov et al., Reference Mikolov, Chen, Corrado and Dean2013). For this reason, we call the new model CBOW-CRAE. The input of CBOW-CRAE is the GDSC. The decoder attempts to predict the variables
 ${\gamma}$
for location s. Therefore, the decoder is a series of fully connected layers that act as a function
 $\mathbb{R}^\ell \to \mathbb{R}^{d}$
. The loss function for CBOW-CRAE is the average reconstruction error on the vector of variables for the central location:
 \begin{equation} \mathcal{L} = \frac{1}{N}\sum_{i = 1}^{N}\left|\left|\tilde{{\gamma}}_i - {\gamma}_i\right|\right|^2,\end{equation}
where
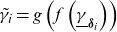 $\tilde{{\gamma}}_i = g\left(f\left(\underline{{\gamma}}_{\boldsymbol{\delta}_i}\right)\right)$
is the output of the autoencoder, f is the encoder and g is the decoder.
This model satisfies desirable attributes to since
-
1. the encoder is a CNN, which captures sparse interactions from neighboring information, encoding the notion of nearness;
-
2. the embeddings are coordinate-based: as the center coordinate moves, the neighboring coordinates also move, so center coordinates within the same polygon may have different GDSCs;
-
3. the model uses external data as opposed to one-hot encodings of territories.
4. Implementations of geographic embeddings
In this section, we present an implementation of geographic embeddings using census data in Canada. We select census data since they contain crucial socio-demographic information on the customer’s geography; geographic embeddings trained with census data will compress this information. We first present the census data in Canada, along with issues related to some of its characteristics. Then, we explain the architectural choices and implementations for the GDSC, the encoder and the decoder. Finally, we perform intrinsic evaluations of the geographic embeddings.
4.1. Canadian census data
Statistics Canada publishes census data every 5 years; our implementation uses the most recent version (2016). The data are aggregated into polygons called FSAs, which correspond to the first three characters of a Canadian postal code. There are 1640 FSAs in Canada, and each polygon in Figure 5 represents a different FSA. The grid of neighbor coordinates of Figure 5 contains eight points from the same FSA as the central location, represented by the red star.
The first issue with using census data for insurance pricing is the use of protected attributes, that is, variables that should legally or ethically not influence the model prediction. One example is race and ethnicity (Frees, Reference Frees2015). To construct the geographic embeddings, we discard all variables related to ethnic origin (country of origin, mother tongue, citizen status). We retain only variables that a Canadian insurance company could use for ratemaking and end up with 512 variables that we denote
 ${\gamma}$
. In the Supplementary Materials, we provide a complete list of the categories of variables within the census dataset.
It is common practice in machine learning to normalize input variables such that they are all on the same scale. We use min-max rescaling on all variables such that the range of each variable is [0, 1]. Normalization requires special attention for aggregated variables like averages, medians and sums: some must be aggregated with respect to a small number of observations, others with respect to the population within the FSA of interest and others with the Canadian average. For example, the FSA population is normalized with respect to all FSAs in Canada. For age group proportions (for instance, the proportion of 15- to 19-year-olds), we normalize with respect to the current FSA’s total population.
When using Algorithm 1, some coordinates do not belong to a polygon index, which happens when the coordinate is located in a body of water. To deal with this situation, we created a vector of missing values filled with the value 0. Finally, we project all coordinates to Atlas Lambert (Reference Lambert1772) to reduce errors when computing Euclidean distances with coordinates.
4.2. Geographic data square cuboid
Now that we have prepared the census data, we can construct the GDSC for our implementation. The parameters for the GDSC include square width w and pixel size p. One can interpret these values as smoothing parameters. The square width w affects the geographic scale of the neighbors, while the pixel size p determines the density of the neighbors. For very flexible embeddings, one can choose small w so that the geographic embeddings will capture local geographic effects. If the embeddings are too noisy, then one can increase p to stabilize the embedding values. Ultimately, the importance is the span of the grid, determined by the farthest sampled neighbors. For an even value of w, the closest sampled neighbor coordinates are the four corners surrounding the central location at a distance of
 $p/\sqrt{2}$
units from the central location. The farthest sampled neighbors are the four outermost corners of the grid at a distance of
 $p(w-1)/\sqrt{2}$
units. Selecting the best parameters is a tradeoff between capturing local variations in densely populated areas and smoothing random fluctuations in rural areas. Insurance companies could construct embeddings for rural portfolios and urban portfolios with different spans to overcome this compromise. Another solution consists of letting the parameters depend on local characteristics of the population, such as population density (select parameters such that the population contained within a grid is above a threshold) or the range of a variogram (select parameters such that the observations within the grid still exhibit geographic autocorrelation).
We consider square widths of
 $w= \{8, 16\}$
and pixel sizes of
 $p = \{50, 100, 500\}$
m. Our experiments showed that a square width of
 $w=16$
and a pixel size of
 $p = 100$
m produced smaller reconstruction errors. The GDSC algorithm then samples
 $16^2 = 256$
neighbors, the closest one being at a distance of 71 m and the farthest one at 1061 m from the center location. Since we have 512 variables available for every neighbor, the size of the input data is
 $512 \times 16 \times 16 $
and contains 131,072 values.
The dataset used to train the representation models is composed of a GDSC for every postal code in Canada (888,533 by the time of our experiments). A dataset containing the values of every GDSC would take 2TB of memory, too large to hold in most personal computers. For this reason, we could not generate the complete dataset. However, one can still train geographic embeddings on a personal computer by leveraging the fact that many values in the dataset repeat. For each postal code, one generates the grid of neighbor coordinates (lines 1–4 of Algorithm 1) and identifies the corresponding FSA for each coordinate (line 6 of Algorithm 1). We then unroll the grid from left to right and from top to bottom into a vector of size 256. For memory reasons, we create a numeric index for every FSA (A0A = 1, A0B = 2,
 $\dots$
, Y1A = 1640) and store the list of index for every postal code in a CSV file (1GB). Another dataset contains the normalized geographic variables
 ${\gamma}$
for every FSA (15.1 MB). Most modern computers can load both datasets in RAM. During training, our implementation retrieves the vector from the index and retrieves the values associated with each FSA (line 8 of Algorithm 1), then rolls the data into GDSCs.
4.3. CBOW-CRAE encoder
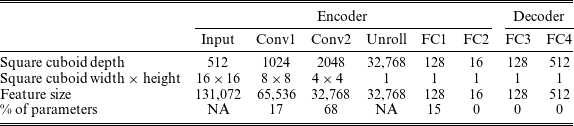
In this section, we present the architecture and dimensions of the encoder from the selected model. To adequately explain the encoder (and provide the necessary tools to replicate our study), we delay the comparison of multiple architectures to the Supplementary Materials. The encoder contains two convolution layers (Conv1 and Conv2), followed by two fully connected layers (FC1 and FC2), as in the left part of Figure 7, and contains 27,866,896 parameters. The code for the CBOW-CRAE model is in the Supplementary Materials, where we also provide more model details. The encoder’s input is a GDSC of size
 $512\times 16 \times 16$
, and the output of the encoder must be a vector of size
 $\ell$
. Our experiments show that embedding dimension
 $\ell =16$
works well for our applications. One must construct an encoder architecture that gradually decreases the feature size from 131,072 to 16. One must avoid decreasing the feature size too quickly, since the encoder may fail to capture valuable features. We, therefore, use the architecture heuristics of Simonyan and Zisserman (Reference Simonyan and Zisserman2014) and He et al. (Reference He, Zhang, Ren and Sun2016) to construct the encoder architecture. The idea is to reduce the width and height of intermediate features and increase the depth between convolution blocks.
We use convolution filters of dimension
 $3\times 3$
throughout, such that convolution operations capture local effects at the scale of
 $300 \times 300$
m
 $^2$
. We also apply half-padding to the features, meaning we surround each layer of feature maps with zeros, such that the output of the convolution operation retains the same dimension as the input. After the convolution operation, we apply a batch normalizing transform (Ioffe and Szegedy, Reference Ioffe and Szegedy2015), where each hidden feature is normalized to have zero mean and unit variance, then train new translation and scale parameters for each hidden feature to restore the representation flexibility. Then, we apply max-pooling with a stride of two, meaning that we retain only the maximum value for each
 $2\times 2$
grid (with increments of two). We refer the interested reader to Dumoulin and Visin (Reference Dumoulin and Visin2018) for details on convolution and pooling arithmetic, including illustrations on half-padding and max-pooling.
As an example, consider the first convolution block of the CBOW-CRAE encoder with input dimension
 $512 \times 16 \times 16$
. First, we add zeroes around each layer of the cube such that the dimension becomes
 $512 \times 18 \times 18$
. The result of a single convolution operation has dimension
 $1\times 16 \times 16$
(because of the half-padding, the width and height remain the same). The depth of the convolution block doubles from one block to the next, so the first convolution block includes 1024 convolutions, and the resulting dimension is
 $1024 \times 16 \times 16$
. Finally, max-pooling separates the
 $16\times 16$
feature layers into
 $2\times 2$
blocks and returns the block-wise maximum value. There are eight
 $2\times 2$
blocks for each row and column, so the result of applying max-pooling on a
 $16 \times 16$
matrix is an
 $8\times 8$
matrix. The final output of the first block is a
 $1024 \times 8 \times 8$
tensor.
Applying a second convolution block, one obtains a feature of dimension
 $2048 \times 4 \times 4$
. Then, one must transition from a three-dimensional tensor to a one-dimensional vector, since the embeddings are in vector form. We apply the unroll operation of Figure 8, and the result is a vector of length 32,768. Then, we transform the unrolled vector through two fully connected layers, the first of dimension 128 and the second of dimension
 $\ell = 16$
. The most significant drop in features size occurs in the first hidden layer; the size of FC1 is about 0.4% of the unrolled vector. Although the dimension reduction at this step is significant, we found that the hidden features in the unrolled vector contain redundant information, possibly due to the weight sharing property of convolutions.
To constrain the embedding values in
 $[-1, 1]$
, the last activation function of the encoder should be the hyperbolic tangent (tanh) function. The activation functions for intermediate layers (Conv1, Conv2, FC1) are hyperparameters; we compare tanh and leaky rectified linear unit (leaky ReLU,
 $\max(x, 0.01 x)$
). The leaky ReLU activation function generated the best performances, but the models did not converge for every initial seed. Our selected models use leaky ReLU, but sometimes required restarting the training process with a different initial seed when embeddings saturate.
4.4. CBOW-CRAE decoder
The role of the decoder in the CBOW-CRAE model is to transform the embedding vector
 ${\gamma}^* \in \mathbb{R}^{\ell}$
back to the original geographic variable vector
 ${\gamma} \in \mathbb{R}^{d}$
. Akin to constructing the encoder, one must design a decoder architecture that gradually increases the feature dimension from 16 to 512. From many empirical comparisons, we notice that the decoder requires at least one hidden layer, but including more does not significantly reduce the reconstruction error. Indeed, one’s effort is more valuable in the encoder architecture than the decoder. We select the ascent dimensions (FC3 and FC4) to be the same as the fully connected descent dimensions (FC1 and FC2). The activation function for FC3 is the leaky ReLU, while the activation function for FC4 is the sigmoid function (the sigmoid is the inverse link function for logistic regression,
 $(1 - e^{-1})^{-1}$
). We select the sigmoid as the last activation function since the image of the sigmoid is (0, 1), which is the same as the input variables. Table 1 presents the dimensions for the entire CBOW-CRAE model.
Dimensions of each component of the CBOW-CRAE model.

4.5. Optimization strategy and training issues
We split the postal codes into a training set and a validation set. Since the dataset is very large, we select a test set composed of only 5% of the postal codes. We train the neural network on a GeForce RTX 2080 8 GB GDDR6 graphics card and the training time is approximately 2 days. The batch size is 256, which is the largest power of 2 that fits on the graphics card. We train the neural networks in PyTorch (Paszke et al., Reference Paszke, Gross, Massa, Lerer, Bradbury, Chanan, Killeen, Lin, Gimelshein and Antiga2019) with the Adam optimization procedure from Kingma and Ba (Reference Kingma and Ba2014). We initialize model weights according to He et al. (Reference He, Zhang, Ren and Sun2015). We do not use weight decay (L2 regularization) since the model does not overfit. The initial learning rate for all models is 0.001, and it decreases by a factor of 10 when validation loss stops decreasing for 10 consecutive epochs. After five decreases, we stop the training procedure and return the model with the smallest loss on the validation set.
The most significant issue during training is the saturation of initial hidden values (see, e.g., Glorot and Bengio (Reference Glorot and Bengio2010) for a discussion of the effect of neuron saturation and weight initialization). The encoder and the decoder’s output are, respectively, tanh and sigmoid activations, which have horizontal asymptotes and small derivatives for high magnitude inputs. All models use batch normalization, without which the embeddings saturate quickly. Initializing the network with large weights, using the techniques from Glorot and Bengio (Reference Glorot and Bengio2010), generated saturated embedding values of –1 or 1. To improve training, we initialize our models with very small weights, such that the average embedding value has a small variance and zero mean. The neural network gradually increases the weights, so embeddings saturate less.
4.6. Implicit evaluation of embeddings
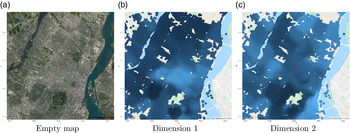
We now implicitly evaluate if the 16 dimensions of the embedding vector (generated by the large CBOW-CRAE model) follow attribute (TFL). Figure 9 presents an empty map for a location in Montreal (to identify points of interest), along with two embedding dimensions. The red star is the same coordinate as in Figure 5. The map includes two rivers (in blue), an airport (bottom left), a mountain (bottom middle) and other parks. These points of interest typically have few surrounding postal codes, so the maps of embeddings are less dense than heavily populated areas. The maps of embeddings include no legend because the magnitude of embeddings is irrelevant (regression weights will account for their scale). Not only are the embeddings smooth, but different dimensions learn different patterns. Recall that a polygon-based embedding model will learn the same shape (subject to the shape of polygons). Since models based on the GDSC depend on coordinates, the embeddings’ shapes are more flexible. Inspecting Figures 9(a) and (b) around the red star, we observe that the embedding values form different shapes, and these shapes are different from the FSA polygons of Figure 6, validating attribute (coordinate).
Visually inspecting embedding dimensions on a map for the Island of Montreal.

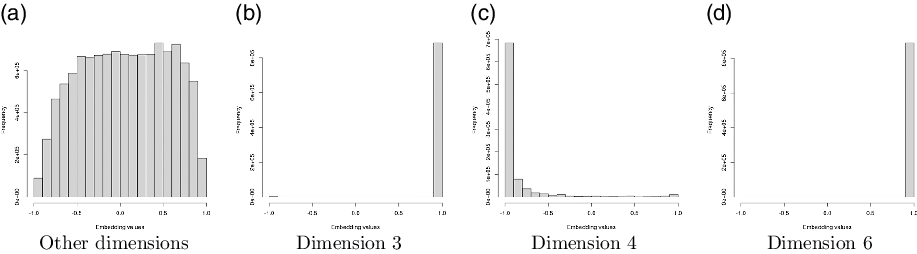
When viewing embedding maps, we diagnosed an issue of embedding saturation, as discussed in Section 4.5. Saturated embeddings all equal the value –1 or 1, and because of the flat shape of the hyperbolic tangent activation function, the gradients of the model weights are too small for the optimizer to correct the issue. In Figure 10, we present the histogram of the embedding values for dimensions 3, 4, 6, and the remaining dimensions combined. A good embedding will have values distributed along the entire support [–1, 1], as presented in Figure 10(a). Dimensions 3 and 6 are heavily saturated, having most values equal exactly 1 or –1. If one includes embedding dimension 6 in a GLM, the feature will replicate the model intercept exactly. Embedding dimension 3 is less problematic since there is a small proportion of –1 values but still exhibits saturation. Most embedding values from dimension 4 are saturated at –1 but also have other values on the support of the activation function, which could provide useful information. We decide to discard embedding dimensions 3 and 6 for our applications. We visually conclude that the remaining embedding dimensions satisfy all desirable attributes to of geographic embeddings.
Histogram of embedding dimensions. Dimensions 3 and 6 are saturated.

5. Applications
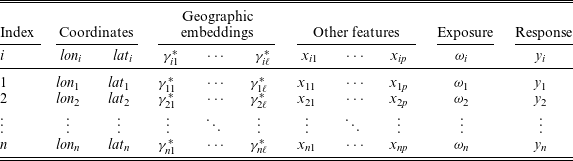
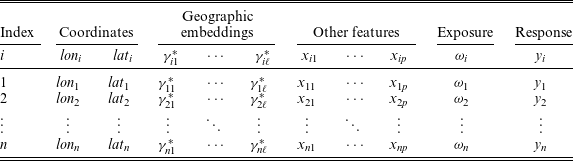
In this section, we present applications of geographic embeddings within predictive models for accident frequency. We present the regression parameters along with p-values in Appendix A for every model in this section. For all applications, we organize datasets as in Table 2. All applications are on Canadian data, so we project the coordinates to Atlas Lambert. Each observation also has geographic embeddings to describe the geography of the observation. The geographic embeddings remain the same, no matter the application. Finally, we have typical non-geographic information like traditional actuarial features, the exposure and the response variable.
Example of a geographic dataset with geographic embeddings.
5.1. Dataset 1: Car accident counts
The first application is to predict car accident frequency in different postal codes on the Island of Montreal between 2012 and 2017. The city of Montreal publishes an open dataset including the coordinates of the closest intersection of car accidents (https://donnees.montreal.ca/ville-de-montreal/collisions-routieres). We allocate the accidents to the nearest postal code. We organize data as in Table 2, with each observation representing one postal code. We use the years 2012–2016 for the training dataset, which contains 116,118 car accidents. We keep the year 2017 as an out-of-sample test dataset, containing 19,997 car accidents.
The model for the first application is a generalized additive model with a Poisson response to model the accident count. The relationship between the expected value of the response variable Y, the coordinates and the geographic embeddings is given by
 \begin{equation} \ln(E[Y_i]) = \beta_0 + \underbrace{f_k(lon_i, lat_i)}_{\text{spline component}} + \underbrace{\sum_{j = 1}^{14}\gamma^*_{ij} \beta_{j},}_{\text{embedding component}} i = 1, \dots, n,\end{equation}
where
 $f_k$
is a bivariate spline function with
 $k\times k$
knots (in our application, a bivariate tensor product smooth, see Wood (Reference Wood2012) for details). Note that there are no traditional variables for the model described in (2). The number of knots in the splines is a hyperparameter controlling flexibility. Model (2) contains a smooth geographic component from the bivariate spline, along with a linear geographic embedding component. One notices an advantage of geographic embeddings: instead of dealing with geographic coordinates directly, they capture geographic effects linearly with regression coefficients. Since geographic embeddings satisfy TFL, a linear combination of geographic embeddings also follows TFL. Geographic embeddings do not entirely replace geographic models: it is simple to combine traditional geographic models with the embeddings.
We compare the models with only the embedding component (
 $k = 0$
with embeddings), models with only spline components (
 $k > 0$
without embeddings) and combinations of embeddings and splines (
 $k > 0$
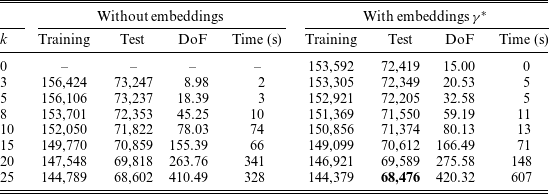
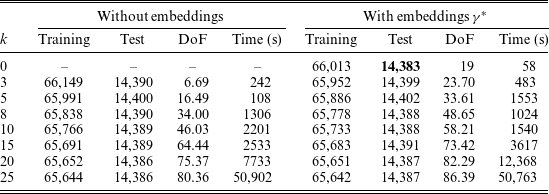
with embeddings). Table 3 presents the training deviance, test deviance, model degrees of freedom (DoF) and training time in seconds using the restricted maximum likelihood method using the mgcv R package. The DoF from the embedding component is constant at 14. For the spline component, we provide the effective DoF, which corresponds to the trace of the hat matrix of spline predictors; see Wood (Reference Wood2012) for details. The training times are based on a computer with Intel
 $\circledR$
 $$ \rm{Cor{e^{TM}}}$$
i5-7600K CPU @ 3.80GHz.
Performance comparison for car accident count models.

One observes that for fixed k, including embeddings in the model decreases both train and test deviance. Increasing k, the number of knots in the spline component increases the effective DoF more than linearly. On the other hand, including the embedding component increases the effective DoF by 14 since embeddings’ dimension remains the same. The number of knots needed in a spline model without embeddings to outperform the GLM without splines is
 $k = 7$
, with 36.81 effective DoF. To improve model performance, it is generally more advantageous to add the embedding component than to increase the number of knots in the splines (based on the increase in effective DoF and the increase in training time).
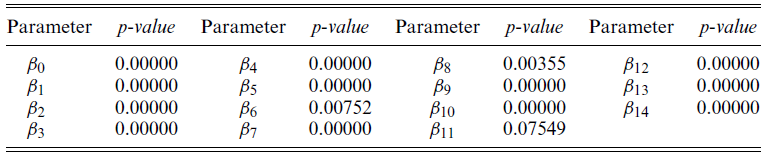
To evaluate the embeddings extrinsically, one can study the statistical significance of the regression parameters. We have 13 embeddings that have statistically significant regression coefficients at the 0.05 threshold, with 11 also statistically significant at the
 $10\times 10^{-5}$
level, which means that geographic embeddings capture useful features.
5.2. Dataset 2: Fire incident counts
The second application predicts fire incidents in different postal codes in Toronto between 2011 and July 2019. The data come from City of Toronto Open Data (https://open.toronto.ca/dataset/fire-incidents/). The dataset contains the coordinates of the nearest major intersection of fire incidents, which we allocate to the nearest postal code. We organize data as in Table 2, with each observation representing one postal code. We use the years 2011–2017 for the training dataset, containing 12,540 incidents. We keep the year 2018 and the first half of 2019 as out-of-sample test dataset, containing 2918 incidents.
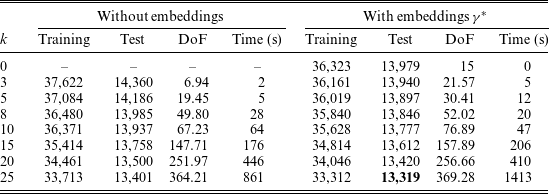
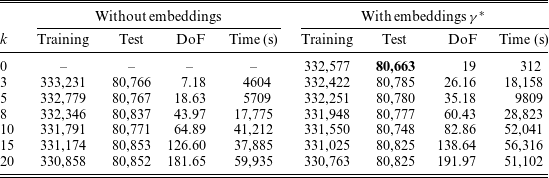
The model for the second application is also a generalized additive model with a Poisson response. The relationship between the expected value of the response variable Y, the coordinate predictors and the geographic embeddings is still (2). Table 4 presents the training and test deviance, along with effective DoF and training time (still based on a computer with Intel
 $\circledR$
 $$ \rm{Cor{e^{TM}}}$$
i5-7600K CPU @ 3.80GHz.). One draws similar conclusions to the first application: increasing k reduces the train and test deviance, and so does including geographic embeddings in the model. The number of knots needed in a spline model without embeddings to outperform the GLM without splines is
 $k = 8$
, with 49.8 effective DoF.
Performance comparison for fire incident models.

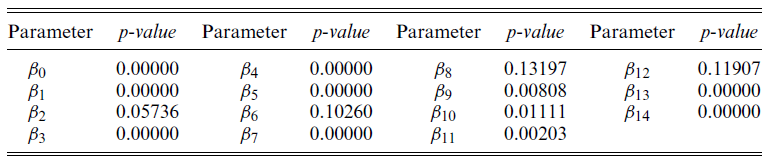
There are 10 embeddings with statistically significant regression coefficients at the 0.05 threshold, with seven also statistically significant at the
 $10\times 10^{-5}$
level. In the car accident application, the only regression coefficient that was not significant at the 0.05 level was
 $\beta_{11}$
, which is highly significant for the fire incidents frequency model.
The applications of datasets 1 and 2 compare the performance of geographic splines and geographic embeddings. One observes that GAMs without embeddings outperform GLMs with embeddings once the number of knots was sufficiently high. This finding is not surprising: the geographic embeddings in Section 4 depend on socio-demographic variables. Other geographic effects (meteorological, ecological, topological) could also affect the geographic risk. However, adding the embeddings to the model increased the performance, so that models should include embeddings for both datasets. One concludes that the geographic distribution of the population partially explains the geographic distribution of car accidents and fire incidents. Since residual effects (captured by the GAM splines) improve the model, socio-demographic information does not entirely explain the geographic distribution of risk. These conclusions hold for two highly populated cities (Montreal and Toronto) and for two predictive tasks that are not directly related to insurance, but which model P&C perils (car accident and fire incident counts).
5.3. Dataset 3: Home insurance
The third dataset contains historical losses of home insurance contracts for a portfolio in the province of Quebec, Canada, between 2007 and 2011. The data come from a large Canadian P&C insurance company and contain over 2 million observations. The home insurance contract covers six perils, including fire, water damage, sewer backup (SBU), wind & hail (W&H), theft and a final category called other. The dataset provides the house’s postal code for each observation, so we set the coordinates as the central point of the postal code and extract the embeddings from that same postal code. We also have traditional actuarial variables describing the house and the customer for each contract, along with the contract’s length (exposure
 $\omega$
, treated as offsets in our models). We organize data as in Table 2, with each observation representing one insurance contract for one or fewer years. For illustration purposes, we select four traditional variables in the models, including
 $x_1$
: age of the building,
 $x_2$
: age of the client,
 $x_3$
: age of the roof and
 $x_4$
: building amount.
The third application uses a GAM with a Poisson response to model the home claim frequency. The relationship between the response variable Y and the traditional variables, the geographic embeddings and the exposure is
 \begin{align} \ln(E[Y_i]) & = \beta_0 + \ln \omega + \underbrace{\sum_{j = 1}^{4}x_{ij} \alpha_{j}}_{\text{traditional component}} + \underbrace{f_k(lon_i, lat_i)}_{\text{spline component}} + \underbrace{\sum_{j = 1}^{14}\gamma^*_{ij} \beta_{j},}_{\text{embedding component}} \nonumber\\ & \quad i = 1, \dots, n.\end{align}
The training times provided for all home insurance dataset comparisons are based on a computer with two Intel
 $\circledR$
Xeon
 $\circledR$
Processor E5-2683 v4 @2.10GHz (about 3.7 times faster than the i5 processor when running at full capacity).
5.3.1. Home accident frequency in Montreal
In the first comparison with the home insurance dataset, we attempt to predict the total claim frequency for an insurance contract on the Island of Montreal. The training data are calendar year losses for 2007–2010, while the test data are the calendar year losses for 2011. Table 5 presents the training and test deviance, along with effective DoF and training time.
Performance comparison for home total claim frequency models (Montreal).

The best model is the GLM with embeddings. Including splines with embeddings does not improve the model: although the training deviance decreases, the test deviance increases. One concludes that when smoothing the frequency of rare events with limited observations, splines learn patterns that overfit on observed loss experience and do not learn geographic effects that generalize to new observations. These conclusions are in contrast to the applications of Sections 5.1 and 5.2 (which had higher frequencies), where increasing the knots decreased the test deviance.
5.3.2. Home claim frequency in the entire portfolio
In the second comparison with the home insurance dataset, we train the ratemaking models on the entire province of Quebec. This application is most representative of the ratemaking models in practice. We note that dataset 1 (Montreal) covered 365 km2, dataset 2 (Toronto) covered 630 km2, while this application covers almost 1,400,000 km2, so the spline component will require a much larger number of knots to replicate the flexibility of the models in Sections 5.1, 5.2 and 5.3.1. Also, most of the area in Quebec is uninhabited, so much of the flexibility is wasted on locations with no observations. The geographic embeddings in this application are the same as the previous applications, so the models with geographic embeddings have the same flexibility without significantly increasing the effective DoF. Table 6 presents the training and test deviance, along with effective DoF and training time for models. Note that we omit
 $k = 25$
since training the model would require too much RAM on the compute server.
Performance comparison for home total claim frequency models (Province of Quebec).

Once again, the best model is the GLM with embeddings. One observes a decreasing trend in the training deviance as k increases, but an increase in test deviance follows. One concludes that geographic embeddings capture all significant geographic risk, and splines overfit the training data without generalizing to new observations.
5.3.3. Extrinsic evaluation for home claim frequency
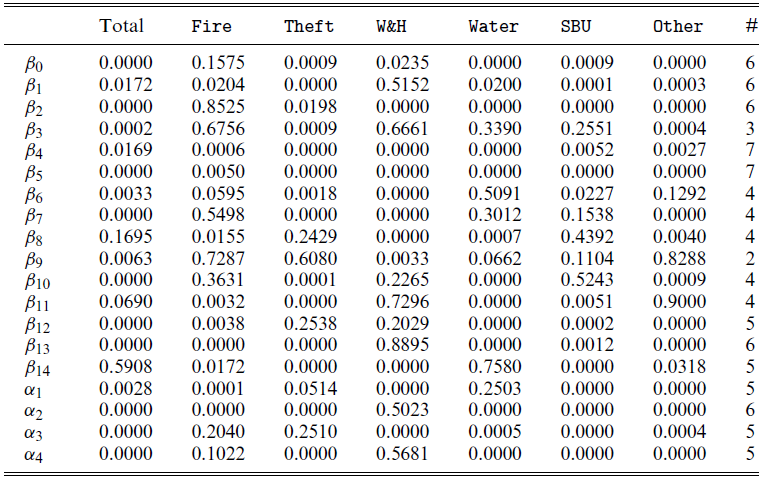
We now extrinsically evaluate geographic embeddings for predicting home insurance claim frequency. The home insurance contracts in our dataset cover six perils. We train seven GLM models with geographic embeddings and the four traditional variables: one for the total claims frequency and six for the claim frequency decomposed by individual peril. Recall that p-values are available in the Appendix. For clarity and simplicity, we use the abuse of terminology significant embeddings to mean that the regression coefficient associated with an embedding dimension is statistically significant, based on the p-value and a 0.05 threshold. There are 12 embedding dimensions that are significant for the majority of models, and regression coefficients
 $\beta_4$
and
 $\beta_5$
are significant for all models. The signs of the regression coefficients are not the same for every peril, meaning some embedding dimensions have different directions on predictions across perils.
The peril GLMs with the most significant geographic embeddings are theft and other. Since the embeddings capture socio-demographic effects, it makes sense that the theft peril, which one mostly associates with socio-demographic actions, has the highest number of significant embeddings. The authors have no knowledge of the contents of the other peril so we avoid interpreting this result. The perils with the least number of significant embeddings are fire and W&H. One notices that wind and hail are a meteorological phenomena, making sense that geographic embeddings, built on socio-demographic variables, are not all significant. One concludes that geographic embeddings generate statistically significant regression coefficients, so they are useful for ratemaking models. This conclusion holds when deconstructing the claim frequency into individual perils.
5.3.4. Predicting in a new territory
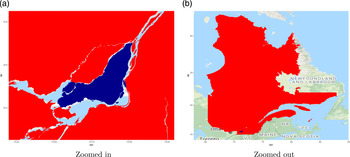
In the third comparison with the home insurance dataset, we determine if embeddings can predict geographic risk in a territory with no historical losses. On the one hand, we train a GLM with embeddings on a dataset with no historical losses from a sub-territory. On the other hand, we train a GLM with embeddings or a GAM with bivariate splines on a dataset with observations exclusively from that sub-territory. Then, we compare the performance of both approaches. To study this question, we split the dataset into two territories; Figure 11 illustrates an example for the Island of Montreal. The set of polygons in blue represents the Island of Montreal (see Figure 11(a) for a focused look on the island), and in red is the remainder of the province (see Figure 11(b) for the entire province, with Montreal in blue at the bottom left). We train a Poisson GLM with embeddings for the two datasets: model out of territory (OOT) trains on all observations in the province except Montreal (red area), while model within the territory (WT) trains on observations in Montreal (blue area). Therefore, model OOT never saw any observations from Montreal. We also train a Poisson GAM with
 $k = 10$
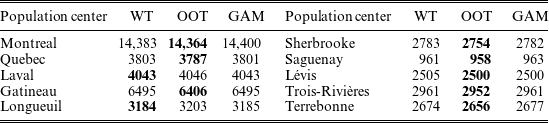
as a baseline. All models use 2007–2010 calendar years for training data. Then, we compare the performance of the models on Montreal in 2011 (blue territory). The test deviance for model OOT is 14,364, while the test deviance for model WT is 14,383. In Table 7, we reproduce the results for the population centers in Quebec with a population of over 100,000 and present the deviance computed on 2011 data.
Test deviance with different training datasets by population centers.

Blue (darkest): Island of Montreal, red (lightest): Rest of Quebec.

The models trained with OOT typically have smaller test deviance, so generalize better. For a few population centers, it is more beneficial to use data from the actual territory, but GLMs with geographic embeddings still outperform GAMs. These results lead to an important conclusion: to predict geographic risk in a sub-territory of a dataset, it is more advantageous to use geographic embeddings on a model trained with a larger quantity of losses, no matter where these losses occur, than to train a model using data from the sub-territory exclusively. When performing territorial ratemaking with traditional methods like GAMs, one typically focuses on one sub-territory at a time, thus ignores the remainder of the training data. On the other hand, OOT models use much larger datasets than the WT or GAM models, and this increased volume is more beneficial to improve the predictive performance than only studying the information from the territory of interest. This means that a model using geographic embeddings on a large quantity of information can improve geographic prediction in a territory with no historical losses better than if one had historical losses. In practice, one would not intentionally omit the observations in a sub-territory to predict the geographic risk: we construct this comparison to show that GLMs with embeddings can predict the geographic risk in territories with no historical losses.
6. Conclusion and discussion
This paper shows that geographic models (bivariate splines) are sometimes unnecessary to capture the geographic distribution of risk. Instead, we can first capture the population’s geographic distribution within a geographic representation learning model. Using the embedding in a simpler model such as a GLM predicts the geographic risk of home insurance losses more accurately than explicit geographic GAMs and enables predicting losses in territories with no historical losses.
The ideas of Sections 3 and 4 require much technical knowledge on neural networks and geographic models. These skills are outside of the typical actuary’s knowledge, although this is rapidly changing. One main advantage of the geographic embedding approach is that another analyst can use them within any predictive model after constructing the geographic embeddings. In both applications of Section 5, we use the same set of embeddings for postal codes; we did not need to create specific representations for specific applications since we keep the geographic embeddings general. This could lead to a new relationship between actuaries, other domain experts and data scientists: one of a streamlined process of creating representations of novel sources of data, followed by actuarial modeling within existing models, akin to an assembly line.
Training the embeddings in Section 4 required no knowledge of the insurance industry nor insurance data. The resulting embeddings are a geographic compression of socio-demographic information from census data. For this reason, the same set of embeddings could also be used for other tasks in domains where socio-demographic information could be useful, including life insurance, urban planning, election forecasting and crime rate prediction.
Note that embeddings do not entirely replace geographic models: they provide a simple way of compressing socio-demographic data into a vector. In some cases, GLMs using geographic embeddings are useful enough to avoid complex geographic models. In others, they provide a simple vector of features such that ratemaking models perform well.
We offer two justifications of why we believe geographic embeddings perform so well. First, the embeddings capture geographic patterns that represent census information on a location and its neighbors. Since human-generated risks are closely related to human information, the geographic distribution of census embeddings will likely be related to the geographic distribution of risks. Therefore, a model using the census embeddings, even one as simple as a GLM, will capture complex geographic risk. Second, insurance data are noisy, so a model requires a high volume of historical losses to generate credible predictions. To build a geographic model, one can only use a subset of data to learn the geographic effect: the size of territories must be large enough to achieve credibility. When using geographic embeddings, the same features are used for the entire model, so the regression parameters associated with the geographic embeddings achieve credibility faster using fewer parameters. One can interpret these two claims as follows: observations from Montreal can help predict the geographic risk in Quebec since they both use the same geographic features. If an embedding dimension in Montreal generates higher risk, a GLM will capture this effect. An observation in Quebec with a similar embedding dimension will predict a similarly higher risk, making sense because similar embedding dimensions imply similar census data, meaning the same type of individuals inhabits both places so that the socio-demographic risks will be similar.
We proposed one intrinsic evaluation for geographic embeddings. For more, we could look at the field of NLP, where embeddings are used for many applications (Mikolov et al., Reference Mikolov, Grave, Bojanowski, Puhrsch and Joulin2017). Researchers in this field have developed a set of tasks to evaluate the quality of embeddings. A common intrinsic evaluation task for NLP is computing a similarity distance between different two word embeddings and comparing the results with human similarity ratings from datasets like wordsim353 (Finkelstein et al., Reference Finkelstein, Gabrilovich, Matias, Rivlin, Solan, Wolfman and Ruppin2002). One can also compare the similarity between different locations. For example, select three coordinates: two from similar territories and one from a dissimilar one. Embeddings intrinsically make sense if the similar territories have a smaller cosine distance than with the dissimilar embedding. This task depends on human interpretation, so without a survey asking many participants to rate the similarity of various territories, this intrinsic evaluation is not reliable for geographic embeddings. Future work on geographic embeddings could perform such a survey for an additional intrinsic evaluation.
Acknowledgments
The first author gratefully acknowledges support through fellowships from the Natural Sciences and Engineering Research Council of Canada (NSERC) and the Chaire en actuariat de l’Université Laval. This research was funded by NSERC (Cossette: 04273, Marceau: 05605). We thank the editor and three anonymous reviewers for providing valuable comments and suggestions to improve the clarity of this paper. We thank Intact Financial Corporation along with the support and comments from Frédérique Paquet, Étienne Girard-Groulx and Étienne Bellemare-Racine. We train geographic embeddings in PyTorch (Paszke et al., Reference Paszke, Gross, Chintala, Chanan, Yang, DeVito, Lin, Desmaison, Antiga and Lerer2017). For statistical models, we use R Core Team (2020) and we fit GAMs with the mgcv package (Wood, Reference Wood2012).
Supplementary Material
To view supplementary material for this article, please visit https://doi.org/10.1017/asb.2021.25.
Appendix A Significance codes for GLM models
p-values for car count GLM model.

p-values for fire count model.

p-values for the GLMs by peril.