Introduction
Uncovering mechanical properties, such as Young’s modulus, Poisson’s ratio, hardness, yield strength, and ultimate strength, have become critical factors for conducting research and design of engineering materials. Among all the materials properties, Poisson’s ratio, defined as the negative of the ratio of the lateral strain to the axial strain for a uniaxial stress state, is one of the important material properties to be used to determine the material’s brittleness or ductility and contractibility or expandability. It is interrelated among elastic constants for isotropic solids and important for any material research or structure design where dimensional changes resulting from the application of the applied force need to be considered. In the early times, Poisson’s ratio was characterized at macroscale from stress strain relationship through tensile testing [1, 2]. During the last 20 years, researchers have become more interested in characterizing mechanical properties of advanced engineering materials in nanoscale, such as thin films, coatings, nanostructured materials, and interface/interphase, with which the conventional macroscale testing techniques, such as the tensile test, are ineffective or inapplicable. One of the resulting novel techniques, termed nanoindentation, has become ubiquitous for mechanical property characterization of a small volume material at its surface [Reference Doerner and Nix3, Reference Oliver and Pharr4, Reference Hainsworth, Chandler and Page5, Reference Hay, Bolshakov and Pharr6, Reference Hu, Lynne and Delfanian7].
The Hertzian contact equation is the basis for the indentation test procedure, which requires making the key assumption that Poisson’s ratio of the material being tested is known a priori. Bamber et al. [Reference Bamber, Cooke, Mann and Derby8] discussed experimental determination of Young’s modulus by both nanoindentation and acoustic microscopy and graphically determined the Young’s modulus and the Poisson’s ratio simultaneously by the intersection of the acoustic curve with the nanoindentation curve. This approach measures properties on very different timescales which might call into question the accuracy of such an approach—although time dependence for fused silica is probably weak over range of seconds to microseconds (the upper end of acoustic frequencies); for other materials, especially thin in dimensions, this approach might be less conclusive. García and Rasty [Reference Cárdenas-García and Rasty9] explored the Hertzian contact equation for the indentation in the loading portion with a spherical indenter by not assuming a priori the value for Poisson’s ratio. The choice of Poisson’s ratio was done in such a way as to attempt to reduce the error in measuring the specimen’s Young’s modulus. A least-squares approach was used to simultaneously obtain the Young’s modulus and Poisson’s ratio for bulk materials. The method was validated by a couple of bulk materials. Green [Reference Green10] showed the location of the maximum elastic equivalent stress both in spherical and cylindrical Hertzian contacts based on the distortion energy and the maximum shear stress theories. The corresponding Poisson’s ratios were found. It showed that the equivalent stresses decreased as Poisson’s ratio increased (i.e., as the material approaches incompressibility). Liu and Wang [Reference Liu and Wang11] used indentation with a spherical indenter for the measurement of the Young’s modulus and Poisson’s ratio of a thin-film coating and its substrate based on the extended Hertz theory for the contact of coated bodies. The Young’s modulus and Poisson’s ratio were determined simultaneously through minimizing the difference between the measured and specially defined modified Young’s moduli. Jung et al. [Reference Jung, Ko, Lee and Park12, Reference Jung, Lee and Park13] discussed two different techniques, i.e., bulge test and nanoindentation test, to measure mechanical properties of thin films. To avoid the effect of the substrate, the modified King’s model was used to estimate the mechanical properties of the thin film. Both techniques can be used to determine Young’s modulus or Poisson’s ratio, but in both cases, knowledge of the complementary variable is needed. However, the effects of the Young’s modulus and the Poisson’s ratio on the measurements from the two experimental techniques are different. Hence, achieving agreement between the techniques means that the Young’s modulus and Poisson’s ratio of thin films can be determined with no a priori knowledge of either. Zheng et al. [Reference Zheng, Choi, Ling and Huang14] performed indentation on tissues for simultaneous estimation of Poisson’s method and Young’s modulus, in which they established the relationship between Poisson’s ratio and the deformation-dependent indentation stiffness for different aspect ratio (indenter radius/tissue original thickness) in the indentation test after making computer-modeling using finite element analysis (FEA). The numerical results showed percentage errors of estimated Poisson’s ratio and corresponding Young’s modulus ranged from 1.7% to 3.2% and 3.0% to 7.2%, respectively, with the aspect ratio greater than one. Clifford and Seah [Reference Clifford and Seah15] used FEA to investigate the effect of the Poisson’s ratios of both the overlayer and the substrate on the nanoindentation of an elastic two-phase system where the elastic overlayer was more compliant than the underlaying elastic substrate. A rigid spherical indenter was used as a probe. A analytical equation for expressing the nanoindentation results was derived using a simple extension of the previously described equation which described the reduced modulus value measured using Oliver and Pharr’s method [Reference Oliver and Pharr4] for any modulus values or Poisson’s ratio values of the overlayer and substrate and overlayer thickness or indenter tip radius. Aw et al. [Reference Aw, Zhao, Norbury, Li, Rothwell and Ren16] investigated the effect of Poisson’s ratio on the deformation of circular elastic membranes with a clamped edge under point loading and finite contact conditions, incorporating auxeticity behaviors of the material, the influence of parameters including the sample thickness, indentation depth, and indenter size. The results showed that negative Poisson’s ratios have direct influence on the membrane deformation as the depth–load curve, the deflection profile, and the contact area. Liu et al. [Reference Liu, Xiao, Wang, Yang and Shu17] deduced a formula of the Poisson’s ratio to describe the viscoelastic-plastic behavior of viscoelastic materials based on the linear rheological constitutive model. Instrumented indentation under various loading conditions and universal creep tests were performed on polyamide 12 samples to obtain the relevant rheological parameters. Results showed that an accurate value of Poisson’s ratio could be gained at a certain loading rate.
So far, the research on the effects of Poisson’s ratio on the material property characterization and the determination of the Poisson’s ratio through indentation testing were mainly focused on the experimental approach using Berkovich or spherical indenters, and the proposed approaches were mostly applied to the thin films. The effects of the Poisson’s ratio on the indentation deformation mechanisms remain unclear. In this paper, FEA was used to systematically investigate the effects of the Poisson’s ratio on the load versus depth curves measured from the nanoindentation testing on bulk materials using a cylindrical flat-tip indenter. Low carbon steel AISI 1018, steel alloy AISI4340, and aluminum alloy 6061T6 were chosen as testing materials. The values of Poisson’s ratio ranged from 0 to 0.49. Based on the modeling data, formulas were proposed to describe the effects of the Poisson’s ratio on the loading part of the load versus depth curves, the hardness, and the pile-up from the nanoindentation tests. The effects from other material properties, such as Young’s modulus, yield strength, and strain hardening, were also considered. The Poisson’s ratio and Young’s modulus of the testing material were determined simultaneously by combining the proposed formulas from this work with the Hertzian contact equation.
Modeling of nanoindentation with a cylindrical flat-tip indenter
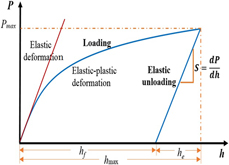
The load–depth curve recorded from the indentation process is critical for extracting the material properties, as shown in Fig. 1. The loading portion has both elastic and plastic deformations while the unloading segment remains entirely elastic recovery. The unloading in the nanoindentation testing plays a key role in extracting the Young’s modulus of the test material based on the Hertzian contact equation [Reference Oliver and Pharr4],
 $${1 \over {{E_{\rm{r}}}}} = {{1 - {\nu ^2}} \over E} + {{1 - \nu _i^2} \over {{E_i}}}\quad ,$$
where E i (=1140 GPa) and νi (=0.07) are the Young’s modulus and Poisson’s ratio of the diamond indenter, respectively; E and ν are the Young’s modulus and Poisson’s ratio of the testing material, respectively; E r is the reduced Young’s modulus, which is calculated by the following equation from the unloading curve in the load–depth curve of a nanoindentation test with a cylindrical flat-tip indenter,
 $${E_{\rm{r}}} = {S \over {2a}}\quad ,$$
where S is the stiffness of the specimen measured by the slop from the upper one-third of the unloading curve, and a is the radius of the cylindrical flat-tip indenter. The hardness H is defined as the ratio of the maximum indentation load to the indenter’s contact area.
Load versus depth curve of a nanoindentation test with a cylindrical flat-tip indenter.

Commercial FEA software ANSYS® (Canonsburg, Pennsylvania) was used and an axi-symmetric solid model was generated for modeling the nanoindentation tests with a cylindrical flat-tip indenter [Reference Hu, Lynne and Delfanian7, 18, Reference Hu, Lynne, Markondapatnaikuni and Delfanian19, Reference Hu, Farahikia and Delfanian20, Reference Hu, Shrestha and Fan21, Reference Shahjahan and Hu22, Reference Hu, Thomas, Thomas, Zachariah and Mishra23]. Axi-symmetric 8-node element type PLANE183 was used. The elements have nonlinear capabilities, such as large strain, large deflection, and elasto-plastic stress–strain of the material constitutive. For modeling the contact between the tip surface of the indenter and the specimen’s testing surface, a surface-to-surface contact model was employed, in which axi-symmetric target element TARGE169 and contact element CONTA171 were adopted. Coulomb and shear stress friction are allowed when two surfaces were contacting and sliding. Due to the computation time limitation and very fine element requirement for high accuracy, the finite element model dimensions are several hundred times smaller than that of the real specimens. For accurately reproducing the material behavior in loading and unloading stages of the indentation and the elastic response from the missing thickness in the modeling, an adaptive 2-node spring element type COMBIN14, a linear longitudinal spring-damper element, was used. These spring elements were vertically connected to each node of the specimen on the bottom of the model to effectively play the role of the missing part of the specimen in the thickness. The spring stiffness coefficients were calibrated by the materials’ Young’s modulus.
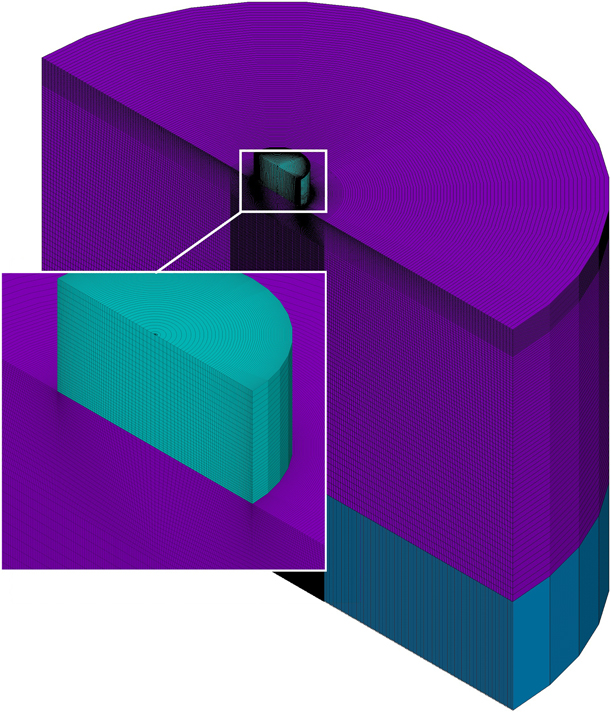
The model was meshed, as shown in Fig. 2. For improving modeling accuracy, the mesh density was checked and refined in the indenter tip and the testing specimen near the indent edge areas where stress and strain concentration arise. The model dimensions were 100 µm in diameter and 50 µm in height for the specimen and 10 µm in diameter for the cylindrical flat-tip indenter. The proper element size and density were determined, as in the current model through the convergence study of the indentation load versus depth so that the model in Fig. 2 is mesh-independent. The total numbers of elements and nodes for the model are 19,025 and 60,377, respectively.
Axi-symmetric FEA model of nanoindentation testing.

The real indenter has a small rounding in the corner, and cylindrical tip in this modeling is of a sharp corner, which would cause modeling error. In order to minimize such error, the element type adopted in the modeling is of a high-order shape function with a midnode in each side and fine meshes were generated around the corner area for better simulating the situations from in-contacting to sliding and off-contacting during the indentation process. Furthermore, the maximum indentation depth is much smaller than the diameter of the indentation tip, which could limit the maximum deflection near the tip corner.
Due to the structural tolerance of the indentation tester and the imperfection of the specimen preparation, the surface of the testing specimen would not be perfectly parallel to the indenter tip contact surface and resulted in a so-called angular misalignment of up to 1°. As the consequence, the contact at the beginning of the indentation loading process would not be the area contact; instead, a line contact could happen, leading to the error in stress–strain field generated in the specimen near the contact surface, as well as the indentation load versus depth data. Usually the angular misalignment within 0.25° would be acceptable [Reference Shahjahan and Hu22]. For minimizing the angular misalignment, in practices, an adjustable specimen holding stage would be preferred.
The boundary conditions were set such that all the nodes on the bottom of spring elements were fixed, and the nodes on the top surface of the indenter could move down and up vertically during indentation loading and unload processes. The friction coefficient between diamond indenter tip and the metallic material specimens was set to 0.15 [Reference Hu, Lynne and Delfanian7, Reference Hu, Lynne, Markondapatnaikuni and Delfanian19].
The materials to be investigated were low carbon steel AISI 1018, steel alloy AISI 4340, and aluminum alloy 6061T6. The material testing data and properties were obtained through tensile tests [Reference Hu, Lynne and Delfanian7, Reference Hu, Lynne, Markondapatnaikuni and Delfanian19]. The Young’s modules and Poisson’s ratio for these three different materials were 208.8 GPa, 0.29; 192.5 GPa, 0.29; and 72.0 GPa, 0.33, respectively. The yield strengths, Y, for AISI 1018, AISI 4340, and Al 6061T6 were taken from the 0.2% offset points from the tensile test [Reference Hu, Lynne and Delfanian7], and they are 0.5602 GPa, 0.6428 GPa, and 0.2611 GPa, respectively. The material strain hardening exponential index, m, obtained from the curve fitting of the true stress-true strain of AISI 1018, AISI 4340, and Al 6061T6 (Fig. 3 in Ref. Reference Hu, Lynne and Delfanian7) are 0.319, 0.156, and 0.401, respectively.
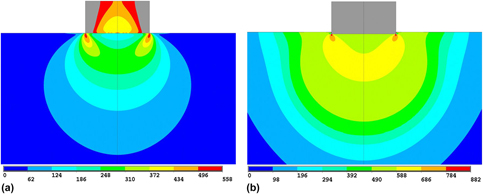
Figure 3 shows the modeling results of the von Mises stress fields in an AISI 1018 specimen during indentation loading process, in which Fig. 3(a) shows the stress field at loading beginning with an indentation depth of 0.025 μm, causing almost elastic deformation (the von Mises stress is less than the yield strength), and Fig. 3(b) shows the stress field at a maximum indentation depth of 0.3 μm. In both cases, the stress concentrations near contacting edge areas were well-simulated with a fine mesh density around these edges, and the stress fields in the specimen are approximately hemispherical contour forms under the contact surface induced by the indentation process and the material properties of the specimen.
Von Mises stress field (MPa) in an AISI 1018 specimen during indentation loading process at indentation depths of (a) 0.025 μm and (b) 0.3 μm.

Modeling results and discussion
Effects of Poisson’s ratio on indentation loading process
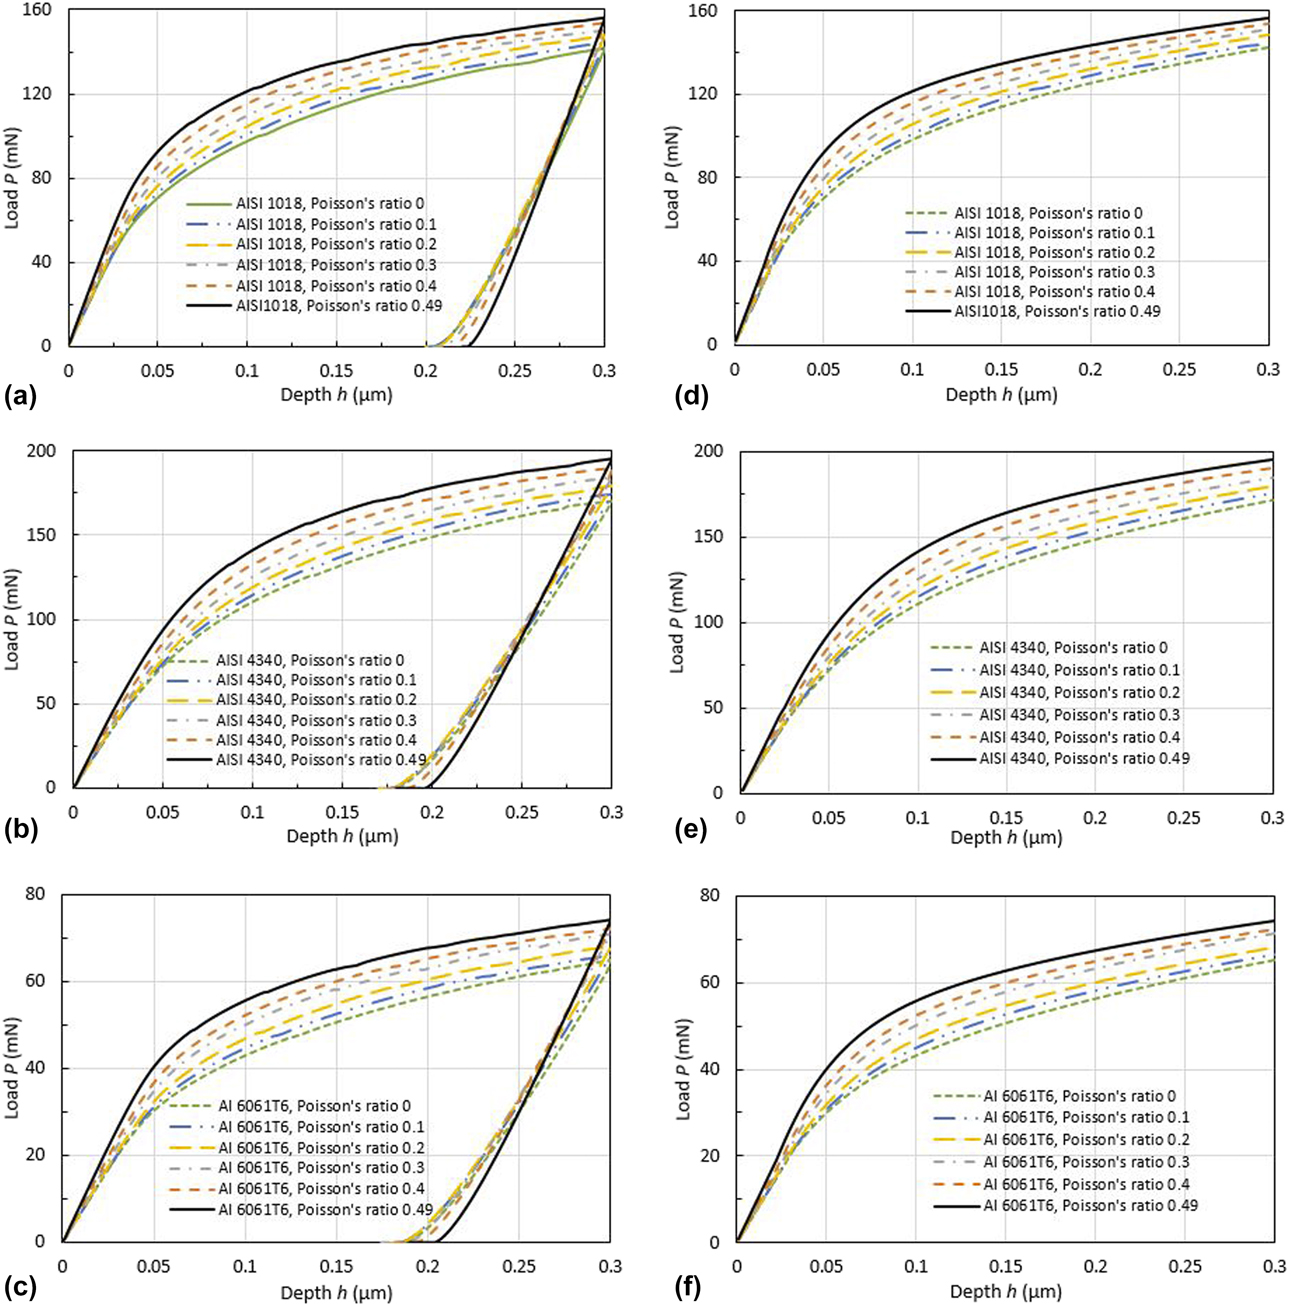
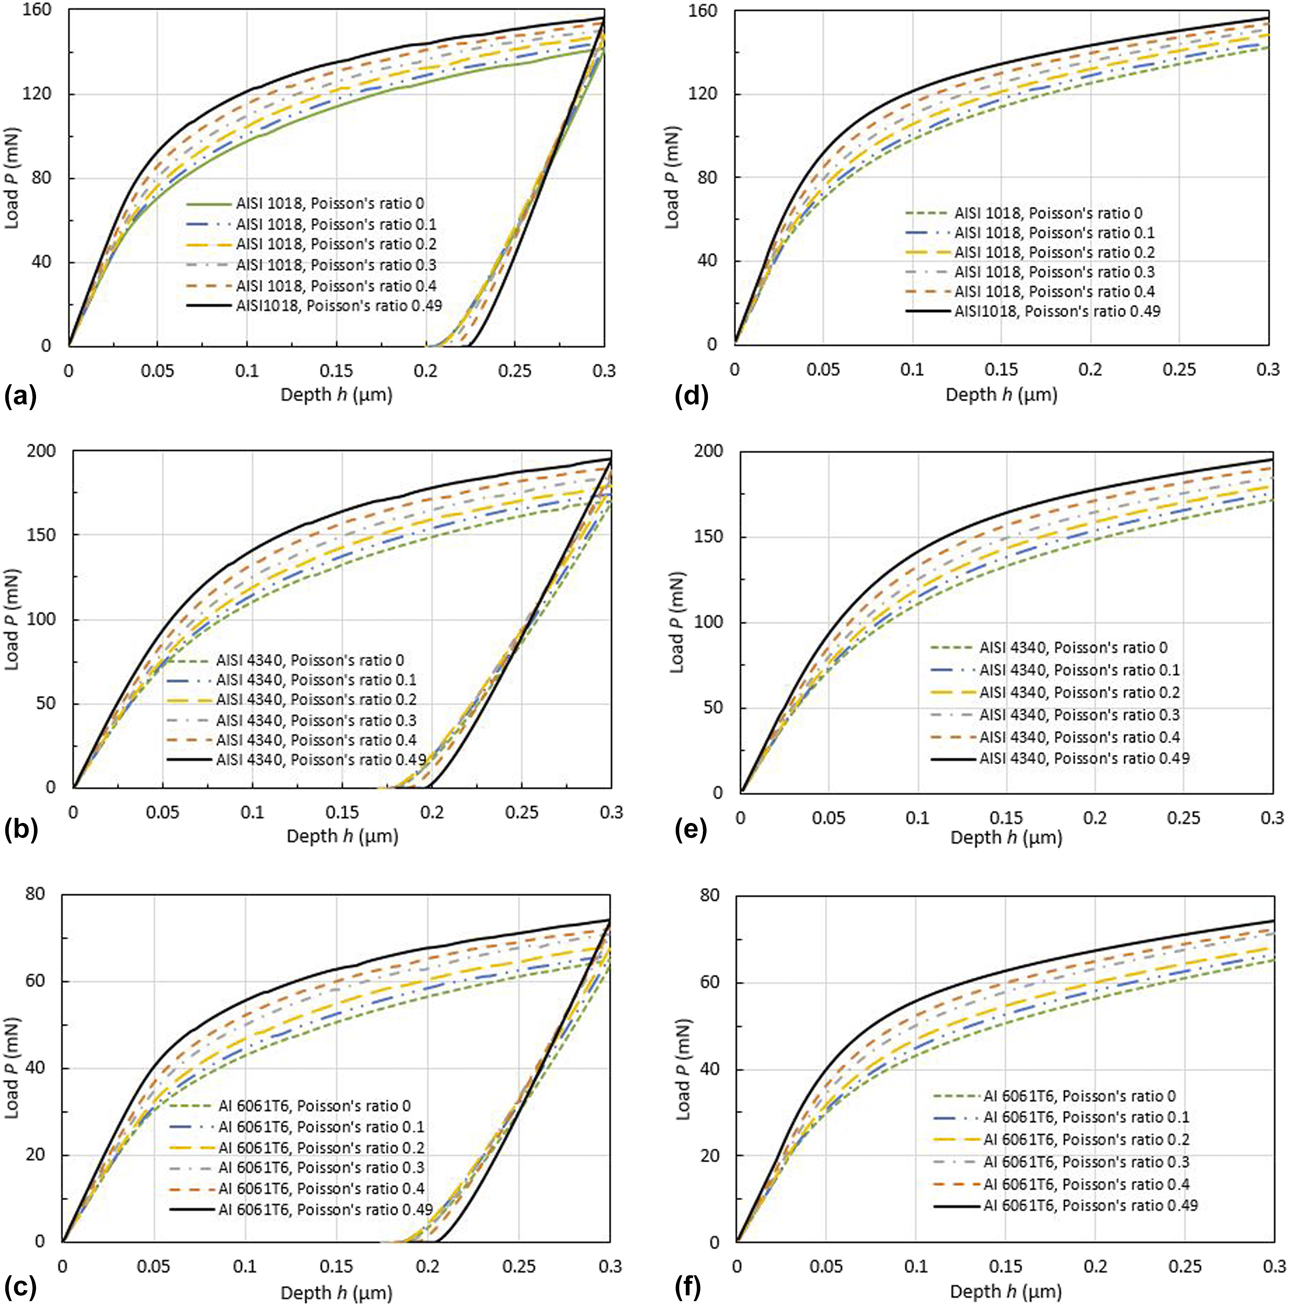
The modeling results of nanoindentation load versus depth curves of loading and unloading processes for the three different materials with Poisson’s ratios ranging from 0 to 0.49 are shown in Figs. 4(a)–4(c). During the indentation loading process, the load increases as the indentation depth increases. At the same indentation depth, the load increases as the Poisson’s ratio increases.
Modeling results of nanoindentation load versus depth for Poisson’s ratios, ν, ranging from 0 to 0.49 and maximum depth, h max, of 0.3 µm: (a) AISI 1018, (b) AISI 4340, and (c) Al 6061T6; the load versus depth during the indentation loading process based on Eq. (3) with the constants from Table I for Poisson’s ratios, ν, ranging from 0 to 0.49 and maximum depth, h max, of 0.3 µm: (d) AISI 1018, (e) AISI 4340, and (f) Al 6061T6.
At the beginning of the indentation process, the load increases almost linearly as the depth increases, even though a small plastic deformation zone with stress concentration was initiated in the specimen’s testing surface near the indent edge, as shown in Fig. 3, and also refers to Figs. 6(a) and 7 in Ref. Reference Hu, Lynne and Delfanian7, and Figs. 19 and 21 in Ref. Reference Hu, Lynne, Markondapatnaikuni and Delfanian19. This linearity is proportional to the Young’s modulus, E. The entire loading curve can be well-represented by the following functions:
 $$\eqalign{P = \cr\left\{ {\matrix{ {{k_0}\left( \nu \right)E\left( {{h \over a}} \right)\;\left( {{\rm{mN}}} \right)} \hfill & {{h \over a} \lt {{{h_0}} \over a}} \hfill & {{\rm{linear}}\;{\rm{part}}} \hfill \cr {{k_1}\left\{ {1 - {k_2}{{\rm{e}}^{ - {k_3}\left( {{h / a}} \right)}}} \right\}{{\left( {{h \over a}} \right)}^{{k_4}}}\;\left( {{\rm{mN}}} \right)} \hfill & {{h \over a} \ge {{{h_0}} \over a}} \hfill & {{\rm{nonlinear}}\;{\rm{part}}} \hfill \cr} } \right.\quad ,$$
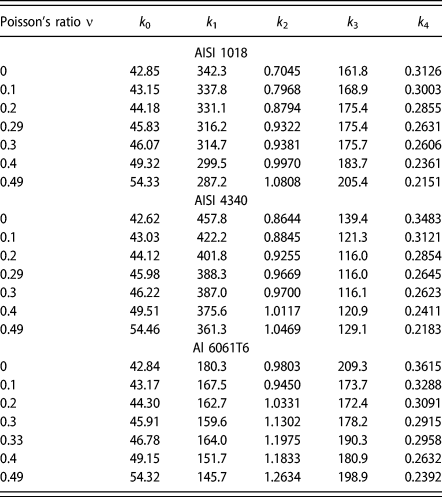
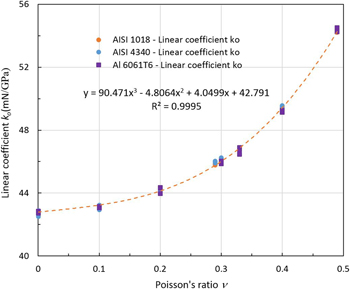
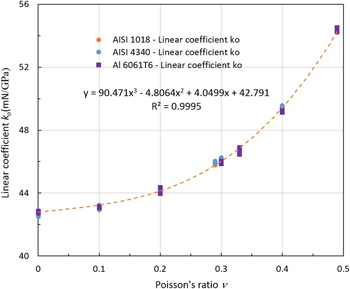
where h/a is the dimensionless indentation depth, h 0 is the elastic limit depth, k 0(ν) is the linear coefficient for the linear part of the loading and is a function of the Poisson’s ratio, ν, the unit of the Young’s modulus, E, is in GPa, and k i (i = 1, 2, 3, 4) are the constants for the nonlinear part of the loading. By curve fitting with the load continuity at h 0, the constants, k i (i = 1, 2, 3, 4), can be obtained using least square optimization method by Excel Solver package and listed in Table I. The linear coefficients of k 0 are consistent for the different Poisson’s ratios for the three materials. The curve fitting for the linear coefficient, k 0, versus Poisson’s ratio, ν, for the maximum indentation depth ranging from 0.2 to 0.4 µm is shown in Fig. 5. The linear coefficient, k 0, is quite sensitive to the value of Poisson’s ratio, ν, when ν value is higher than 0.2. The relationship between k 0 and ν can be well-represented by a third-order polynomial function as
 $$\eqalign{{k_{\rm{0}}}\left( \nu \right) = 90.095{\nu ^3} - 4.4608{\nu ^2} + 3.9555\nu \cr+ 42.798\;\left( {{{{\rm{mN}}} / {{\rm{GPa}}}}} \right)\quad .$$
Constants, k 0, k 1, k 2, k 3, and k 4, in Eq. (3) for AISI 1018, AISI 4340, and Al 6061T6.

The curve fitting for the linear coefficient k 0 versus Poisson’s ratio ν for the maximum indentation depth, h max, ranging from 0.2 to 0.4 µm.

With Eq. (1) and the linear part of Eq. (3), Young’s modulus, E, and Poisson’s ratio, ν, of the testing material could be determined if the cylindrical flat-tip indenter’s contacting surface could fully contact the specimen’s testing surface at initial contacting to form an axisymmetric deformation. Otherwise, if an angular misalignment existed and a nonaxisymmetric deformation generated, consequently, an unknown error would be induced [Reference Shahjahan and Hu22].
The load versus depth relations during the indentation loading process based on Eq. (3) with the constants from Table I for the three materials are plotted in Figs. 4(d)–4(f). Comparing Figs. 4(d)–4(f) with the loading part by modeling in Figs. 4(a)–4(c), they are well agreed.
The nonlinear part of the load versus depth in the loading process involves an elasto-plastic deformation. Therefore, the coefficients of the nonlinear part, k i (i = 1, 2, 3, 4), depend not only on the Poisson’s ratio, ν, but also on the Young’s modulus, E, yield strength, Y, and strain hardening, m, of the material.
Effects of Poisson’s ratio on indentation unloading process
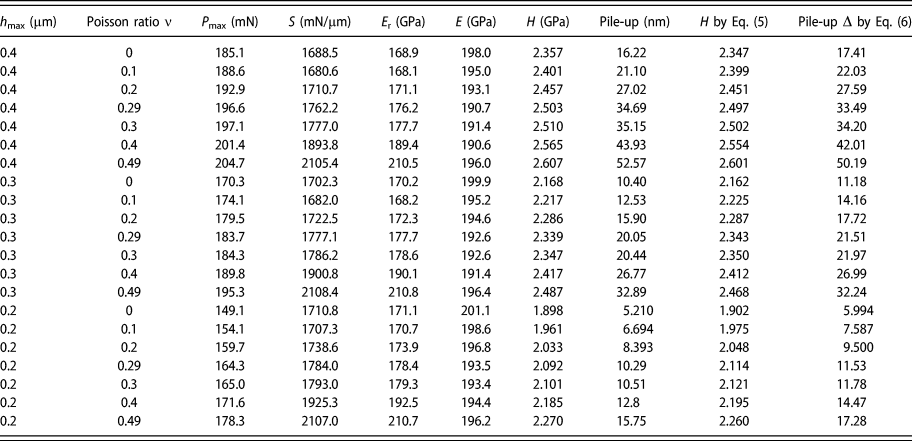
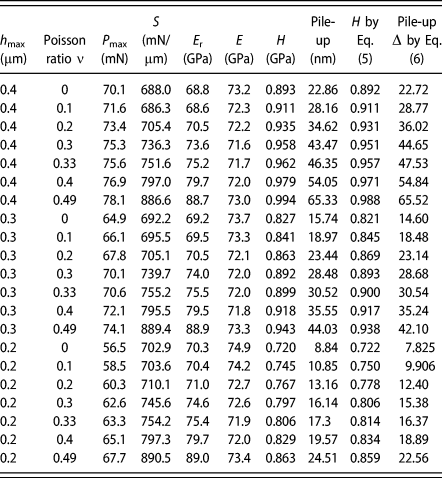
The modeling results of unloading processes for the three different materials with Poisson’s ratios, ν, ranging from 0 to 0.49 are already shown in Figs. 4(a)–4(c). The modeling data and the derived material properties, such as Young’s modulus, E, and hardness, H, from the unloading processes for the three materials with maximum depth, h max, ranging from 0.2 to 0.4 µm and Poisson’s ratio, ν, ranging from 0 to 0.49 are listed in Tables II, III, and IV. It shows that the Young’s modulus, E, is not very sensitive to the Poisson’s ratio, ν, and the differences of the Young’s modulus are within ±4%, increasing as the maximum depth, h max, decreasing.
Nanoindentation modeling data of low carbon steel AISI 1018.

Nanoindentation modeling data of steel alloy AISI 4340.
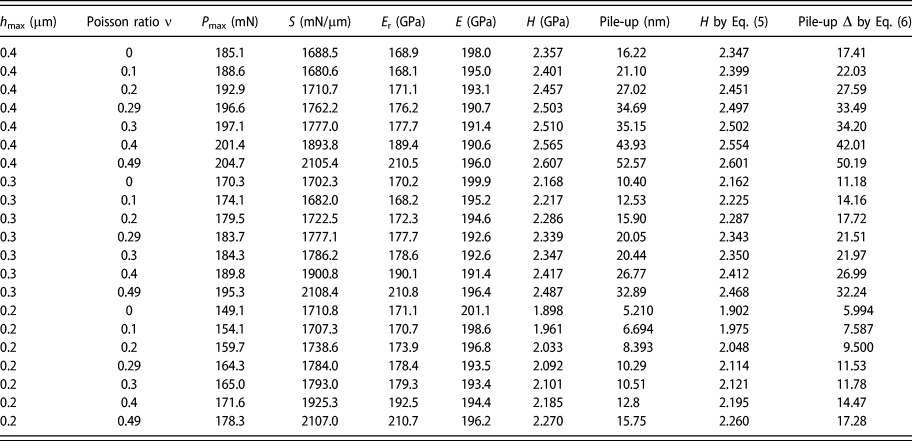
Nanoindentation modeling data of aluminum alloy Al 6061T6.

The hardness, H, is a measure of the resistance to localized plastic deformation, indicating that it depends on Poisson’s ratio, ν, yielding strength, Y, strain hardening, m, of the materials, and the maximum indentation depth, h max (degree of deformation). Based on the exponential relationship between the stress and strain hardening of the materials and the nonlinearity between the deformation and the indentation depth, a relationship was proposed as
 $$\eqalign{H = {p_1}Y\left\{ {1 + {p_2}\left( {{{{h_{\max }}} \over a}} \right) + {p_3}{{\left( {{{{h_{\max }}} \over a}} \right)}^2}} \right\}\left( {1 + {m^{{p_4}}}} \right) + {p_5}{Y^{{p_6}}}\cr\left\{ {1 + {p_7}\left( {{{{h_{\max }}} \over a}} \right) + {p_8}{{\left( {{{{h_{\max }}} \over a}} \right)}^2}} \right\}\left( {1 + {m^{{p_9}}}} \right)\nu \;\left( {{\rm{GPa}}} \right)\quad ,$$
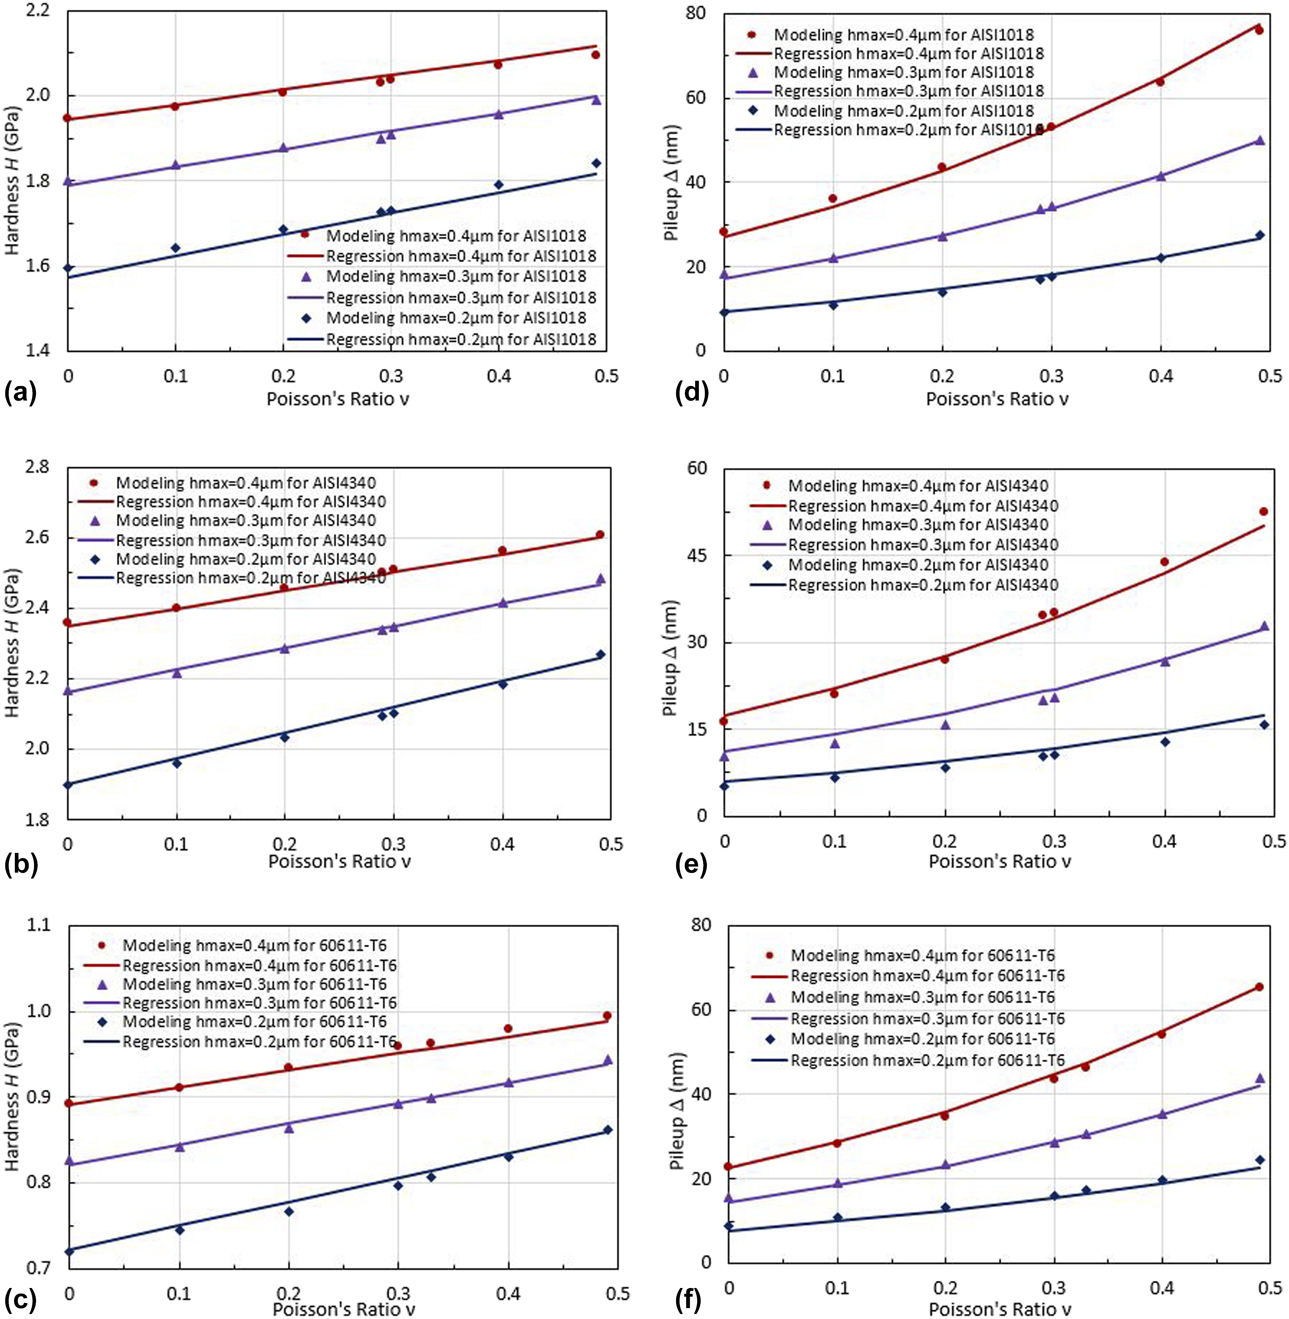
where p i (i = 1, 2, …, 9) are the constants, and their values obtained from the curve fitting are 0.7892, 19.50, −82.05, −0.1302, 0.3128, 0.6375, −5.823, 1.569, and −0.5966, respectively. The modeling results and the curve fitting results by Eq. (5) for Hardness, H, versus Poisson’s ratio, ν with maximum indentation depth, h max, ranging from 0.2 to 0.4 µm for the three materials are compared in Tables II–IV and plotted in Figs. 6(a)–6(c).
Comparison of modeling results with curve fitting results by Eq. (5) for indentation hardness, H, versus Poisson’s ratio, ν, with maximum indentation depth, h max, ranging from 0.2 to 0.4 µm: (a) AISI 1018, (b) AISI 4340, and (c) Al 6061T6; comparison of modeling results with curve fitting results by Eq. (6) for indentation pile-up, Δ, versus Poisson’s ratio, ν, with maximum indentation depth, h max, ranging from 0.2 to 0.4 µm: (d) AISI 1018, (e) AISI 4340, and (f) Al 6061T6.

The hardness, H, increases linearly as Poisson’s ratio, ν, increases. The hardness increases as maximum indentation depth, h max, yield strength, Y, and strain hardening, m, increase. Equation (5) well represents the effects of Poisson’s ratio, ν, on the hardness, H, for these three materials.
The pile-up, Δ, of the specimen is a measure of the height change (a permanent deformation measurement) on the edges of the indent after indentation (i.e., after elastic deformation recovered). It depends on the Poisson’s ratio, ν, Young’s modulus, E, strain hardening, m, and maximum indentation depth, h max. Therefore, based on the similar physical phenomenon and in the similar way, the pile-up, Δ, can be represented by a function of Young’s modulus, E, Poisson’s ratio, ν, strain hardening, m, of the material, as well as the maximum indentation depth, h max, as follows:
 $$\Delta = \delta {m^{{q_1}}}{E^{{q_2}}}{\left( {{{{h_{\max }}} \over a}} \right)^{{q_3}}}{\left( {1 + 0.5\nu } \right)^{{q_4}}}\;\left( {{\rm{nm}}} \right)\quad ,$$
where δ, q 1, q 2, q 3, and q 4 are the constants, and their values obtained from the curve fitting are 559.2 (nm), 0.5717, 0.2815, 1.538, and 4.833, respectively. Young’s modulus, E, is in GPa. The values of the constants in Eq. (6) indicates that the indentation pile-up, Δ, increases as any one of the four variables increases. However, it is more dominated by Poisson’s ratio, ν, and maximum depth, h max. The modeling results and the curve fitting results by Eq. (6) for indentation pile-up, Δ, versus Poisson’s ratio, ν with maximum indentation depth, h max, ranging from 0.2 to 0.4 µm for the three materials are compared in Tables II–IV and plotted in Figs. 6(d)–6(f). Equation (6) well represents the effects of Poisson’s ratio, ν, on the indentation pile-up, Δ, for these three materials.
Conclusions
This study shows that the effects of the Poisson’s ratio on material property characterization by nanoindentation can be evaluated through FEA and formulated based on the modeling data. For a nanoindentation testing with a cylindrical flat-tip indenter, it was found that the linear part at the beginning of the loading process from the load versus depth curve was significantly affected by the Poisson’s ratio and was proportional to the Young’s modulus of the material. The load during the loading process, the hardness, and the pile-up from the indentation can be represented by functions of the Poisson’s ratio, Young’s modulus, yield strength, and strain hardening of the material, as well as the indentation depth. The indentation pile-up was also significantly affected by the Poisson’s ratio of the material. Combining the formulas for the linear part of the loading process and the indentation pile-up from this work with the Hertzian contact equation, the Young’s modulus and the Poisson’s ratio can be determined simultaneously.
Acknowledgments
This work was supported by the Materials Evaluation and Testing Lab (METLAB), the Department of Mechanical Engineering at South Dakota State University, and the State of South Dakota. Computational facility support from University High Performance Computing is gratefully acknowledged.