


1. Introduction
Probably all geophysical two-phase flows (such as snowdrift, suspended sediment in water, desert sand) are dominated by gravitation, which causes the highest drift densities to occur near the surface. As a consequence, a stable density gradient develops (Reference HuntHunt, 1969). As in thermally buoyant flows, this stable particle-density gradient acts to reduce the vertical turbulent exchange coefficients (Reference Lumley and BradshawLumley 1978). As a result, the vertical gradient in, for instance, wind speed increases to maintain a zero shear-stress gradient.
Studies of the buoyancy effect in suspended sediment in water flows (e.g. Reference Adams and WeatherlyAdams and Weatherly 1981; Reference Soulsby and WainwrightSoulsby and Wainwright, 1987) and, more recently, in snowdrift (Reference Wamser and LykossovWamser and Lykossov, 1995; Reference Dery and TaylorDery and Taylor, 1996; Reference BintanjaBintanja, 1998, Reference Bintanja2000a, Reference Bintanjab) have demonstrated that the buoyancy effects induced by suspended particles can be important under realistic flow conditions. The effects may be non-negligible not only near the surface but also at higher levels. Hence, the associated effects on turbulence and on the eddy exchange coefficients probably affect the entire surface layer. For instance, reductions in eddy exchange coefficient due to particle-buoyancy in two-phase flow of up to 40–50% have been calculated (Reference Adams and WeatherlyAdams and Weatherly, 1981; Reference BintanjaBintanja, 2000b). Notably, calculations on the effect of suspended sediment on the near-bottom turbulence have revealed that turbulence levels may collapse irreversibly under high sediment concentrations (Reference WinterwerpWinterwerp, 1999) as a result of the strong buoyancy effects. Reference Wamser and LykossovWamser and Lykossov (1995) demonstrate that simulated and observed snowdrift density profiles agree much better when reduced eddy diffusivities due to particle-buoyancy effects are taken into account.
Snowdrift, being one of the many manifestations of two-phase flow, occurs when loose, dry snow is available at the surface and the wind induces a surface shear stress larger than the shear stress required to initiate saltation and suspension. While being transported horizontally with the mean flow, the particles are carried upward by turbulent motions against the action of gravity until they reach a certain average level, the height of which is determined by their immersed weight and the flow shear stress. Drifting and blowing snow are widespread phenomena over snow-covered regions, such as the seasonal snow covers in North America and Eurasia (e.g. Reference Pomeroy, Gray and LandinePomeroy and others, 1993), the sub-zero upper reaches of mountains and glaciers (e.g. Reference GauerGauer, 1998) and the large ice sheets of Greenland and Antarctica (e.g. Reference RadokRadok, 1970). Generally, vast amounts of snow can be transported horizontally by the prevailing winds. Unlike other two-phase flows (except sea spray), snowdrift exhibits an additional interaction with the ambient medium through the sublimation of particles. Although this is disregarded in this study, snowdrift sublimation may profoundly affect the moisture and heat budgets as well as the thermal stratification of the boundary layer (Bintanja, in press). Here we will focus on the buoyancy effects induced by the stable two-phase density gradient in snowdrift. We will adopt a simple theoretical approach to study how important the buoyancy effects may become under realistic conditions.
2. Theoretical Framework
The destruction of turbulent kinetic energy by particle buoyancy (Bη,) in a two-phase flow with a stable drift-density profile can be expressed as (e.g. Reference Adams and WeatherlyAdams and Weatherly, 1981; Reference BintanjaBintanja, 2000a):

where g is the acceleration of gravity, σ(= ρs/ρa – 1) is the relative excess of particle density (ρs) (in our case, ice) over air density (ρa), and
 is the upward turbulent flux of snowdrift density (η). The particle-buoyancy term enters the turbulent kinetic-energy equation (Reference BintanjaBintanja, 2000a) as a destruction term. The usual balance between upward turbulent diffusion and gravitational settling of suspended mass is as follows (neglecting snowdrift sublimation):

where V is the mean terminal fall velocity of the ensemble of particles. Using Equation (2) and applying first-order closure
 with KX
the eddy diffusivity of quantity X), the particle Richardson number (defined as the ratio of particle-buoyancy destruction and shear production of turbulent kinetic energy) can be expressed as:
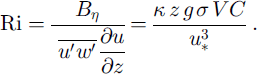
Here, K IS the von Karman constant, u is the horizontal velocity, z is height, C(= η/ρs) is the volume concentration of suspended particles and u* is the friction velocity of the two-phase flow. Note that the denominator of Equation (3) (i.e.
 in non-stratified flow) represents the shear stress. Note also that we have neglected other possible important effects that modify turbulence, such as the generation of turbulence in the wake of heavy particles unable to “follow” the rapid turbulent fluctuations (Reference Yarin and HetsroniYarin and Hetsroni, 1994).
Unlike sediment or sand, snowdrift is always composed of particles with a range of sizes. Generally, snowdrift particle diameters range from 5 to 500 μm (e.g. Reference Budd and RubinBudd, 1966). Evidently, particle fall velocity increases with particle size and mass. Therefore, fall velocities in snowdrift decrease with height (because the mean particle radius decreases with height). According to Reference Pomeroy and MalePomeroy and Male (1992), observations indicate that V ∼ z–1/2. We adopted this functional dependence by assuming

The detailed snowdrift model SNOWSTORM, which simulates snowdrift suspension of the entire spectrum of particle sizes (Reference BintanjaBintanja, 2000a), was used to find the correlation coefficients A and B as a function of u∗, , mean particle radius (in the saltation layer) rm and the parameter a, which represents the ratio of eddy diffusivities of snowdrifting particles and momentum. a>\ represents larger snowdrift eddy diffusivities, which are sometimes assumed to explain observed vertical particle profiles (e.g. Reference Smith, McLean and NihoulSmith and McLean, 1977; Reference DoverDover, 1993; Reference MannMann, 1998). The model results indicate that Equation (4) gives a good approximation at high winds (large u∗), but that at low winds V ∼ z–1 would be more appropriate. Since we are interested mainly in strong wind conditions when stratification effects are most significant, Equation (4) is used in all cases. Running the model for various combinations of values of u∗, a and rm shows that, to a good approximation, A = A(α) and B = B(u∗,rm). The coefficients A and B are parameterized as follows:


in which the various coefficients have the following values: u∗ref = 0.4 ms–1, rmref = 75 /an, a, = 0.11ms–1, b1 = 0.2247 m3/2 s-1, b2 = 0.2704 m1/2, 63 = 0.00146 m3/2 (μm)–1 and 64 = 0.0021 m1/2 (μm)-1. The friction velocity u∗ is in m s–1 and τm is in μm.
Applying first-order closure and Kη = α KU*z, and combining Equations (2) and (4), the equation governing the vertical profile of drift density is:
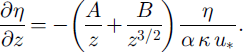
This is easily solved to yield the vertical profile in drift density 77 = 77(2):

where η = ηs
at z = zs, the lower boundary of the suspension layer. zs
is taken proportional to the square of u* (e.g. Reference OwenOwen, 1964), ie.
 Note that an “extra” exponential decline is superimposed on the normal power-law decrease in drift density with height, which is caused by the dependence of V on height using Equation (4).
Reference Pomeroy and GrayPomeroy and Gray (1990) give an empirically derived expression for the drift density in the saltation layer (ηs), which is used here in slightly adapted form (Reference BintanjaBintanja, 2000b):

where e is the saltation efficiency (taken constant at 0.535) and u∗,t is the threshold friction velocity (taken equal to 0.25 m s–1).
Now the particle Richardson number (Equation (3)) can be evaluated. It is a function of u∗ (through the shear stress, the fall velocity (Equations (4) and (6)) and the drift density (Equations (8) and (9)), the parameter a (through Equations (5) and (8)) and the mean radius in the saltation layer (through Equation (6)). Note that the fall velocity appears not only directly in Equation (3), but also implicitly through the drift density (η). Note also that effects of Ri normally feed back into K, reducing its value. Essentially, this constitutes a negative feedback, which is not taken into account because it probably is a second-order effect in most circumstances. The values of Ri calculated here should therefore be regarded as first-order estimates of the strength of the particle-buoyancy effect.
3. Results
First, note that the value of u* specifies the vertical gradient of the wind-speed profile imposed by an external forcing such as a synoptic pressure gradient. Therefore, u, is proportional to the wind speed at any level in the surface layer, say the 10 m level. For the convenience of the reader, it is noted that values of u∗ of 0.4,1.0 and 2.0 m s–1 during snowdrift translate to 10 m wind speeds of 9.5,16.6 and 25.2 ms–1, respectively.
We will investigate whether the above set of equations can simulate realistic values of fall velocity and drift density. Figure 1 shows vertical profiles of both quantities for four distinct cases. Evidently, higher values of u* and a increase the drift density at all levels and reduce its vertical gradient. This is because drift densities near the surface are constrained by processes in the saltation layer specified by Equation (9), whereas larger values of u* and a increase Kq (and hence the upward turbulent flux of particles), resulting in increasing drift densities at higher levels. The fall velocity exhibits similar dependencies on u∗ and a, because it is determined largely by the weight of the sum of the ensemble of particles at each level. However, also a change in particle-size distribution (at the same drift density) tends to modify the mean fall velocity.
Vertical profiles of (a) mean fall velocity and (b) drift density for different values of u* and a. On the ordinate, z is in meters.

First, we have kept a and rm at their standard values (a = 1, rm =75 μm) and varied only u∗. Figure 2 shows the variation of Ri with friction velocity and height. The grey area denotes the region in which Ri > 0.03. This is approximately the region where stratification effects are generally regarded as non-negligible (Reference Soulsby and WainwrightSoulsby and Wainwright, 1987) and hence lead to significant modifications of the vertical mean profiles. Interestingly, close to the surface the particle-buoyancy effects are important for nearly the entire range in u∗ for which snowdrift occurs. The value of Ri generally increases with u∗ (except very close to zs). This may seem to be an obvious feature, but it is not quite so straightforward. It indicates that, in snowdrift for a = 1, the increase in buoyancy destruction with u∗ is larger than the shear production of turbulence (results for other values of a will be discussed later). This evidently depends on how strongly V and η increase with u∗. It may well be that, in other types of two-phase flow, Ri will decrease with u. in stronger winds and that buoyancy effects are generally insignificant. For instance, the results of Reference Soulsby and WainwrightSoulsby and Wainwright (1987) concerning suspended sediment in water demonstrate that Ri generally decreases with u∗ in case of small particles.
Particle Richardson number as a function of u, and height above zs, for a = I The grey area indicates Ri > 0.03. On the ordinate, Z is in meters.
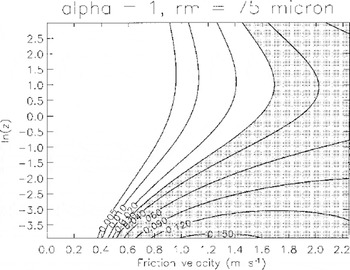
Another interesting feature of Figure 2 is that, while Ri generally decreases with height in the lower reaches, the height range over which buoyancy effects are important increases with u* (above u* = 1.7 m s–1 it is non-negligible everywhere). Moreover, vertical profiles of Ri appear to exhibit a minimum at intermediate heights (z = zmin, above which Ri increases again. Apparently, the decrease in particle-buoyancy with height is stronger than that in shear production in the lower parts of the surface layer, whereas it is lower at higher levels. Shear production of turbulence is proportional to z–1. If Bη ∼ z–n it readily follows that η > 1 for z < zmin and n < 1 for z > zmin. The occurrence of the minimum in the Ri profile is quite a significant feature since it causes particle-buoyancy destruction to be important throughout the entire surface layer under certain ambient conditions (such as strong winds). It is a direct consequence of the fact that snowdrift is always composed of an ensemble of particles with widely varying sizes. Figure 3 shows the height of the minimum in the Ri profile along with the minimum value of Ri. For a = 1, zmin can be easily calculated as zmin = (2B/KU∗)2. Evidently, zmin decreases with u* and can attain quite low values in snowdrift (down to 3–4 m in strong winds). The minimum values of Ri (Rimin) increase with u* and confirm that, in this particular case, particle-buoyancy is important throughout the surface layer for u∗> 1.7 m s–1.
Dependence of zmin and Rimin on u* for α =1. la

To infer how variations in rm affect the buoyancy destruction, Figure 4 shows contour plots of zmin and Rimin as a function of ut and rm. Having smaller particles at the same drift density reduces the height of the minimum in Ri. This is because smaller particles reduce the mean fall velocity (through Equation (6)), which, in turn, causes higher drift densities. Apparently, the latter effect dominates the effect of lower fall velocities in Equation (3) to produce higher values of Ri. Hence, all other conditions being the same, the particle-buoyancy effect is likely to be more important in regions with relatively low mean particle radius (such as cold and dry environments) than in regions with predominantly larger particles. Reference Soulsby and WainwrightSoulsby and Wainwright (1987) evaluate the buoyancy effects of suspended sediment in water for monodisperse mixtures and demonstrate that particle size determines to a large extent the magnitude of Ri because of its effect on V.
Contour plots of (a) zmin and (b) Rimin against u∗ and rm. In (a), the grey area indicates heights of <5m, while in (b) it denotes Rimin>0.03.

Next, we will investigate the effects of variations in a. The parameter a is a very important one as it directly influences the upward turbulent transport of particles. Figure 5a and b show the values of Ri as a function of u. and a at 0.1 and 15 m above zs. Evidently, higher values of a induce stronger stratification effects, because more particles are carried to upper levels. At high a, particle stratification effects are generally non-negligible for any u* for which snowdrift occurs. Very large Ri values can be attained for high a. Such high Ri values are not realistic, though, as the dampening effect of turbulence on the upward particle diffusion is not taken into account. They merely demonstrate the potential importance of the particle-buoyancy effect in these cases. Figure 5c depicts the height of the minimum in Ri; this can be calculated analytically by taking ∂Ri/∂z = 0 and using Equations (3), (4) and (7). As might be expected, the level of zmin decreases as a increases since more suspended particles tend to increase Ri values at high levels, pushing zmin downwards.
Particle Richardson number as a function of u∗ and a at (a) 0.1m above zs and (b) 15m above zs, where grey areas indicate Ri > 0.03. In (c), zmin is shown as a function of u* and a, where grey areas indicate zmin < 1.5m.

Interestingly, at high values of a there appears to be a distinct maximum in Ri at intermediate values of u∗ (Fig. 5a and b). This maximum shifts to higher u* values with increasing height. This feature is caused by the fact that the average fall velocity has two opposing effects on Ri. Increasing values of V enhance Ri directly (see Equation (3)), whereas they tend to diminish drift densities and hence Ri values through the term η in Equation (3). Apparently, at low values of a the first effect dominates, as the power of the first term in Equation (8),

is small (and zero for a = 1), which obviously limits the upward decrease in drift density. Since ζ is proportional to 1 – α–1, higher values of a lead to larger vertical gradients in drift density. At high u∗, this effect is larger than the increase in Ri through V, leading to relatively low values of Ri. This feature causes the particle-buoyancy effect to be limited even for large a, which is an important conclusion.
Finally, Figure 6 shows the variation of Ri with u∗ and height for a =3. This figure should be compared with Figure 2 in which a = 1. Evidently, the effects of increasing a are enormous, with particle-buoyancy being very large because many more particles are transported upward (see Fig. 1). In this case, the inherent stratification would very strongly affect the mean profiles. One may notice the maximum values of Ri reached at intermediate values of u∗. As discussed above, this indicates that above a certain value of u∗ (depending on height), the increase in shear stress production with u∗ is larger than the increase in particle-buoyancy destruction. This is in contrast with the case a = 1, for which we saw earlier that Ri increased with u∗ for all u∗.
Particle Richardson number as a function of u∗ and height above zs, for a = 3 The light-grey area indicates Ri > 0.03, whereas dark-grey areas indicate Ri > 0.20. On the ordinate, z is in meters.

4. Discussion
It is interesting to compare our findings with those obtained for other two-phase flows, such as those of Reference Soulsby and WainwrightSoulsby and Wainwright (1987) concerning sediment suspended in water. They employ a similarly simple theoretical framework, but consider monodisperse mixtures only (i.e. all particles have the same size). This simplifies matters in the sense that V is independent of height, a situation which is fundamentally different to multidisperse two-phase flows such as snowdrift. In their case, Ri can either decrease or increase with height, whereas the inherent feature of a vertically decreasing mean fall velocity as found in snowdrift induces a distinct minimum in Ri at intermediate heights. The two main differences between snowdrift in air and suspended sediment in water are: the value of <r/A(∼0.83 in snowdrift and –0.57 in suspended sediment) and the amount of suspended mass generated at a given shear stress of the medium. The latter depends strongly on particle characteristics such as size and mass as well as on their threshold friction velocity. In suspended sediment, Ri values of > 0.03 occur over wide ranges of u∗ and particle radius. Hence, particle-buoyancy effects are clearly significant in suspended sediment. Reference Soulsby and WainwrightSoulsby and Wainwright (1987) additionally provide qualitative experimental confirmation of their findings, showing the expected deviation of the velocity and concentration profiles resulting from the particle-buoyancy effect. Reference Wamser and LykossovWamser and Lykossov (1995) demonstrate that theoretical snowdrift density profiles compare much more favourably with the observations when particle-buoyancy is taken into account, indicating that particle-buoyancy effects in snowdrift may indeed be non-negligible.
Under typical geophysical conditions, the particle-buoyancy effects in snowdrift are unmistakably smaller than in suspended sediment. This is the most likely reason why, at present, there are virtually no field data to directly test the theoretical effects put forward in this paper. Perhaps the best chance to “observe” particle-buoyancy effects is under laboratory conditions to exclude the possibility of disturbing thermal buoyancy effects. If the calculated particle-buoyancy effects in snowdrift as presented here are realistic, then vertical gradients of wind, temperature and humidity (and also drift density) in the atmospheric surface layer should increase significantly during strong snowdrifting events.
5. Concluding Remarks
Particle-buoyancy effects in snowdrift have been evaluated using a simple theoretical framework. The vertical gradient in the two-phase density induces a stable stratification which reduces turbulence. This is quantified by applying an appropriate Richardson number (Ri), which is defined as the ratio of particle-buoyancy destruction and shear production of turbulence. Three variables have been varied to investigate how Ri may change under realistic snowdrift conditions: the wind forcing (u*), the ratio of the eddy exchange coefficients of suspended particles and momentum (a) and the mean radius of the saltating particles (rm). The following list summarizes the main findings of this paper:
Ri increases with wind forcing at all levels (for a = 1). Close to the surface, stratification effects are important for all but the smallest wind forcings. In strong winds, stratification is non-negligible throughout the vertical column.
Ri decreases with height at lower levels, reaching a minimum value (zmin) at intermediate height, above which it increases again. This implies that particle-buoyancy effects are non-negligible throughout most of the suspension layer.
The existence of zmin can be attributed to the decrease in mean fall velocity with height.
The value of zmin decreases with wind forcing, since especially upper-level drift densities (and hence Ri values) increase with wind speed.
A smaller mean particle radius tends to strengthen the particle-buoyancy effect.
Higher values of a cause higher drift densities and therefore stronger stratification effects.
For a = 3, a value sometimes assumed to explain observed particle distributions (e.g. Reference MannMann, 1998), particle-buoyancy effects are very important throughout the column for all but the weakest wind forcing.
Evidently, the approach adopted here to quantify modification of turbulence is relatively simple. Reference BintanjaBintanja (2000a, Reference Bintanjab) used a more elaborate approach by explicitly calculating the turbulent kinetic-energy balance in the presence of suspended particles (which, as a matter of fact, yielded vertical profiles of Ri quite similar to those presented here). However, even his approach was too simple, as it neglected various interactions between the turbulent structure of the flow and the suspended particles. More detailed modelling studies are required to fully assess the complex interaction between suspended particles and turbulence.
Acknowledgement
Financial support was provided by the Netherlands Antarctic Research Programme (ALW) which is part of the Netherlands Organization of Scientific Research (NWO).



