


1. Introduction
Two break-up events of the Larsen Ice Shelf (A and B) during the last decade removed >5200km2 of its area. Reference Scambos, Hulbe, Fahnestock and BohlanderScambos and others (2000) propose that surface melting is a major cause of the break-up, and this is supported by Moderate Resolution Imaging Spectroradiometer (MODIS) images (Fig. 1a) showing melt ponds and water-filled crevasses on the ice-shelf surface before disintegration. According to Reference Scambos, Hulbe, Fahnestock and BohlanderScambos and others (2000), surface crevasses filled by meltwater can propagate to the ice-shelf base, causing the ice shelf to fragment. There are two conditions under which a crevasse can penetrate to the ice-shelf depth: (1) the initial crevasse depth exceeds a critical depth and (2) water fills this crevasse to no less than 90% of its depth. The critical depth depends on the surface density, with higher density requiring larger initial depth. Water pressure increases with crevasse depth, and below the critical depth becomes larger than glaciostatic pressure. Once glaciostatic pressure is exceeded by hydrostatic pressure, a crevasse propagation to the ice-shelf base is inevitable. Reference Scambos, Hulbe, Fahnestock and BohlanderScambos and others (2000) have found that the critical depth varies from 10 to 30 m for surface firn densities in the range 450–850 kgm-3.
Portion of Larsen B Landsat 7 image (18 km V 13 km), 21 February 2000 (from US National Snow and Ice Data Center): (a) actual, (b) transformed for surface area analysis.

The mechanism of ice-shelf disintegration proposed by Reference Scambos, Hulbe, Fahnestock and BohlanderScambos and others (2000) strongly depends on meltwater as a crevasse fill, and this raises two questions about constraints on meltwater availability. The first concerns the surface melting rate needed to fill existing crevasses of critical depth. The second concerns whether this melting rate is actually achieved before break-up events.
Simple geometrical calculations are done here to answer the first question. The total area of Larsen B ice shelf that disintegrated in 2002 was 3250 km2. Analysis of the 15 m resolution Landsat 7 image from 21 February 2000 (Fig. 1b) shows that narrow crevasses resolved by the 15 m imagery cover about 5% of the ice-shelf surface area. Due to the resolution of the imagery, this is an underestimation of the crevassed area. Assuming that the typical crevasse is 20m deep and filled with 18m of water (these length scales determine when a crevasse becomes critical to downward propagation) and that the typical crevasse width is 30 m, and assuming a 5% crevasse surface density, a surface melting of >0.4ma-1 w.e. averaged over the area that disintegrated is required to fill the surface crevasses in one melt season.
To determine whether melting of this magnitude actually occurred on the ice shelves prior to disintegration, we have used two approaches to analyze the ablation of Larsen Ice Shelf during the 1990–2002 period. The first is the positive degree-day (PDD) method based on the linear relationship between air temperature and ablation rate (Reference BraithwaiteBraithwaite, 1995; Reference HockHock, 2003). The second is the model described in section 3.
2. Positive Degree-Day Method
The PDD approach is attractive because it is simple (i.e. it is a linear relationship between the melting and positive air temperature) and requires limited data (only air temperature). The physical origin of such a dependence is explained by Reference OhmuraOhmura (2001). Its drawback is the fact that it is not uniform: it varies with summer mean temperature and surface albedo (Reference BraithwaiteBraithwaite, 1995). Here we use the formulation developed by Reference BraithwaiteBraithwaite (1995).
The total ablation A during N days with non-negative air temperature T a is
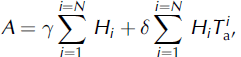
where γ and δ are parameters (γ is the melting with 0˚C air temperature, δ is the rate of increase of ablation with temperature) and Hi is defined as follows:
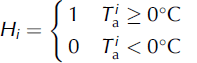
The first sum of Equation (1) is the number of days with nonnegative air temperature; the second sum is the positive degree-day sum PDD. A degree-day factor k is defined as
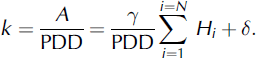
Normally, k is empirically determined from measurements of the surface ablation rate. On the Larsen Ice Shelf and in Antarctica as whole, however, observations needed to determine k are lacking. Reference HockHock (2003) presents data for k on snow and bare ice at glaciers in the Alps, Scandinavia and Greenland, all in the Northern Hemisphere. The average degree-day factors for ice within the 60–80° N latitude band and at altitudes below 1000m vary from 5 to 13.8 × 10⁻³ ma-1. Theoretically, lower-altitude sites have smaller k, because the number of days with non-negative temperature, as well as the temperature itself, should be higher. Therefore Reference HockHock’s (2003) k values are likely to be upper bounds for the Larsen Ice Shelf surface, since it is almost at sea level.
Using air-temperature data from an automatic weather station (AWS) (World Meteorological Organization station ‘Larsen Ice Site’; 66.95° S, 60.90°W; 17ma.s.l.) for 2002, we have calculated PDD (i.e. the second term on the righthand side of Equation (1)) to estimate the ablation immediately before the Larsen B break-up. During the period November 2001–February 2002, when the ice shelf disintegrated, the PDD was 20.4 degree-days. This gives a total surface ablation of 20±10 cm during the same 4 month period, which is two times less than the value needed to fill crevasses, as estimated in section 1. To examine this discrepancy and to determine if it is a result of a shortcoming of our application of the PDD method, we use the energy- and mass-balance model developed by Reference Sergienko and NagornovSergienko and Nagornov (2002), described below.
3. Energy- and Mass-Balance Model
The model (Reference Sergienko and NagornovSergienko and Nagornov, 2002) treats the thermodynamic, hydrodynamic and snow-compaction parts of the surface-melting phenomena, and is designed to understand the interactions between firn, water, the atmosphere, the solar flux and underlying ice. The thermodynamic part describes heat generation and transport through the full ice-shelf thickness, but focuses on melting/freezing in the near-surface environment where sunlight penetrates the firn. The hydrodynamic part describes meltwater percolation into the firn. The snow-compaction part describes the compaction of the firn layers by overburden pressure and due to refreezing.
Boundary conditions are specified at the top and bottom of the ice shelf to account for heat and mass exchanges with the atmosphere above and the sea water below. The lower boundary is in thermodynamic equilibrium with sea water. There is a net freezing of a few cm a–1 at the ice-shelf base. The net energy balance at the boundary with the atmosphere takes into account sensible- and latent-heat fluxes defined by means of a consideration of air turbulence. We use the same approach as developed by Reference Jordan, Andreas and MakshtasJordan and others (1999), Reference BintanjaBintanja (2000) and Reference King, Anderson and MannKing and others (2001). We assume that the solar radiation is absorbed not only at the surface but also in the subsurface firn and ice.
The intensity of absorbed radiation decreases with depth according to Beer’s law

where α is the surface albedo, I 0 the intensity of solar radiation at the surface, a is an extinction coefficient and x is depth. As soon as the firn temperature warms to 0˚C, melting starts. Usually melting occurs first at about 5 cm below surface, and then spreads both up and down.
The rate of meltwater production in the model depends on absorbed radiation, which is the only energy source for melting.

where S is the water volume fraction, L is the latent heat of fusion, ρ w is water density, I is the energy absorption range defined by Equation (4) and t is time.
Meltwater percolates downward under the influence of gravity, penetrating at a rate determined by Darcy’s law. The permeability depends on porosity, which is defined from the continuity equations for solid and liquid phases. As melt-water moves down to colder horizons, it refreezes, and thus warms the local environment by released latent heat.
There are three important positive feedbacks of the model that should be mentioned. First is albedo. Wet snow and meltwater have lower albedo than dry snow (Reference Grenfell and PerovichGrenfell and Perovich, 2004). This means that once meltwater is present, there is additional energy available for melting. The second feedback involves the extinction coefficient a seen in Equation (4). Water has a smaller extinction coefficient than either ice or snow. Indeed, the extinction coefficient of water can be as much as two orders of magnitude smaller than that of firn. Hence, more energy can be absorbed in the deeper layer. The third feedback is latent heat, which warms the environment of meltwater and brings the temperature of deeper layers closer to melting point.
3.1. Radiative effects of crevasses
The surface energy budget of a crevassed surface is significantly different from that of a plane surface. Depending on the crevasse-opening angle, solar zenith angle and surface reflectance properties, the amount of energy absorbed by a crevassed surface can be several times larger than that of a plane surface (Reference Pfeffer and BrethertonPfeffer and Bretherton, 1987). The multiple diffuse reflection of the solar radiation beam from a crevasse’s walls results in additional energy absorption. Crevasses can thus become efficient radiation collectors.
Reference Pfeffer and BrethertonPfeffer and Bretherton (1987) developed a model which provides a simple expression for the enhancement of absorption due to crevasses. This expression is a function of the crevasse-opening angle, solar zenith angle and ice reflection properties. Here, we account for the effect of enhanced radiation in a crevasse by using an effective albedo that is based on the Reference Pfeffer and BrethertonPfeffer and Bretherton (1987) study. This effective albedo varies with zenith angle, hence with latitude, time of day and season. The model is modified in the present study to account for the radiative effect of surface crevasses. For our calculations we use a groove-opening angle of 25˚ (Reference Pfeffer and BrethertonPfeffer and Bretherton, 1987).
3.2. Atmospheric conditions
The model is forced by temperature, pressure, relative humidity and wind speed obtained from the AWS at Larsen C (66.95˚ S, 60.90°W; 17 ma.s.l.). Where there were missing values in the data, we used mean values for the given time (day and month). This weather station is located at the southern part of the Larsen Ice Shelf, and its data reflect the conditions of Larsen C rather than Larsen A and B. Despite that, this station was used because its data span the period of both break-up events (1989–2003) and it has fewer missing values than another available AWS (64.150˚ S, 60.950°W; Reference Stroeve and ShumanStroeve and Shuman, 2003).
4. Results
All calculations were done for the period 1 January 1989 to 31 March 2003. Total ablation (mw.e.) and number of days refer to the austral summer. Figure 2 shows the annual number of melting and positive degree-days. Number of melting days is from the energy- and mass-balance model, and positive degree-days are the first term of Equation (1). The number of melting days for both plane and crevasse geometry have local maxima in break-up years (1995 and 2002), and the number of positive degree-days has its local maximum in 1994 and in 2002. The average number of melting days is 103 (145) for plane (crevasse) geometry and 66 for positive degree-days. The average number of melting days for 1993–98 from our model is 115, and is larger overall than the number estimated from the Advanced Very High Resolution Radiometer (AVHRR) image record Reference Scambos, Hulbe, Fahnestock and Bohlander(Scambos and others, 2000), 77 ± 25. This discrepancy can be attributed to the fact that the melting process in the model starts at the subsurface layer and it takes time to develop melt ponds seen in AVHRR images. The large number of melting days associated with crevasse geometry is explained by enhancement of energy absorption by the crevasses. The melting seasons 1991–95 for the model run using crevasse geometry start as early as October and last till March.
Number of melting and positive degree-days.
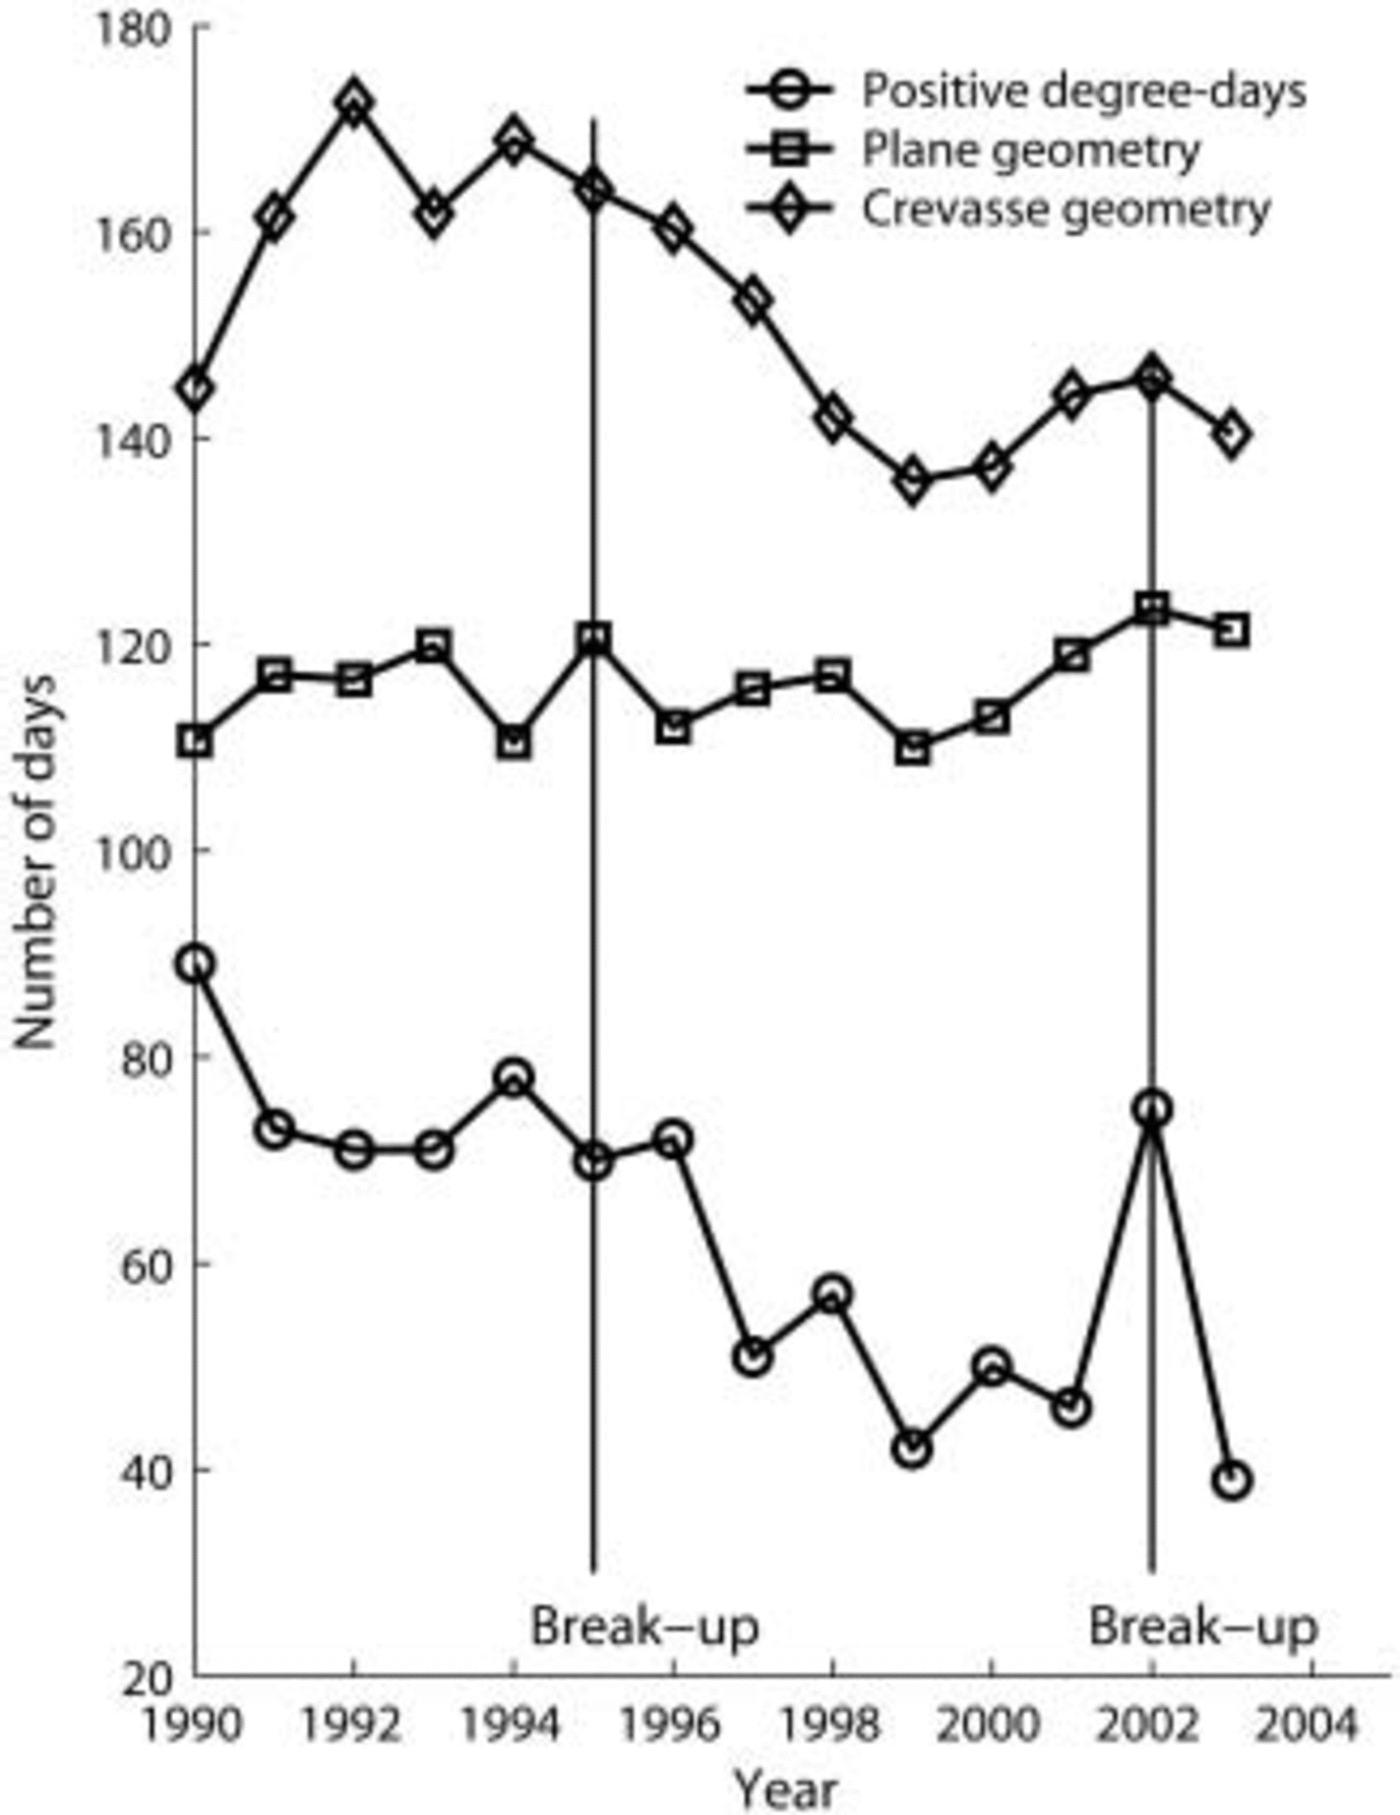
A possible explanation for such a large difference between the number of melting days for plane geometry and positive degree-days is that, at the AWS location, there is non-zero solar radiation flux during summer night-time. This effect prevents strong cooling of subsurface layers at night-time, and melting starts sooner during daytime. Figure 3 shows the annual ablation (mw.e.) for both plane and crevasse geometries. The average ablation is 0.36 and 1.24 mw.e. for plane and crevasse geometries, respectively.
Annual ablation (mw.e.) integrated through the melt season for plane and crevasse geometry. Left vertical axes refers to plane geometry and PDD; right vertical axes refers to crevasse geometry.
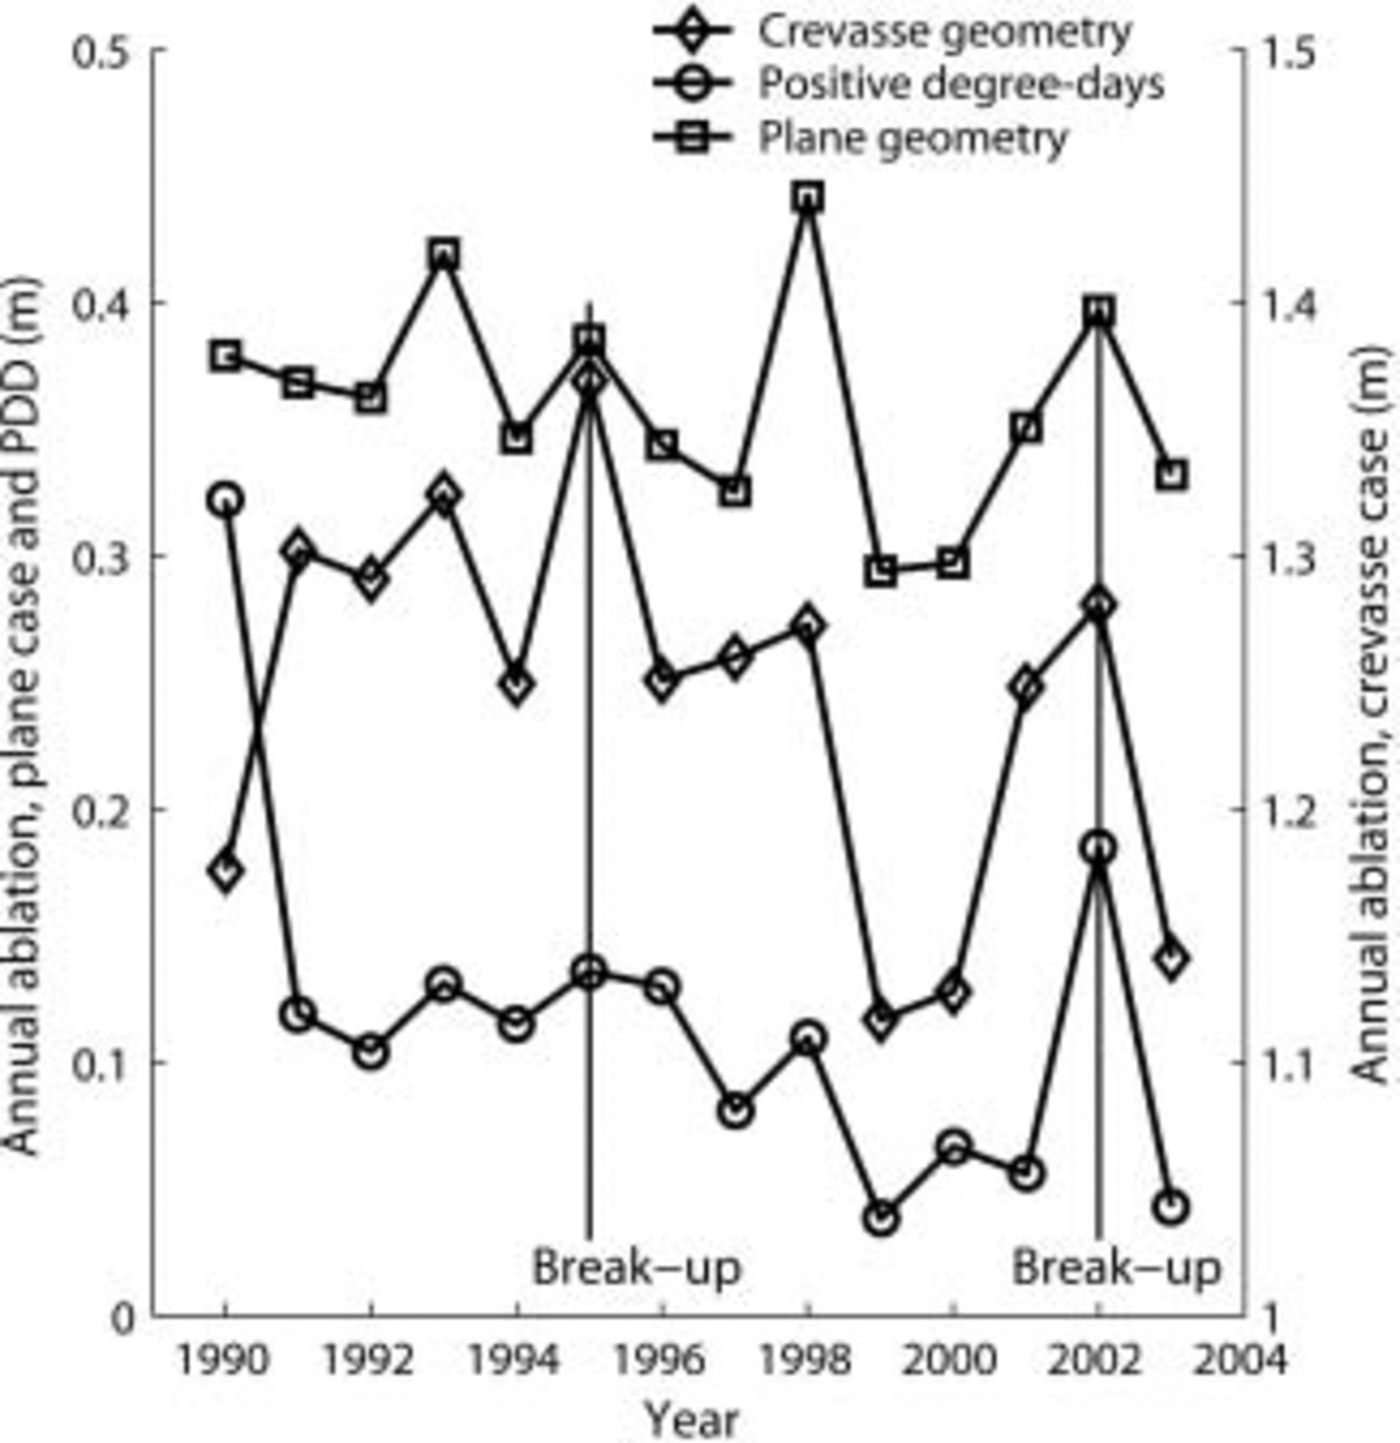
Curves for both plane and crevasse geometries have local maxima in break-up years. The calculated ablation during 2002 is 18.4 cm from the PDD model and 42 cm from the energy-balance model (EBM). The latter is similar to the estimated lower threshold calculated for year 2000. The fact that we used AWS data from the Larsen C site, located ∼100km south of Larsen B, may yield higher ablation in both the PDD and EBM results. The total ablation during 15 melt seasons is 5 mw.e. in the case of plane geometry and 17.4 mw.e. in the case of crevassed geometry.
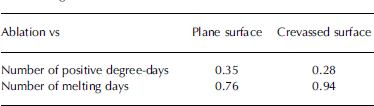
The maximum depth of meltwater penetration derived from the EBM is largest in the years of break-up. Linear regression was performed to determine the dependence of the annual ablation on the number of melting days and positive degree-days for both plane and crevasse geometries. The correlation coefficients are listed in Table 1.
Correlation coefficients for annual ablation vs number of positive degree-days and number of melting days for plane and crevassed geometries
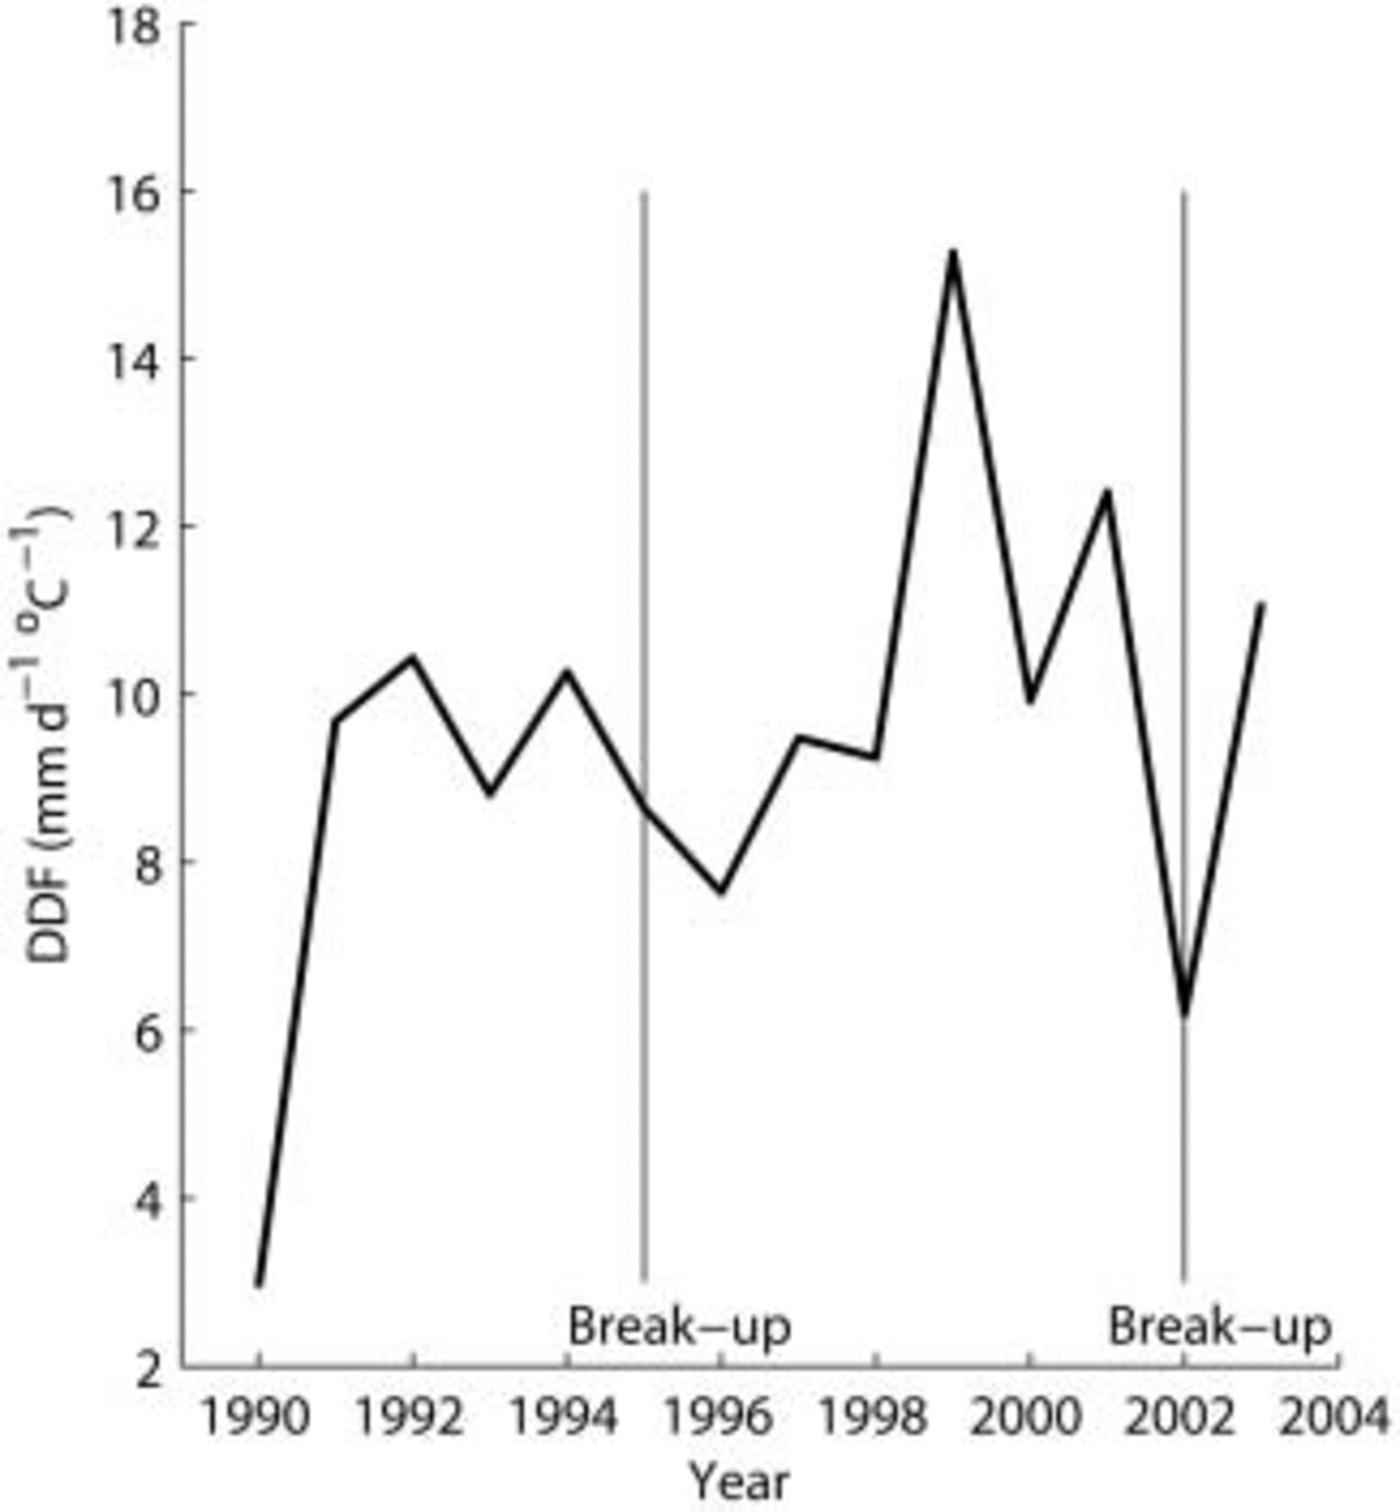
The degree-day factor k, defined by Equation (3), was calculated for the period 1989–2003 for the plane surface (Fig. 4). The maximum k is observed in 1999, when the number of positive degree-days is minimal. The average k for the plane surface is 10 mm, and is slightly higher than that observed for glaciers of similar latitudes in the Northern Hemisphere but at higher altitude. The degree-day factor k measured during the Greenland Ice Margin Experiment was 8.7 mmd-1 ˚C-1 at 67°06′ N at 341 ma.s.l., and 9.2 mmd-1 °C-1 at the same latitude at 519ma.s.l. (Reference HockHock, 2003). The first degree-day factor was obtained for the period 10 June–31 July 1991, and the second one for 15 June–6 August 1991.
Annual degree-day factor. Results from the energy- and mass-balance model. Plane geometry calculations.
5. Discussion and Conclusions
The total ablation calculated by the PDD method is smaller than that required to fill surface crevasses leading to Larsen A and B break-up. The difference between required ablation and that from the PDD method is a factor of 2–4.
The ablation rate calculated from our model is the same as the estimated threshold. The results described here suggest that the PDD model tends to underestimate the ablation rate, because it cannot account for subsurface melting with negative air temperature. Our model appears to produce results more consistent with the melting conditions needed to explain the break-up events. The model results for crevasse geometry show that crevasses are more favorable to melting and they are not only collectors, but also efficient sources, of meltwater. Future improvement of the model will address melting along crevasse walls, and increasing dimensionality of the model.
Acknowledgements
We wish to thank A. Nolin and T. Scambos for valuable comments and suggestions.



