Introduction
Knysna Estuary is the largest clear-water estuary along the coast of South Africa (Allanson et al., Reference Allanson, Maree and Grange2000a), and is ranked the most important estuary in the country based on size and the high level of biodiversity it supports (Turpie & Clark, Reference Turpie and Clark2007). The estuary is incorporated into the Garden Route National Park and as such is managed and protected by South African National Parks. Knysna Estuary is also a popular tourist destination and fishing spot (Hodgson et al., Reference Hodgson, Allanson and Cretchley2000). Consequently, behaviour of fishermen and bait collectors and their impacts on fish and bait stocks have been investigated multiple times (Hodgson et al., Reference Hodgson, Allanson and Cretchley2000; Napier et al., Reference Napier, Turpie and Clark2009; Simon et al., Reference Simon, du Toit, Smith, Claassens, Smith and Smith2019). These studies show a gradual change in the use of polychaetes as bait in the region. Hodgson et al. (Reference Hodgson, Allanson and Cretchley2000) found that only few recreational fishermen harvested polychaetes, and that the only species used was the bloodworm Arenicola loveni Kinberg, 1866. A decade later, Napier et al. (Reference Napier, Turpie and Clark2009) found that while A. loveni was still harvested, more fishermen, including subsistence fishermen, were also collecting other polychaete species, with moonshine worms (identified as Diopatra sp.) being the third most frequently collected species. After another decade, Simon et al. (Reference Simon, du Toit, Smith, Claassens, Smith and Smith2019) found that moonshine worm was the most preferred (albeit not the most collected) bait polychaete among subsistence and recreational fishermen in Knysna Estuary.
Despite being harvested in Knysna Estuary for more than a decade, moonshine worms from this and Swartkops (240 km to the east) estuaries were only recently identified as Diopatra aciculata Knox & Cameron, Reference Knox and Cameron1971 after intensive molecular and morphological analyses (van Rensburg, Reference van Rensburg2019; Elgetany et al., Reference Elgetany, van Rensburg, Hektoen, Matthee, Budaeva, Simon and Struck2020). These studies showed that despite high morphological similarities and low interspecific genetic distances, D. aciculata should be considered separate from Diopatra neapolitana Delle Chiaje, 1841, a species originally described from the Mediterranean, but also recorded in South Africa (Macnae, Reference MacNae1957; Day, Reference Day1967; Branch et al., Reference Branch, Griffiths, Branch, Beckley and Bowles2016). This distinction is extremely important, since D. neapolitana had previously been reported in Swartkops Estuary where it was used as bait (van Der Westhuizen & Marais, Reference van Der Westhuizen and Marais1977) and in the nearby Sundays River Estuary (McLachlan et al., Reference McLachlan, Cockcroft and Malan1984), another popular fishing site (Cowley et al., Reference Cowley, Childs and Bennett2013). Additionally, Branch et al. (Reference Branch, Griffiths, Branch, Beckley and Bowles2016) reports D. neapolitana from Namibia to southern Mozambique. It is probable that some, if not all these records are incorrect identifications. Thus, it is important that an updated description of D. aciculata from Knysna and Swartkops estuaries, the only sites where identification has been confirmed, is generated to mitigate future identification errors.
The increased harvesting of D. aciculata in Knysna Estuary probably reflects, in part, an increase in density over the last few decades. Diopatra aciculata is harvested at many popular bait collecting sites within the estuary (Simon et al., Reference Simon, du Toit, Smith, Claassens, Smith and Smith2019), suggesting that the species is now widespread in the region. Since Diopatra species, which build conspicuous tubes (Figure 1A), are known ecosystem engineers (Berke et al., Reference Berke, Mahon, Lima, Halanych, Wethey and Woodin2010; Arias et al., Reference Arias, Paxton and Budaeva2016), high density and wide distribution of D. aciculata may exert important ecological impacts in the estuary, especially because the species is so large (up to 60 cm, van Rensburg, Reference van Rensburg2019). It is therefore important that density and distribution of D. aciculata be determined to facilitate improved management of the species in Knysna Estuary.
Two types of Diopatra aciculata tubes. (A) In more sandy areas tubes protrude from substrate and are often bent in the direction of water flow with shell and plant fragments attached. (B) In areas with more muddy/silty substrates, often amongst seagrasses, tubes are flush with substrate but can be differentiated from other infauna by the presence of the off-white inner lining of the tube.

The aims of this study are therefore to provide (1) a detailed morphological description of Diopatra aciculata from South Africa and (2) an assessment of its distribution and density in Knysna Estuary as a first step towards understanding the ecological impact that this species may have in this important estuary.
Materials and methods
Study area
Most of Knysna Estuary is entirely marine dominated and is therefore more accurately described as a marine or estuarine embayment (Allanson et al., Reference Allanson, Maree and Grange2000a). Tidal and saline influence extends from the mouth (known as ‘The Heads’) for 19 km along the main winding channel (Allanson et al., Reference Allanson, Maree and Grange2000a; Largier et al., Reference Largier, Attwood and Harcourt-Baldwin2000). The estuary has two inhabited islands, Leisure Island and Thesen Island, and is bordered to the east by the Knysna central business district (Figure 2).
Map of Knysna Estuary showing the sampling sites of Diopatra aciculata. Intertidal sites are given as letters A–M and subtidal sites are denoted 1–5. The invertebrate reserve is shown as the shaded area. WB = White Bridge, TI = Thesen Island, LI = Leisure Island, IR = Invertebrate reserve, RB = Red Bridge, IT = Intertidal, ST = Subtidal.

Morphology
Samples were collected over 4 hours around low tide in February and March 2017. Specimens for morphological analysis were collected from Bollard Bay (34°04′13.5″S 23°03′24.7″E; Site B, Figure 2) in Knysna Estuary and Swartkops Estuary (33°52′00.7″S 25°36′42.5″E) in Port Elizabeth and deposited at the Iziko Museum of South Africa (MB-A090394–MB-A090408). Worms were collected by inserting a thin wire with a hooked tip into the tube, turning it a few times to hook the worm and extracting by slowly pulling out the wire (Napier et al., Reference Napier, Turpie and Clark2009; van Rensburg, Reference van Rensburg2019; Supplementary video S1). After collection, specimens were relaxed with 7% magnesium chloride solution in tap water and photographed live (using a Samsung Galaxy S6 smartphone). Specimens were then fixed in 4% formalin in seawater and stored in 70% ethanol.
Specimens were identified according to published identification keys (Day, Reference Day1967; Paxton, Reference Paxton1993; Arias et al., Reference Arias, Paxton and Budaeva2016). Preserved specimens and sections of chaetigers were examined on dissecting (Leica MZ 7.5) and light (Leica DM1000) microscopes, respectively, and images captured using a Leica EC3 microscope camera and processed with the Leica Application Suite EZ (LAS EZ) software.
For scanning electron microscopy, specimens were dehydrated according to a protocol developed by L.-M. Joubert (Central Analytic Facility, Stellenbosch University); two washes in 100% ethanol of 10 min each, one wash in a 1:1 mixture of 100% ethanol and hexamethyldisilazane (HMDS) for 15 min, and finally two washes in HMDS for 30 min each. The HMDS was discarded and the specimens left overnight for residual HMDS to evaporate. Specimens were sputter-coated with gold palladium and viewed on a Zeiss Merlin scanning electron microscope at the Stellenbosch University Central Analytical Facility.
Distribution, density and population estimate
We sampled 18 sites (Figure 2) from the mouth of the estuary to about 14 km upstream, covering most of the estuary. The sampled sites included those surveyed by Day et al. (Reference Day, Millard and Harrison1951) and Allanson et al. (Reference Allanson, Nettleton and de Villiers2000b) and popular bait collecting sites (Hodgson et al., Reference Hodgson, Allanson and Cretchley2000; Napier et al., Reference Napier, Turpie and Clark2009; Simon et al., Reference Simon, du Toit, Smith, Claassens, Smith and Smith2019). Thirteen sites were in the low intertidal zone (i.e. at the spring low-water mark ± 0.5 m) and five were in the subtidal zone (i.e. below the intertidal zone).
For density measurements, a 1 m2 steel quadrat was used to sample a minimum of 20 m2 per site. In each quadrat the number of visible Diopatra aciculata in tubes were recorded. Worms were detected by luring them to their tube openings using bait bags (frozen sardines (Clupeidae) in nylon stockings) that were squeezed near the tube entrances. Subtidal sampling was conducted by two free-divers following the same protocol.
To calculate a population estimate for the estuary we used the following equations (Wheater et al., Reference Wheater, Bell and Cook2011):
 $$\eqalign{&{\rm Population}\,{\rm estimate\;}\lpar {\hat{P}} \rpar = \displaystyle{{\bar{x}\;\times \;n} \over {{\rm SF}}} \cr &= \displaystyle{{{\rm mean}\,{\rm number}\,{\rm of}\,{\rm worms\;}\,{\rm per}\,{\rm sample} \times {\rm number}\,{\rm of}\,{\rm samples}} \over {{\rm Sampling}\,{\rm Factor}}}$$
 $${\rm Sampling}\,{\rm Factor}\;\lpar {{\rm SF}} \rpar = \displaystyle{{{\rm Area}\,{\rm sampled}} \over {{\rm Total}\,{\rm area}}}$$
 $$95\percnt \,{\rm Confidence}\,{\rm Interval} = \displaystyle{{2 \times {\rm Standard}\,{\rm Error}\;\times n} \over {{\rm SF}}}$$
The mean number of worms per sample (for equation (1)) was calculated using data from all sites where D. aciculata was present. Similarly, area sampled (equation (2)) included only sites where D. aciculata occurred. The total area (equation (2)) was calculated using a conservative estimate of the area likely occupied by moonshine worms based on the area of the estuary covered by water during neap low tide (Largier et al., Reference Largier, Attwood and Harcourt-Baldwin2000) and the depths at which this species is known to occur (cf. Knox & Cameron, Reference Knox and Cameron1971; Paxton, Reference Paxton1993).
Statistical analysis
All statistical analyses were performed in R-STUDIO and run in the R v.1.0.153 environment. In all instances, data were tested for normality using Shapiro–Wilks tests. Differences in density between sampling sites were calculated using Kruskal–Wallis rank sum test followed by Dunn's post hoc test for multiple comparisons using rank sums with Bonferroni correction.
Results
Taxonomy
SYSTEMATICS
Order EUNICIDA
Family ONUPHIDAE Kinberg, 1865
Subfamily ONUPHINAE Kinberg, 1865
Genus Diopatra Audouin & Milne Edwards, 1833
Diopatra aciculata Knox & Cameron, Reference Knox and Cameron1971
(Figures 1, 3–7)
D. aciculata: Knox & Cameron, Reference Knox and Cameron1971; Day & Hutchings, 1979; Paxton, 1986; Paxton, Reference Paxton1993; Elgetany et al., Reference Elgetany, van Rensburg, Hektoen, Matthee, Budaeva, Simon and Struck2020
Anterior regions of Diopatra aciculata, (A) a darker and (B) a lighter live specimen, and (C) a preserved specimen. Mid-dorsal bars (MDB) very difficult to see in live individuals, especially darker specimens. AS = Antennae styles; BS = Brown spot in center of nuchal organ; CR = Ceratophore rings; LA = Lateral antennae; MA = Median antenna; MDB = Mid-dorsal bar; PA = Palps; PC = Peristomal cirri; FL = Frontal lips; WS = White spots. Scale bars denote 10 mm.

Scanning electron micrographs of Diopatra aciculata showing (A) Nuchal grooves and peristomal cirri; (B) Irregular rows of sensory buds on antenna styles; (C) Mid antenna area with fewer serous gland pores in sensory buds; (D) Closer view of serous gland pores in sensory buds. AS = Antennae styles; CR = Ceratophore rings; N = Nuchal groove; SBR = Sensory bud rows; SGP = Serous gland pores; PC = Peristomal cirri. Scale bars denote: (A) 500 μm; (B) 500 μm; (C) 100 μm and (D) 100 μm.

Scanning electron micrograph of Diopatra aciculata showing (A) Modified parapodium; and (B–D) chaetae. (A) Ventral cirri elongated and subulate; (B) pectinate cheatae with 5–10 teeth; (C) Close up of pectinate cheatae; (D) Serrated surface of mid regions of limbate cheata. DC = dorsal cirrus; PC = pectinate chaetae; POL = post-chaetal lobe; PRL = pre-chaetal lobe; VC = ventral cirrus. Scale bars denote: (A) 400 μm; (B) 50 μm; (C) 10 μm and (D) 5 μm.

Progression of parapodia of Diopatra aciculata showing (A) Latero-ventral view of branchial region with very long dorsal cirri, pad-like ventral cirri and presence of a ventral lobe on parapodia and lack of subacicular hooks. (B) Ventral view towards end of branchial region, longer dorsal cirri visible in background, appearance of subacicular hooks. (C) Lateral view past branchial region, dorsal cirri become reduced, ventral lobes and pre-chaetal lobes disappear, subacicular hooks remain. BR = branchia; DC = Dorsal cirrus; POL = post-chaetal lobe; PRL = Pre-chaetal lobe; SA = subacicular hook; VC = Ventral cirrus; VL = ventral lobe. Scale bars denote 10 mm.

Progression of branchiae from dorsal view of Diopatra aciculata showing (A) Main branchial region where branchiae have several whorls, large and bushy in appearance, dorsal cirri here characteristically long, mid-dorsal bar clearly present in preserved specimens. (B) Shows branchiae reducing, branchiae eventually disappear, absence of mid-dorsal bar. BR = Branchia; DC = Dorsal cirrus; MDB = Mid-dorsal bar. Scale bars denote 10 mm.

? D. neapolitana: Macnae, Reference MacNae1956; Macnae, Reference MacNae1957; Day, 1960; Day, Reference Day1967; van der Westhuizen & Marais, Reference van Der Westhuizen and Marais1977; McLachlan et al., Reference McLachlan, Cockcroft and Malan1984; Branch et al., Reference Branch, Griffiths, Branch, Beckley and Bowles2016
Diopatra sp.: Napier et al., Reference Napier, Turpie and Clark2009; Allanson et al., Reference Allanson, Human and Claassens2016; Simon et al., Reference Simon, du Toit, Smith, Claassens, Smith and Smith2019
Material examined
16 specimens (MB-A090376–MB-A090391), incomplete, Knysna Estuary (34°04′17.6″S 23°03′30.5″E), Knysna, Western Cape, South Africa, coll. H. van Rensburg, 20 February 2017; 15 specimens (MB-A090394–MB-A090408), incomplete, Swartkops Estuary (33°52′00.7″S 25°36′42.5″E), Port Elizabeth, Western Cape, South Africa, coll. H. van Rensburg, 30 March 2017.
Diagnosis
Large body size, up to 600 mm long and 11.5 mm wide with 10–18 rings on ceratophores; 5–10 teeth on pectinate chaetae; uni- and bi-dentate pseudo-compound falciger and dorsal cirri approximately as long as branchiae which distinguishes it from D. neapolitana.
Description
All specimens comprised large adults, maximum live incomplete length at least 60 cm. Preserved width excluding parapodia up to 11.4 mm at chaetiger 10, length of anterior fragment up to 158 mm for 131 chaetigers. Preserved body colour pale to dark brown, anterior regions sometimes darker. Single short black mid-dorsal bar on anterior margin of each chaetiger in branchial region (Figures 3A, B, 7A). Inner surface of ceratophore rings dark brown (Figure 3B, C). Median and posterior segments pale brown to cream. In live specimens, anterior often iridescent dark blue-green (Figure 3A) or darker brown (Figure 3B), mid-dorsal bar difficult to see on specimens with darker anterior regions. Inside of peristomal cirri brown (Figure 3A, B). Live specimens with small white spots irregularly spaced on antennae styles (Figure 3B).
Prostomium extended anteriorly, two smooth subulate frontal lips. Upper ventral lips have distal lobes (Figure 3C). Nuchal grooves almost completely circular, horseshoe-shaped (Figure 4A), some live specimens with small brown dot in centre of nuchal organ (Figure 3B). Three occipital antennae and two ventro-lateral palps mounted on 10–18 ceratophore rings, rings equally sized proximally, distal one longer (Figure 3C). Antennae styles smooth, long, slender, tapering to blunt end, reaching to chaetiger 9–15 (median) or 13–17 (lateral). Rows of interrupted sensory buds on antennae (Figure 4B, C), buds flattened, circular and irregularly spaced (Figure 4C, D), serous gland pores gradually disappearing distally.
Peristomium as long as succeeding chaetiger, two widely spaced peristomal cirri 1.5–2 times length of peristomium mounted on anterior margin, laterally to posterior occipital antennae (Figures 3A, B, 4A).
Three or four anterior abranchiate chaetigers; parapodia larger than on branchiate chaetigers, directed antero-ventrally; dorsal cirri elongated, slender, tapering, longer than ventral cirri (Figure 5A). Pre-chaetal lobes rounded, post-chaetal lobes long and subulate (Figure 5A). Pseudo-compound falciger distally uni- or bi-dentate, covered by pointed hood.
Unmodified parapodia usually from the fifth chaetiger. Dorsal cirri slender, elongated, longest in branchial region, similar in length to branchiae. Ventral cirri pad-like (Figure 6A). Post-chaetal lobes elongated, triangular (Figure 6B, C). Pre- and post-chaetal lobes gradually become smaller toward posterior. Pre-chaetal lobes disappear but post-chaetal lobes remain distinct. Limbate and pectinate chaetae present, pectinate chaetae having 5–10 teeth (Figure 5B, C), one lateral tooth often thicker than rest. Two bi-dentate subacicular hooks from chaetiger 19–23 onwards (Figure 6B, C).
Spiralled branchiae from fourth or fifth chaetiger, up to 20 branchial whorls arranged close together, brush-like or bushy appearance tapering towards tips (Figure 7A). After 20–40 segments, branchiae gradually shorten and whorls reduce until a single filament remains, terminate shortly thereafter (Figure 7B).
Taxonomic remarks
The specimens from South Africa match descriptions of Diopatra aciculata (Paxton, Reference Paxton1993) and Diopatra neapolitana (Arias et al., Reference Arias, Paxton and Budaeva2016) with regards to number of chaetigers with subulate ventral cirri (four), branchiae starting on chaetiger 4 or 5, circular sensory buds, horseshoe-shaped to almost complete circular nuchal grooves, number of rings on ceratophores (10–18), maximum number of branchial whorls (20), number of teeth on pectinate chaetae (5–10) and presence of uni- and bi-dentate pseudo-compound falciger.
Compared with the original description of D. aciculata (Knox & Cameron, Reference Knox and Cameron1971), specimens examined here were wider (11 mm vs 5 mm), had longer antennae (reaching chaetiger 18 vs 12) with more ceratophores (18 vs 15) and no knob-like structures on pseudo-compound falcigers. However, barring the absence of the knob on the pseudo-compound falcigers, these differences can probably be attributed to the smaller size of the single specimen examined by Knox & Cameron (Reference Knox and Cameron1971). Our specimens conformed best with descriptions of D. aciculata by Paxton (Reference Paxton1993, Reference Paxton2016). Similar features included width at tenth chaetiger (11.5 mm) and lengths of palps, median and lateral antennae reaching chaetigers 2–5, 8–15 and 8–15 respectively. However, the adult specimens from South Africa differed from D. aciculata in Australia in that they never possessed tridentate falcigers (Paxton, Reference Paxton1993, p. 146, Figure 34), and although no complete specimens were collected in our study, these fragments were often twice as long as the 340 mm length reported by Paxton (Reference Paxton1993, Reference Paxton2016). Peristomal cirri of specimens from South Africa were 1.5–2 times longer than the peristomium, in accordance with Paxton (Reference Paxton2016).
The South African specimens of D. aciculata differ from D. neapolitana in the following characteristics: they were wider at 10th chaetiger (7–11.5 mm vs 4–9 mm) and had longer palps (reaching chaetiger 2–5 vs 1–3), longer antennae (reaching chaetiger 8–15 vs 4–10) and longer dorsal cirri (reaching same length as branchiae in D. aciculata but less than half the length of branchiae in D. neapolitana) (Arias et al., Reference Arias, Paxton and Budaeva2016). Furthermore, the branchial region was slightly shorter in D. aciculata than in D. neapolitana (up to chaetiger 61 vs 70). The observed length of live specimens collected here agreed best with the re-description of D. neapolitana (Arias et al., Reference Arias, Paxton and Budaeva2016).
Distribution
Diopatra aciculata is known to occur on the southern coast of Australia from Perth in the west to Newcastle in the east (Paxton, Reference Paxton1993) and has also been reported from the Suez Canal in Egypt (Elgetany et al., Reference Elgetany, van Rensburg, Hektoen, Matthee, Budaeva, Simon and Struck2020). Confirmed South African range includes Knysna and Swartkops estuaries. Presence in estuaries where D. neapolitana was reported (Day, Reference Day1967; McLachlan et al., Reference McLachlan, Cockcroft and Malan1984; Branch et al., Reference Branch, Griffiths, Branch, Beckley and Bowles2016) needs to be confirmed.
Ecology
Tubes lined with white parchment-like material. In sandy environments, tubes have protruding tube-caps that are often bent horizontally (Figure 1A). Tube-caps are made of sand with a smooth texture and plant material and shell fragments usually embedded into the tube with larger shell pieces often found distally (Branch et al., Reference Branch, Griffiths, Branch, Beckley and Bowles2016, p. 67, figure 26.4; this study, Figure 1A). Some tube-caps had no plant or shell attachments and appeared smooth. In muddy or silty environments, openings of tubes are flush with sediment surface and the off-white parchment-like lining is clearly visible (Figure 1B).
Distribution, densities and population estimate
A total of 860 m2 were sampled at the 18 sites, with a mean of 47.8 m2 covered per site. In total, 458 m2 were sampled in the intertidal zone and 402 m2 in the subtidal zone. No worms or holes were found in the three sites north of the White Bridge (Sites K, L & M, Figure 2), and these sites (60 m2) were therefore excluded from further analyses. Of the 800 quadrats sampled from the remaining 15 sites, no worms were observed in 443 quadrats.
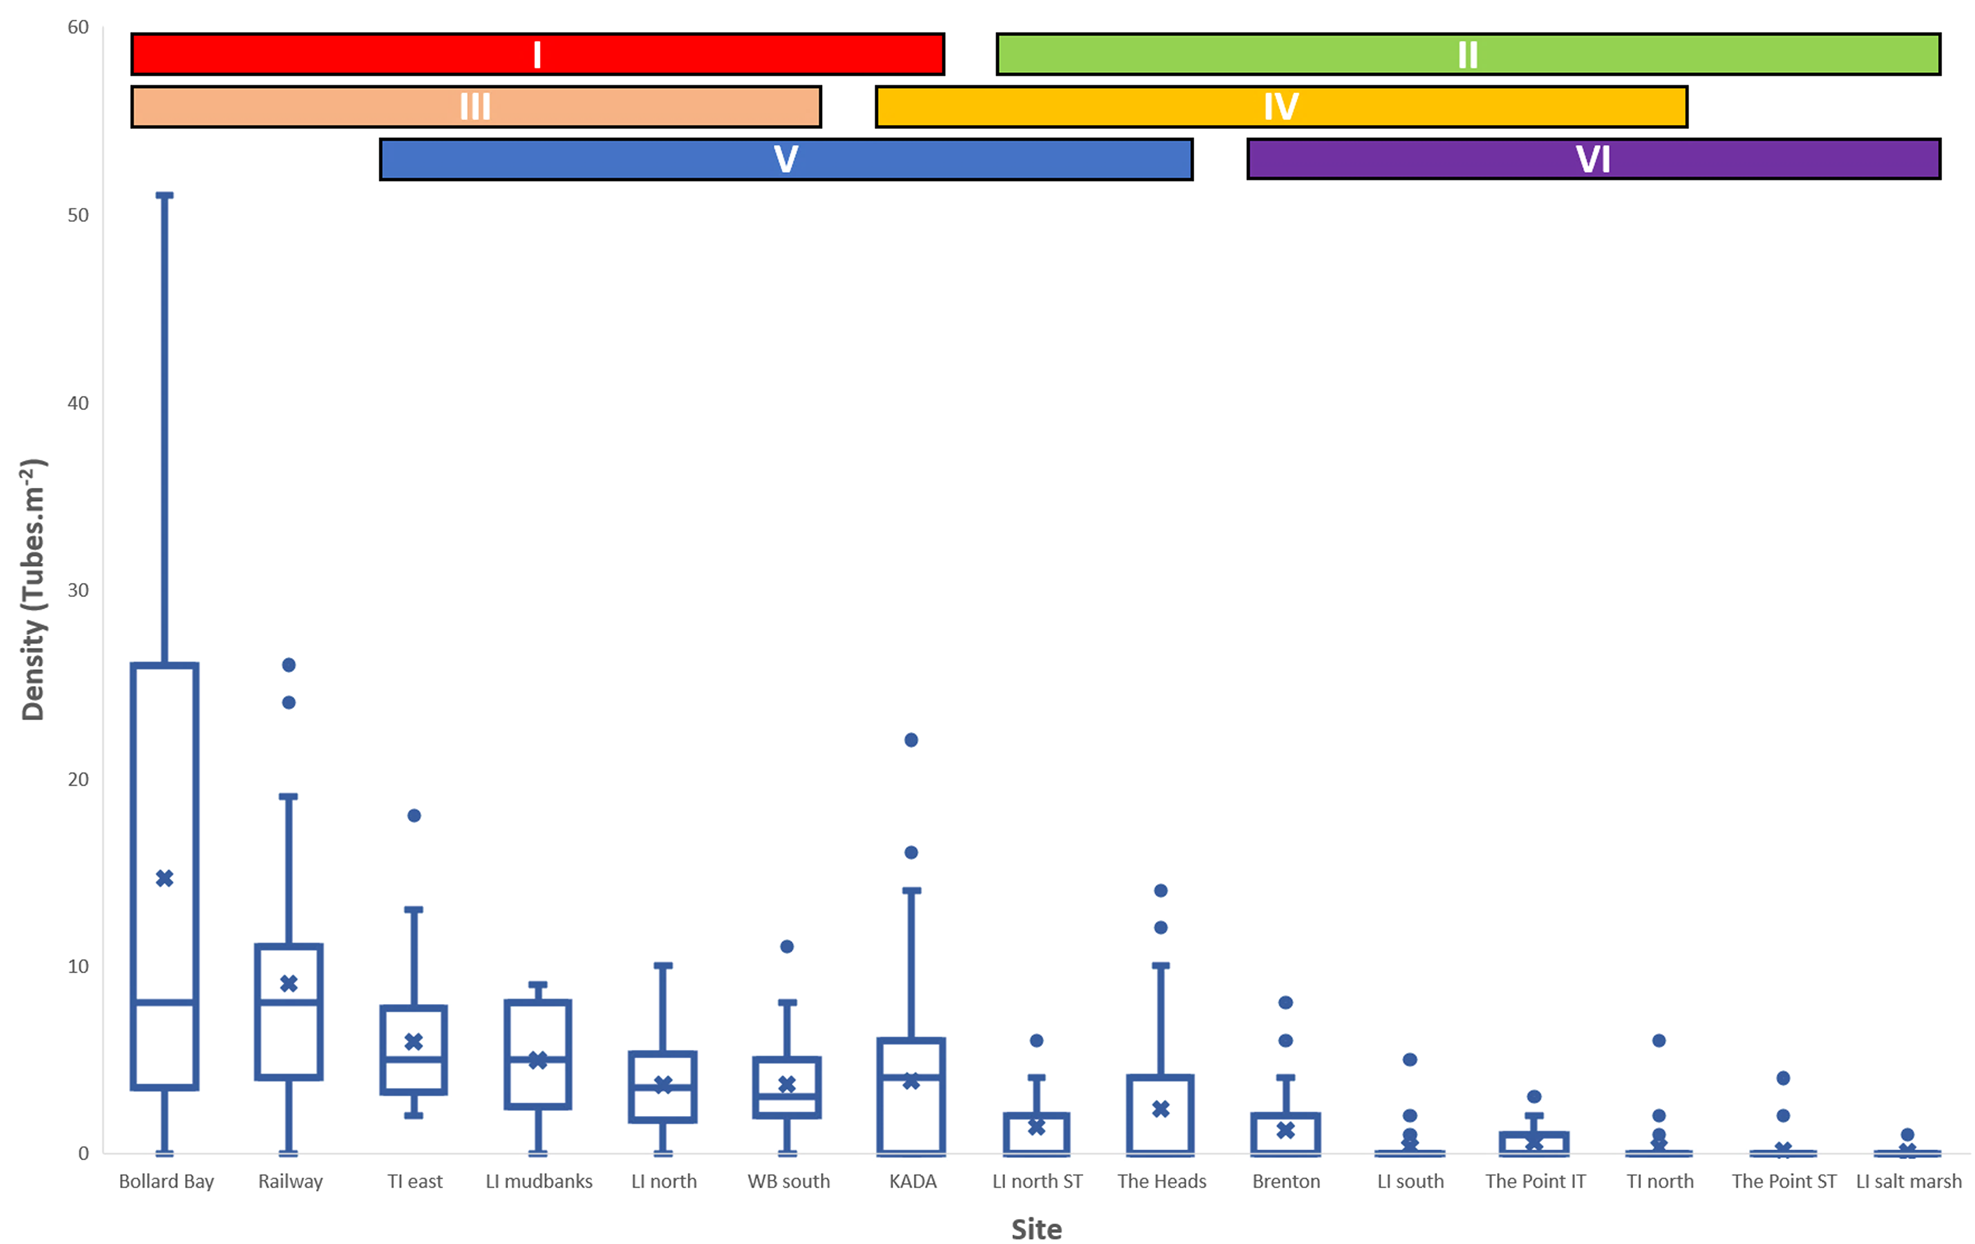
Densities varied significantly by site (Kruskal–Wallis H(14, 800) = 376.55; P = 0.01, Figure 8). Post-hoc analysis revealed six overlapping homogeneous groups (I–VI, Figure 8). However, all the data could be divided into two exclusive groups, one with high and one with low densities (I and II, respectively, Figure 8). The high-density group (I) contained seven sites with median densities of 3–8 worms m−2: Bollard Bay, Railway Bridge, Thesen Island east, Leisure Island mudbanks, Leisure Island north, White Bridge and Knysna Angling and Diving Association (KADA). Median and maximum densities were highest at Bollard Bay and Railway Bridge (median = 8 worms m−2 at each, maximum densities = 52 worms m−2 and 26 worms m−2 at the two sites, respectively). All but one site (KADA) from the high-density group (I) were from the intertidal zone. The low-density group (II) contained the remaining eight sites; all with median densities of 0 worms m−2 and a maximum density of 14 worms m−2 at The Heads. Despite overlap in homogeneous groups, two sites in groups I and III (Bollard Bay & Railway, Figure 2) never overlapped with sites in groups II and VI (The Heads, Leisure Island North ST, The Point ST & IT, Brenton, Leisure Island Sandbank, Leisure Island Salt Marsh, Thesen Island North, Figure 2). Sites with high densities were patchily distributed throughout the estuary (Figure 9).
Boxplots showing densities of Diopatra aciculata in Knysna Estuary at all sampled sites where worms were found. Results of post hoc Dunn's test showing homogeneous groups (I – VI) are shown visually as bars above boxplots. Crosses (X) denote means while centre bars show medians (indistinguishable in groups II & VI). Box and whiskers shows quartiles with minimum and maximum values. Dots represent outliers.

Visual representation of D. aciculata density and distribution throughout the Knysna Estuary. Large red circles show high density group with >0 medians. Smaller green circles show low density group with medians = 0. S = Subtidal sites; I = Intertidal sites.

The mean density per sample was 3.47 worms m−2 for 800 samples, covering a total area of 800 m2. A conservative estimate of the total area that could be occupied by D. aciculata was determined as the area submerged during neap low tide south of the White Bridge. This amounted to 6,487,600 m2 of the 18,270,000 m2 area of the Knysna Estuary. The sampling factor (SF) was therefore 1.233 × 10⁻⁴, and the population size estimate was 22,514,193 worms with a 95% confidence interval of 2,338,229 worms. Thus, the estimated population size of D. aciculata in the Knysna Estuary is between 20 and 24 million worms if the densities found in sampled sites are representative of worm density throughout the inhabitable part of the estuary.
Discussion
Taxonomic and distributional implications
Diopatra aciculata was originally described from a single specimen collected from Port Phillip Bay, Australia (Knox & Cameron, Reference Knox and Cameron1971). The species went unreported for more than 20 years before being re-described by Paxton (Reference Paxton1993) who reported a distribution mostly along the south-eastern coast of Australia from several large, marine-dominated estuaries and embayments, including Port Phillip Bay, Botany Bay, Hobson Bay, Barker's Inlet and Swan Estuary. These estuaries have conditions very similar to those that predominate in most of the Knysna Estuary (cf. Paxton, Reference Paxton1993; Allanson et al., Reference Allanson, Maree and Grange2000a; Largier et al., Reference Largier, Attwood and Harcourt-Baldwin2000). In South Africa, the distribution of D. aciculata has only been confirmed for Knysna and Swartkops estuaries on the south and south-east coasts of the country, respectively (van Rensburg, Reference van Rensburg2019; Elgetany et al., Reference Elgetany, van Rensburg, Hektoen, Matthee, Budaeva, Simon and Struck2020). No large-bodied Diopatra species was detected during extensive biodiversity surveys conducted in the Knysna Estuary in the 1940s and 1990s (Day et al., Reference Day, Millard and Harrison1951; Allanson et al., Reference Allanson, Nettleton and de Villiers2000b). An unidentified Diopatra was first recorded in Knysna about 15 years ago (Napier et al., Reference Napier, Turpie and Clark2009) and it was only recently confirmed to be D. aciculata (van Rensburg, Reference van Rensburg2019; Elgetany et al., Reference Elgetany, van Rensburg, Hektoen, Matthee, Budaeva, Simon and Struck2020). It is therefore probable that D. aciculata arrived in the estuary during the last 15–25 years. By contrast, Diopatra neapolitana, the morphologically similar species (Daǧli et al., Reference Daǧli, Ergen and Çinar2005; van Rensburg, Reference van Rensburg2019; Elgetany et al., Reference Elgetany, van Rensburg, Hektoen, Matthee, Budaeva, Simon and Struck2020; current study) used as bait in the Mediterranean and Portugal (Cunha et al., Reference Cunha, Hall and Queiroga2005; Daǧli et al., Reference Daǧli, Ergen and Çinar2005; Pires et al., Reference Pires, Freitas, Quintino and Rodrigues2012a; de Carvalho et al., Reference de Carvalho, Vaz, Sérgio and Dos Santos2013; Arias et al., Reference Arias, Paxton and Budaeva2016) was reported in the Swartkops Estuary in the 1950s (Macnae, Reference MacNae1956, Reference MacNae1957) where it was also later reported to be used as bait (van der Westhuizen and Marais, Reference van Der Westhuizen and Marais1977). Given the morphological and molecular evidence that confirmed the presence of D. aciculata in Swartkops Estuary (van Rensburg, Reference van Rensburg2019; Elgetany et al., Reference Elgetany, van Rensburg, Hektoen, Matthee, Budaeva, Simon and Struck2020; current study), it is likely that D. neapolitana were misidentified there.
Historically, in South Africa, Day (Reference Day1967) reported D. neapolitana at only two isolated localities, once in Namibia and once in Durban harbour, disregarding reports from Swartkops (Macnae, Reference MacNae1956, Reference MacNae1957). Later the species was reported from Sundays River Estuary 25 km east of Swartkops (McLachlan et al., Reference McLachlan, Cockcroft and Malan1984) and more recently documented to have a continuous distribution along the southern African coast (Branch et al., Reference Branch, Griffiths, Branch, Beckley and Bowles2016). However, the distribution from northern Namibia to southern Mozambique, as defined by Branch et al. (Reference Branch, Griffiths, Branch, Beckley and Bowles2016), has not been confirmed and is likely a consequence of conflating descriptions and distributions of D. neapolitana and an indigenous subspecies, Diopatra neapolitana capensis (cf. Day, Reference Day1967; Branch et al., Reference Branch, Griffiths, Branch, Beckley and Bowles2016). If reports of D. neapolitana in Swartkops Estuary (Macnae, Reference MacNae1956, Reference MacNae1957) were actually of D. aciculata, then other reports (e.g. Day, Reference Day1967; McLachlan et al., Reference McLachlan, Cockcroft and Malan1984; Branch et al., Reference Branch, Griffiths, Branch, Beckley and Bowles2016) may also represent misidentifications, especially since the cosmopolitan distribution of D. neapolitana has been questioned (Paxton, Reference Paxton1998; Berke et al., Reference Berke, Mahon, Lima, Halanych, Wethey and Woodin2010; Fauchald et al., Reference Fauchald, Berke and Woodin2012), with records from Japan referred to Diopatra sukogokai (Paxton, Reference Paxton1998). If this is the case, then records of D. aciculata in South Africa pre-date its description in Australia. Consequently, it is not certain if D. aciculata is native in Australia and non-indigenous in South Africa, or vice versa, and it should be considered cryptogenic until molecular analyses can provide more insight into population structure of the continental populations. There is, however, no doubt that the species is undergoing range expansion in South Africa, but until the native range is elucidated, it is unclear if this expansion is extralimital or invasive (sensu Robinson et al., Reference Robinson, Alexander, Simon, Griffiths, Peters, Sibanda, Miza, Groenewald, Majiedt and Sink2016). However, recent evidence confirms the alien presence of D. neapolitana in India (Parameswaran, Reference Parameswaran1973; Elgetany et al., Reference Elgetany, van Rensburg, Hektoen, Matthee, Budaeva, Simon and Struck2020) and Brazil (Bergamo et al., Reference Bergamo, Carrerette and de Matos Nogueira2019), thus other identifications outside the Mediterranean, such as in Vietnam (Tue et al., Reference Tue, Hamaoka, Sogabe, Quy, Nhuan and Omori2012) and Mozambique (MacNae & Kalk, Reference MacNae and Kalk1958) may well be correct. Morphologically D. aciculata and D. neapolitana are very similar and exceedingly difficult to tell apart, although the longer dorsal cirri, wider bodies and longer antennae of D. aciculata (Elgetany et al., Reference Elgetany, van Rensburg, Hektoen, Matthee, Budaeva, Simon and Struck2020) may be the best distinguishing characters in accordance with recent findings. The presence of spermaductal papillae as described for D. neapolitana (Arias et al., Reference Arias, Paxton and Budaeva2016) has also not yet been observed in D. aciculata.
Distribution, density and population estimate
Diopatra aciculata occurred throughout the estuary, from sites near the mouth to about 12 km upstream, and seems to be absent where freshwater conditions start to predominate (Figures 2 & 9, cf. Largier et al., Reference Largier, Attwood and Harcourt-Baldwin2000). This distribution is not surprising. Although Diopatra are essentially marine-adapted, many species, including D. aciculata, occur in estuaries (van Der Westhuizen & Marais, Reference van Der Westhuizen and Marais1977; Cunha et al., Reference Cunha, Hall and Queiroga2005; Rodrigues et al., Reference Rodrigues, Pires, Mendo and Quintino2009; Arias et al., Reference Arias, Anadón and Paxton2010; Pires et al., Reference Pires, Paxton, Quintino and Rodrigues2010; Pires et al., Reference Pires, Quintino, Gentil, Freitas and Rodrigues2012b; de Carvalho et al., Reference de Carvalho, Vaz, Sérgio and Dos Santos2013; Arias & Paxton, Reference Arias and Paxton2014), particularly large, marine-dominated estuaries and embayments (Paxton, Reference Paxton1993). Furthermore, absence of the species from areas where estuarine conditions are freshwater dominated (Largier et al., Reference Largier, Attwood and Harcourt-Baldwin2000) reflects known low tolerance by Diopatra species for very low salinities (Hakkim, Reference Hakkim1975; Freitas et al., Reference Freitas, Pires, Velez, Almeida, Wrona, Soares and Figueira2015; Pires et al., Reference Pires, Figueira, Moreira, Soares and Freitas2015).
Although Diopatra aciculata was found at sites throughout most of the estuary, distribution was patchy; densest patches were found in areas that are well flushed during low tide, while few or no worms were found in areas with little or no flowing water during low tide (van Rensburg, 2017 Pers. Obs.). We therefore hypothesize that the patchy distribution within the estuary could reflect a preference for certain microhabitats, especially with regards to water flow. This was previously demonstrated by Mangum et al. (Reference Mangum, Santos and Rhodes1968) who found a positive correlation between population density of Diopatra cuprea (Bosc, 1802) and current velocity. The apparent preference for flowing water may be related to feeding behaviour; Diopatra species are considered to be discreetly mobile, never completely leaving their permanent tubes, but instead waiting for food to pass within easy reach of their tube openings (Fauchald & Jumars, Reference Fauchald and Jumars1979; Jumars et al., Reference Jumars, Dorgan and Lindsay2015). Such species probably rely on higher water flow rates to bring more food towards them.
Species of the genus Diopatra can often attain high densities (Paxton & Bailey-Brock, Reference Paxton and Bailey-Brock1986; Conti & Massa, Reference Conti and Massa1998; Harwell & Orth, Reference Harwell and Orth2001; Cunha et al., Reference Cunha, Hall and Queiroga2005; Daǧli et al., Reference Daǧli, Ergen and Çinar2005; Rodrigues et al., Reference Rodrigues, Pires, Mendo and Quintino2009; Berke et al., Reference Berke, Mahon, Lima, Halanych, Wethey and Woodin2010; Arias & Paxton, Reference Arias and Paxton2015; Arias et al., Reference Arias, Paxton and Budaeva2016). For example, mean densities of the similarly sized D. neapolitana range from 20–200 worms m−2 in different parts of the Mediterranean (Daǧli et al., Reference Daǧli, Ergen and Çinar2005; Berke et al., Reference Berke, Mahon, Lima, Halanych, Wethey and Woodin2010; Arias & Paxton, Reference Arias and Paxton2015; Arias et al., Reference Arias, Paxton and Budaeva2016). At a mean of 3.47 worms m−2, densities of D. aciculata in Knysna are much lower, but the maximum of 51 worms m−2 suggests great potential for an increase in population size.
We estimated that 20–24 million D. aciculata may currently occur in Knysna Estuary, suggesting that it has the potential to play a significant role in the Knysna Estuary ecosystem. Twenty million individuals could undoubtedly have a trophic impact either as a resource for fish (e.g. van der Westhuizen & Marais, Reference van Der Westhuizen and Marais1977) and birds (e.g. Perez-Hurtado et al., Reference Perez-Hurtado, Goss-Custard and Garcia1997) or as a predator of other invertebrates (e.g. Tue et al., Reference Tue, Hamaoka, Sogabe, Quy, Nhuan and Omori2012). Furthermore, Diopatra tubes may affect biodiversity by providing or modifying habitats for other organisms (Woodin, Reference Woodin1981; Harwell & Orth, Reference Harwell and Orth2001; Thomsen & McGlathery, Reference Thomsen and McGlathery2005; Berke et al., Reference Berke, Mahon, Lima, Halanych, Wethey and Woodin2010; Thomsen et al., Reference Thomsen, Muth and McGlathery2011). Other Diopatra have been classified as sediment stabilizers (Bailey-Brock, Reference Bailey-Brock1984; Luckenbach, Reference Luckenbach1986), thus, D. aciculata may displace important indigenous bioturbating bait species such as Arenicola loveni (Reichardt, Reference Reichardt1988; Huttel, Reference Huttel1990; Philippart, Reference Philippart1994; Napier et al., Reference Napier, Turpie and Clark2009; Berke et al., Reference Berke, Mahon, Lima, Halanych, Wethey and Woodin2010; Pillay et al., Reference Pillay, Williams and Whitfield2012; Simon et al., Reference Simon, du Toit, Smith, Claassens, Smith and Smith2019) and sandprawn, Callichirus kraussi (Branch & Pringle, Reference Branch and Pringle1987; Siebert & Branch, Reference Siebert and Branch2006, Reference Siebert and Branch2007; Pillay et al., Reference Pillay, Branch and Forbes2007, Reference Pillay, Williams and Whitfield2012; Henninger & Froneman, Reference Henninger and Froneman2013) while also facilitating mudprawn Upogebia africana which prefers more stable sediments (Wynberg & Branch, Reference Wynberg and Branch1994; Siebert & Branch, Reference Siebert and Branch2005). By contrast, by trapping seeds or plants in their tubes, D. aciculata may facilitate the recovery or maintenance of seagrass (see Harwell & Orth, Reference Harwell and Orth2001; Thomsen & McGlathery, Reference Thomsen and McGlathery2005) such as Zostera capensis Setch, 1933 that have declined in the Knysna Estuary in the last 50 years (see Allanson et al., Reference Allanson, Nettleton and de Villiers2000b; cf. Day et al., Reference Day, Millard and Harrison1951; Maree, Reference Maree2010). Restoration of Z. capensis may provide increased habitat for fish (Whitfield et al., Reference Whitfield, Beckley, Bennett, Branch, Kok, Potter and van der Elst1989) and invertebrates (Mead et al., Reference Mead, Griffiths, Branch, Mcquaid, Blamey, Bolton, Anderson, Dufois, Rouault, Froneman, Whitfield, Harris, Nel, Pillay and Adams2013), including the endangered Knysna seahorse Hippocampus capensis (Teske et al., Reference Teske, Lockyear, Hecht and Kaiser2007) and the critically endangered limpet Siphonaria compressa (Allanson & Herbert, Reference Allanson and Herbert2005), but also reduce densities of invertebrate species that were absent when Zostera were abundant (Allanson et al., Reference Allanson, Nettleton and de Villiers2000b). The current density of D. aciculata may still be too low to cause significant effects. Potential impacts may therefore still be mitigated, especially if continued population growth can be controlled.
Whatever the origin of the species, it was not present in the Knysna Estuary before the late 1990s, and population growth control should still be considered since it may negatively affect the ecosystem. The easiest way to do so may be by encouraging increased harvesting by bait collectors since bait polychaetes, including D. neapolitana (Daǧli et al., Reference Daǧli, Ergen and Çinar2005) are susceptible to over fishing (Gaigher, Reference Gaigher1979; Baird et al., Reference Baird, Marais and Wooldridge1981; Britz et al., Reference Britz, Sauer, Mather, Oellerman, Cowley, ter Morshuizen and Bacela2001; Simon et al., Reference Simon, Kara, Naidoo and Matthee2020). This solution should, however, be considered with caution since intensive bait collecting does not only affect target species, but can also indirectly harm the habitat and associated biota by trampling and physical disturbance of the environment (Wynberg & Branch, Reference Wynberg and Branch1991, Reference Wynberg and Branch1994, Reference Wynberg and Branch1997; Pillay et al., Reference Pillay, Branch, Griffiths, Williams and Prinsloo2010; Simon et al., Reference Simon, du Toit, Smith, Claassens, Smith and Smith2019). Furthermore, as D. aciculata can only be collected manually from the intertidal zone (van Rensburg, 2017 Pers. Obs.), subtidal populations can provide a continuous supply of recruits to re-populate the intertidal baited areas.
The identification of a potentially invasive polychaete species that is conspicuous, harvested as bait and which occupies one of the most important estuaries in South Africa highlights the gaps in our knowledge of such species in the country (see Britz et al., Reference Britz, Sauer, Mather, Oellerman, Cowley, ter Morshuizen and Bacela2001; Simon et al., Reference Simon, du Toit, Smith, Claassens, Smith and Smith2019; Simon et al., Reference Simon, Kara, Naidoo and Matthee2020). The appearance of D. aciculata in Knysna Estuary was probably not considered unusual because of its close resemblance to D. neapolitana, a species already thought to occur widely (and naturally) in South Africa, including on the south coast (Macnae, Reference MacNae1956, Reference MacNae1957; McLachlan et al., Reference McLachlan, Cockcroft and Malan1984; Branch et al., Reference Branch, Griffiths, Branch, Beckley and Bowles2016). Very few studies in South Africa have investigated the taxonomy (Lewis & Karageorgopoulos, Reference Lewis and Karageorgopoulos2008; Kara et al., Reference Kara, Macdonald and Simon2018) or population structure (Gaigher, Reference Gaigher1979; van Herwerden, Reference van Herwerden1989; Kara et al., Reference Kara, Macdonald and Simon2018; Simon et al., Reference Simon, Kara, Naidoo and Matthee2020) of bait polychaetes and we have no understanding of their ecological impacts within their ecosystems. Thus, further research on exploited bait polychaetes is needed. Additionally, further research on D. aciculata should be conducted on global, regional and local scales, particularly to determine (1) the complete distribution in South Africa, (2) if the species is invasive or native, (3) its ecological and trophic impacts and (4) a more accurate population estimate and extirpation viability assessment.
Supplementary material
The supplementary material for this article can be found at https://doi.org/10.1017/S0025315420000740.
Acknowledgements
The authors would like to thank the National Research Foundation (NRF), The Foundational Biodiversity Information Programme (FBIP) and the National Scientific Collections Facility (NSCF) for funding. Furthermore, we wish to thank all field assistants and fishermen who helped with sampling. In particular, we thank Dr Louw Claassens, Mrs Frances Smith and Mr Peter Smith of the Knysna Basin Project for help with developing the project, help with sampling and their hospitality during sampling trips, and Mr Kyle Smith of South African National Parks for his advice while developing the project. Samples were collected under permit RES2017-27 issued to CAS by Department of Agriculture, Forestry and Fisheries. All applicable international, national, and/or institutional guidelines for the care and use of animals were followed by the authors.
Financial support
This work was supported by the Natural Science Collections Facility of South Africa (HvR); and The National Research Foundation's Foundational Biodiversity Information Programme (CAS, grant number 104890).