Implications
Food can encourage voluntary cow traffic in automatic milking systems (AMS). Cow preferences for some forage types over others may mean that forage crops can be an incentive for encouraging voluntary cow traffic while also increasing the volume of home-grown feed in pasture-based systems. The aim of this study was to investigate the effect of offering a forage crop (SOYBEAN) compared with perennial ryegrass (GRASS) on premilking voluntary waiting times. No difference in waiting time was detected between treatments, however, similar results indicate that it may be possible to incorporate forage crops without adversely affecting traffic.
Introduction
It is now possible for farmers milking large herds to opt for a high throughput technology (robotic rotary (RR); Automatic Milking Rotary, DeLaval, Tumba, Sweden) with a targeted throughput capacity of up to 1600 milkings/day (Kolbach et al., Reference Kolbach, Kerrisk, Garcia and Dhand2012) or, equivalently, 800 cows milked twice a day. Unlike single-box and multi-box installations that have multiple entry points to the milking equipment, the RR has only one entry point through which the entire herd can access the milking equipment and leave the dairy. Therefore, the potential exists for cow traffic at the dairy to be reduced as demand for the RR increases. It has been reported that premilking queue lengths exceeding 20 cows increased the time cows spent waiting before milking (Scott et al., Reference Scott, Kerrisk, Thomson, Lyons and Garcia2014); however, knowledge surrounding strategies to minimise queue length and congestion, and maintain efficient cow traffic at the dairy, is somewhat limiting at present.
Cows in pasture-based AMS are forced to walk longer distances compared with cows in indoor systems. As herd size increases, walking distance must also increase if stocking rate, or the volume of feed produced per hectare, is to remain unchanged. Distances in excess of 500 m have been reported to increase milking interval (MI; time between two consecutive milkings) (Lyons et al., Reference Lyons, Kerrisk and Garcia2013a), while a distance of 260 m, in comparison with 50 m, was associated with reduced milking frequency at the start of the pasture season for cows housed indoors with access to pasture (Sporndly and Wredle, Reference Sporndly and Wredle2004). In contrast, distances up to 360 m were reported to have no effect on the number of visits or milkings achieved when cows had access to pasture for 15 h/day (Ketelaar-de Lauwere et al., Reference Ketelaar-de Lauwere, Ipema, Lokhorst, Metz, Noordhuizen, Schouten and Smits2000b), nor did a distance of up to 500 m affect MI, milk production or time at pasture for cows in an indoor system with access to pasture (van Dooren et al., Reference van Dooren, Heutinck and Biewenga2004). Therefore, although there is some evidence pointing towards the significant negative effect of walking distance on voluntary cow traffic in AMS, there is still a degree of ambiguity as to the extent of the effect of walking distance and how to overcome it.
Feed is commonly used as an incentive to encourage cows to traffic around AMS, with cow motivation for feed reported to be greater than that of milking (Prescott et al., Reference Prescott, Mottram and Webster1998a). Offering feed during milking or in the dairy facility has been linked to increases in voluntary cow traffic in pasture-based systems (Lyons et al., Reference Lyons, Kerrisk, Dhand and Garcia2013b; Scott et al., Reference Scott, Kerrisk, Thomson, Lyons and Garcia2014), although varying the quantity of feed offered during milking was reported to have no effect on improving cow traffic in indoor systems (Halachmi et al., Reference Halachmi, Maltz, Livshin, Antler, Ben-Ghedalia and Miron2005; Bach et al., Reference Bach, Iglesias, Calsamiglia and Devant2007). Pasture allocations, or more specifically the amount of pasture biomass offered per cow, has been shown to impact cow behaviour and the timing at which cows exit an allocation (Lyons et al., Reference Lyons, Kerrisk and Garcia2014). Furthermore, cattle and sheep have been reported to show preferences for certain forages when offered a selection of two or more (Parsons et al., Reference Parsons, Newman, Penning, Harvey and Orr1994; Marotti et al., Reference Marotti, Cosgrove, Chapman, Parsons, Egan and Anderson2002; Rutter et al., Reference Rutter, Orr, Yarrow and Champion2004), preferring soybean (Glycine max) over cowpeas (Vigna unguiculata) and lablab (Lablab purpureus) (Horadagoda, Reference Horadagoda2009). Preference for soybean meal when offered 27 different concentrate types and forms has also been shown (Primdal et al., Reference Primdal, Johansen and Weisbjerg2014). Although no difference in overall daily eating duration was reported, a study investigating the impact of replacing roughage with soy hulls in a total mixed ration diet did result in increased intake and meal duration for the soy hull treatment (Halachmi et al., Reference Halachmi, Shoshani, Solomon, Maltz and Miron2004), which could suggest that cows had a preference for the soy hulls. Considering the results from these previous investigations, it may be possible to use a ‘preferred’ forage to further encourage cow traffic; specifically through the premilking yard if the forages are offered after milking.
The present study was a preliminary investigation into whether the prospect of accessing a forage crop after milking could reduce premilking waiting times at the dairy and increase cow traffic in a pasture-based RR system. It was hypothesised that offering a forage crop for grazing would increase cow traffic at the dairy.
Material and methods
A field study was conducted over a 4-week period in early 2012 at the FutureDairy AMS research farm (Elizabeth Macarthur Agricultural Institute, NSW DPI, Camden, NSW, Australia). Ethics approval was granted by the NSW DPI AEC (project number M10/12) before the commencement of the study.
The milking herd consisted of 194 cows of mixed breed (majority Holstein Friesian) and mixed age, averaging 2.8 lactations (median 2.0; SD 1.9). At the commencement of the study, the 7-day average milk yield was 21.3 l/cow per day (median 21.2; SD 8.1 l), with an average days in milk of 176 days (median 162; SD 124) and a 7-day average milking frequency of 1.9 milkings/cow per day (median 1.9; SD 0.5).
General farm management
All cows were milked on a 16-bail internal herringbone prototype RR (Kolbach et al., Reference Kolbach, Kerrisk, Garcia and Dhand2012) and managed as a single herd under voluntary cow traffic conditions, with eight of the 16 bails available for milking at any one time in an attempt to manage system utilisation (match throughput capacity to herd size, as previously reported by Scott et al., Reference Scott, Kerrisk, Thomson, Lyons and Garcia2014). To access the RR, cows were directed at Gate 1 into the closed premilking yard (i.e. the only exit from the premilking yard was through the RR) (Figure 1). Cows could access the RR (i.e. be milked) for ~20 h/day (~4 h/day were dedicated to washing and cleaning), with the robot being available between 0800 and 1700 h (‘day’ milking session) and 1900 and 0600 h (‘night’ milking session). ‘Day’ and ‘night’ sessions were separated by plant washing and cleaning activities at ~1800 and 0700 h, respectively. Cows with abnormal milk (e.g. colostrum) were managed as a separate herd and batch milked twice daily at the conclusion of a milking session before plant washing.
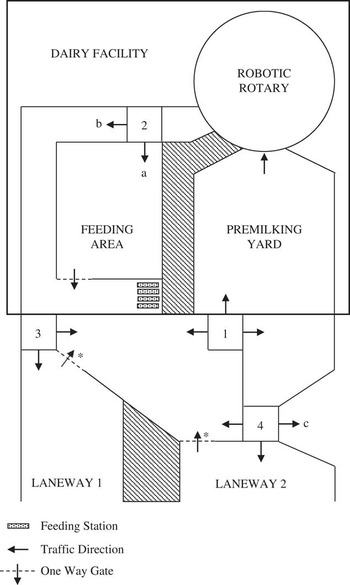
Schematic layout (not to scale) of the dairy facility, where arrows indicate the flow of cow traffic throughout the facility. Numbers represent automatic selection gates, with up to three outcomes (indicated with arrows) for each gate. At point ‘a’, cows were directed to the feeding area to access partial mixed ration (between 2100 and 0900 h) and bypassed the feeding area (point ‘b’) between 0900 and 2100 h. Cows in the abnormal milk group were directed to pasture at point ‘c’. Laneway 1 led to the SOYBEAN allocation between 0900 and 1500 h and the JOINT AFTERNOON allocation between 1500 and 2100 h, whereas Laneway 2 led to the GRASS allocation between 0900 and 1500 h and the NIGHT allocation between 2100 and 0900 h. Cows re-entered the dairy facility through one-way gates (marked with *) at the end of both laneways.

Cow traffic was managed through a series of automatic gates (Figure 1). Cows were denied access to the dairy facility and directed back to pasture if <4 h had elapsed since their previous successful milking. Any cow with an incomplete milking was automatically sent directly for a second attempt at milking to reduce the incidence of cows being directed to pasture without a complete milking. A cow was deemed incomplete if <75% of the expected milk yield was harvested from any one quarter.
Feed allocation was based on a nominal target (dry matter (DM) on offer per cow) of 22 kg and included kikuyu (Pennisetum clandestinum; 8 kg DM/cow per day offered in two daily allocations of 4 kg DM/cow each), partial mixed ration (PMR; 4 kg DM/cow per day), pelleted concentrate (6 kg DM/cow per day; 16% protein) and 4 kg DM/cow per day of one of two grazing treatments (SOYBEAN or GRASS). The target DM on offer for both the kikuyu pasture and the forage treatments was based on DM ‘disappearance’ (difference between DM biomass before and after grazing), meaning that actual DM intake would be lower than target. The PMR ration (% dry weight) consisted of 18% lucerne hay (Medicago sativa) and 82% maize silage (Zea mays) and was fed on a concrete feedpad (28×4 m=112 m2) adjacent to the premilking yard. The PMR was available to cows following milking between 2100 and 0900 h, whereas the pelleted concentrate was accessible following milking throughout the entire 24 h day from four AMS (FSC400; DeLaval). Water was available in the dairy facility post-milking and at pasture ad libitum.
The farm operated as a pasture-based system. Using a novel approach to the two-way grazing scheme, where cows are given access to two fresh allocations per 24 h day (Lyons et al., Reference Lyons, Kerrisk and Garcia2013c), all cows were granted access to a ‘night’ allocation of kikuyu from 2100 to 0900 h (called JOINT NIGHT; 496 m from dairy), whereas the ‘day’ allocation (0900 to 2100 h) was split into two ‘sub-allocations’ (Table 1). During the first ‘sub-allocation’, from 0900 to 1500 h, cows were granted access to one of two treatment paddocks; SOYBEAN (G. max cv. A6785; 612 m from dairy) or GRASS (predominantly perennial ryegrass (Lolium perenne); 428 m from dairy). This was the only treatment-based separation of cows throughout the study (see treatment description below). The second ‘sub-allocation’ was available from 1500 to 2100 h and was a kikuyu paddock (called JOINT AFTERNOON; 295 m from dairy) to which all cows had access.
Paddock allocation design, including the pasture or forage species type, the time of day (h) each allocation was available to cows, the time any remaining cows were fetched from the allocation and brought back to the dairy and the dry matter (DM)/cow targeted allocation

1 All cows remaining in the allocation were fetched from the paddock at the indicated time.
2 Allocation supplemented by 4 kg DM/cow per day partial mixed ration.
3 Cows were granted access to one of two treatment paddocks (did not go to both simultaneously) and separated during this sub-allocation into treatments based on treatment sequence allocation.
Biomasses of pasture and crops were estimated by different methods due to the different plant morphology and crop architecture. Pasture compressed height was measured daily by a trained research technician using an electronic rising plate meter (Rising Plate Counter; FarmWorks, Feilding, New Zealand). Pasture biomass was then estimated using calibration equations developed previously on the same site (Garcia et al., Reference Garcia, Fulkerson and Brookes2008) and data were used to calculate area per allocation. Soybean biomass cannot be accurately measured with a plate meter and was estimated daily by taking three 30×30 cm quadrant samples of the pre- and post-grazing mass at random sites. Due to limited literature on the correct management for grazing soybean, data from the training period were used to determine appropriate allocations with target post-grazing cover set at ~50% of the available pre-grazing cover.
Experimental design
A cross-over design consisting of two periods of 7 days duration each was used in this study. Periods comprised of 4 days of habituation followed by 3 days of data collection. Before commencing the first study period, cows were trained over 5 days to accustom them to the soybean crop. Training involved 2 days of manual herding to ensure all cows accessed the soybean paddock, followed by 3 days of voluntary cow traffic with encouragement given as deemed necessary. The method and duration of training was based on several previous studies of forage palatability conducted by the same research group, using similar methodology as that reported by Horadagoda et al. (Reference Horadagoda, Fulkerson, Nandra and Barchia2009). No training was necessary for traffic patterns throughout the remainder of the farm system as cows were familiar with the farm layout and paddocks grazed.
Cows were randomly assigned a treatment sequence (either ‘GRASS-SOYBEAN’ or ‘SOYBEAN-GRASS’) at the commencement of the study, with sequence reflecting the order of treatment allocation across the two experimental periods. Sequences were balanced for days in milk, daily milk yield and parity. Cows were directed to treatment paddocks by automatic drafting gates as they exited the dairy (Figure 1).
Data collection
Cow traffic events (gate passings and milkings) were recorded electronically throughout the study using herd management software (DelPro Software 3.5; DeLaval) and were used to calculate the length of time cows spent in various locations across the farm. Voluntary waiting time was calculated per cow per milking and was considered to be the total time spent in the premilking yard (~24×6 m=144 m2) during which a cow could freely volunteer for milking, excluding forced waiting time. Forced waiting time was defined as any period of time when a cow was present in the premilking yard but physically prevented from milking (e.g. machine downtime (system washing, maintenance and/or breakdown) or during the milking of abnormal milk cows). Any cows remaining in the premilking yard at the end of a milking session were recorded and manually encouraged onto the RR for milking before milking abnormal milk cows, limiting the total time a cow could voluntarily spend in the premilking yard to ~10 h in any one milking session.
Return time was calculated per cow per milking, and was considered to be the total time a cow spent away from the dairy leading up to a given milking, taken from the time of the last gate passage exiting the dairy facility until the first gate passage arriving at the dairy facility. Return time included walking time on laneways, which could not be distinguished from actual time spent within a paddock allocation. Cows that had not returned from the JOINT AFTERNOON or JOINT NIGHT allocations were recorded and ‘fetched’ back to the dairy at ~0700 and 1800 h, respectively, whereas cows that had not returned from the SOYBEAN or GRASS allocations were fetched out of the allocation at 1700 h. Return times were not calculated for incomplete cows returning back to the premilking yard and RR for a second milking attempt.
The MI was calculated as the total time between two consecutive milkings and included voluntary waiting time, return time and time spent moving between drafting gates within the dairy facility (including time within the feeding area). Cows returning back to the premilking yard and RR for a second milking attempt did not have a calculated MI.
Statistical analysis
Initial descriptive statistics were conducted to explore the distribution of MI. Data were analysed with linear mixed modelling using a restricted maximum likelihood procedure in GenStat 15th Edition (VSN International, Hemel Hempstead, UK). Residual diagnostics were used to evaluate model assumptions and data were transformed where appropriate to establish normality and constant variance (further information on data transformation provided below). Predicted means from the fitted model, along with their standard errors, were produced and back-transformed using appropriate standard.
Before analysis, cows in milk for <14 days at the start of data collection (n=13) as well as cows in the abnormal milk group at any stage throughout the study (n=20) were excluded (~15% of data). Data from voluntary waiting times that concluded with a cow being ‘encouraged’ were also excluded from analysis as the full length of the waiting time was not able to be determined (censored data). Therefore traffic data from a total of 161 cows were analysed.
All models included the effects of Period (1 and 2), Sequence (‘GRASS-SOYBEAN’ and ‘SOYBEAN-GRASS’), Day Night (whether a milking occurred in the ‘day’ or ‘night’ milking session), SOL (stage of lactation, being early=<100; mid=100 to 199; and late=⩾200 days in milk), Lactation Group (Group 1=lactation 1; Group 2=lactation 2; Group 3=lactation 3; Group 4=lactation 4; and Group 5=lactations 5 and above) and Milk Yield Group (low=⩽16 l; mid=16.1 to 25.0 l; and high=25.1 to 42.0 l/cow per day). CowID (individual cow given a unique identification number) and TrialDay (data collection day) were included as random effects, as was the residual error term, ε. In pasture-based AMS, cows are able to act independently of their herdmates and, as such, are considered as the experimental unit (Sporndly and Wredle, Reference Sporndly and Wredle2004 and Reference Sporndly and Wredle2005; Lyons et al., Reference Lyons, Kerrisk, Dhand and Garcia2013b and Reference Lyons, Kerrisk and Garcia2013c; Scott et al., Reference Scott, Kerrisk, Thomson, Lyons and Garcia2014).
Voluntary waiting time
Data were log-transformed. Treatment was investigated through the effects of Area To (area of the farm a cow would be sent to after milking, being GRASS; SOYBEAN; JOINT AFTERNOON; JOINT NIGHT; and Milking) and Area From (area of the farm a cow came back to the dairy from, as per Area To). Additional effects investigated were Fetch (whether a cow arrived at the dairy as a result of being fetched from the paddock allocation, as ‘yes’ or ‘no’), Forced (whether a cow had been forced to wait before volunteering for milking due to breakdown, plant wash, etc., as ‘forced’ or ‘voluntary’) and Entry Group (the number of cows present in the premilking yard at the time of entry, being 1=1 to 10 cows; 2=11 to 20 cows; 3=21 to 30 cows; 4=31 to 40 cows; and 5=⩾41 cows). Note that Entry Group indicated queue length at the time of entry into the premilking yard and does not account for fluctuations in queue length over time.
Return time
Data were transformed on the square root scale. Treatment was investigated through the effects of Paddock From (the paddock a cow came back to the dairy from, being GRASS; SOYBEAN; JOINT AFTERNOON; and JOINT NIGHT).
Results
A total of 1970 individual milking events were analysed. The average MI throughout the study was 14.1±0.2 h, whereas the average milk yield per milking was 12.5±0.2 l/milking (excluding incompletely milked cows). Period, SOL and Sequence did not affect any of the cow traffic parameters investigated (all P>0.05). For all outcome variables, there were no interactions between SOL, Lactation Group and Milk Yield Group (all P>0.05). Average pre- and post-plant biomass (kg of DM/ha) was 4716.7±183.5 and 2400.0±260.8 for SOYBEAN and 2780.0±139.0 and 1505.8±115.1 for GRASS, whereas estimated intake (kg/cow; based on DM disappearance at each grazing event) was 4.2±0.2 and 2.4±0.2 for SOYBEAN and GRASS treatments, respectively.
Voluntary waiting time
Treatment did not have an effect on voluntary waiting time, with average voluntary waiting times of 44.7±6.0 and 45.6±6.2 min for GRASS and SOYBEAN, respectively (P>0.05). Overall voluntary waiting time was 45.5±6.0 min (P=0.621). Similarly, voluntary waiting time did not differ between cows coming back to the dairy from either treatment (45.1±6.1 and 46.2±6.3 min for GRASS and SOYBEAN, respectively), however, it was shorter when cows came back from the JOINT AFTERNOON allocation (P=0.005).
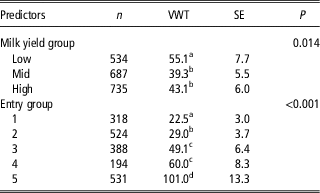
Milk yield and queue length (Entry Group) affected voluntary waiting time (P=0.014 and P<0.001, respectively; Table 2). Cows in the low milk yield group took just over 10 min more per milking before presenting themselves for milking than cows in the mid and high milk yield groups, whereas cows that entered the premilking yard with a queue of 10 or fewer cows (Entry Group 1; equivalent to 7 cows/100 m2) had an average waiting time that was 23% shorter than when the queue was between 11 and 20 cows (Entry Group 2; equivalent to 14 cows/100 m2), and up to 78% shorter than when the queue exceeded 40 cows (Entry Group 5; equivalent to 28 cows/100 m2).
Mean voluntary waiting times (VWT) in the premilking yard (min) and the number (n) of event records for milk yield group (low=⩽16 l; mid=16.1 to 25.0 l; and high=25.1 to 42.0 l) and entry group (the number of cows present in the premilking yard at the time of entry, being 1=1 to 10 cows; 2=11 to 20 cows; 3=21 to 30 cows; 4=31 to 40 cows; and 5=⩾41 cows) for cows in a pasture-based automatic milking system

a,b,c,dDifferent lowercase superscripts within a predictor are significant at P<0.05.
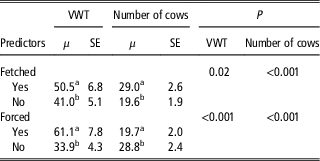
Fetching cows from the paddock to the dairy impacted on voluntary waiting time (P=0.02; Table 3). Cows that were fetched waited ~23% longer, with an average queue length ~10 cows longer (P<0.001), than cows that came back to the dairy voluntarily. Cows that were forced to wait at any point throughout their time in the premilking yard spent longer waiting before volunteering for milking than cows that were not forced to wait (P<0.001; Table 3). Interestingly, average queue length was shorter by almost 10 cows for cows that had a portion of their time in the premilking yard as forced (P<0.001).
Mean voluntary waiting time (VWT; min) and number of cows present in the premilking yard for milking events that were fetched (yes) or voluntary (no) and for milking events with a forced (yes) or voluntary (no) period for cows in a pasture-based automatic milking system

a,bDifferent lowercase superscripts within a predictor for a particular outcome are significant at P<0.05.
There was no effect of Lactation Group (P=0.093) or time of day (‘day’ or ‘night’ milking session; P=0.431) on voluntary waiting time.
Return time
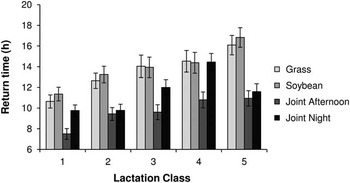
The paddock a cow came back to the dairy from affected return time (P<0.001), although there was no difference in return time between treatment paddocks. There was an interaction between Lactation Group and Paddock From (P<0.001; Figure 2), with a difference in return time between lactation groups as well as between paddocks.
Return time (h) of cows in a pasture-based automatic milking system, with an interaction between Lactation Group (1, 2, 3, 4 and 5+) and Paddock From (paddock a cow came back to the dairy from).

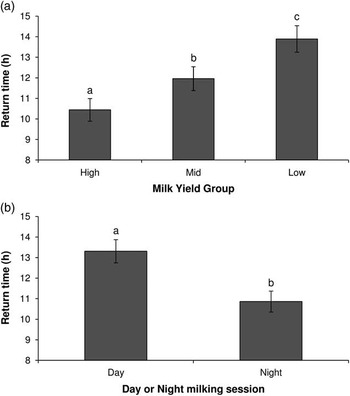
High-yielding cows returned to the dairy more than 1.5 h sooner than mid-yielding cows (P<0.001), whereas mid-yielding cows returned more than 2 h sooner than low-yielding cows (Figure 3a). The milking session in which a cow came back to the dairy also affected return time, with cows coming back to the dairy during the ‘night’ milking session returning just under 2.5 h sooner than cows that came back to the dairy during the ‘day’ milking session (P<0.001; Figure 3b).
The effect of (a) Milk Yield Group (high=25.1 to 42.0 l; mid=16.1 to 25.0 l; and low=0 to 16.0 l) and (b) ‘day’ or ‘night’ milking session (whether the milking occurred between 0800 and 1700 or 1800 and 0700 h, for ‘day’ and ‘night’, respectively) on the return time (h) of cows in a pasture-based automatic milking system.
a,b,cDifferent lowercase superscript letters indicate significance at P<0.05.

Discussion
The core aim of this study was to conduct a preliminary investigation into the possibility of using a palatable forage crop, the legume soybean, to reduce premilking waiting times and enhance cow traffic in a pasture-based AMS. Irrespective of the evidence that supports feed as a strong incentive for cow traffic (Prescott et al., Reference Prescott, Mottram and Webster1998b; Lyons et al., Reference Lyons, Kerrisk, Dhand and Garcia2013b and Reference Lyons, Kerrisk and Garcia2013c; Scott et al., Reference Scott, Kerrisk, Thomson, Lyons and Garcia2014), offering soybean for grazing did not encourage cows to traffic more readily, when compared with offering a predominantly perennial ryegrass sward. A greater estimated DM intake (based on DM disappearance) was noted for the SOYBEAN treatment despite our attempts to achieve similar estimated intakes in both treatments. However, this further indicates that cows were not more motivated to reach the soybean crop than they were to reach the pasture and that soybean was not an effective incentive. This finding is supported by the findings of Halachmi et al. (Reference Halachmi, Maltz, Livshin, Antler, Ben-Ghedalia and Miron2005) and Bach et al. (Reference Bach, Iglesias, Calsamiglia and Devant2007), who reported that the prospect of an increased quantity of concentrate offered at milking did not result in an increased number of milkings achieved per day. It also supports a study which observed no difference in milking frequency when soy hulls were incorporated into the concentrate ration for cows in an indoor-housed AMS (Halachmi et al., Reference Halachmi, Ofir and Miron2009).
On the basis of these results we must reject the hypothesis that soybean can be used to reduce premilking voluntary waiting times and improve voluntary cow traffic in pasture-based AMS, however also acknowledge that cow traffic was not worsened by offering soybean. It has previously been shown that the willingness to search for a ‘reward’ could be affected by the cost involved in obtaining it (Prescott et al., Reference Prescott, Mottram and Webster1998a). As such, it is possible that feed offered in the paddock, whether it is pasture or a forage crop, is too far removed from the act of milking to be an incentive for volunteering for milking, although the distance at which forage ceases to be an incentive is currently unknown. The absence of any negative effect of soybean on cow traffic indicates that it may be possible to incorporate complementary forage systems (Garcia et al., Reference Garcia, Fulkerson and Brookes2008; Farina et al., Reference Farina, Garcia and Fulkerson2011) into pasture-based AMS. Forage crops have been used to produce more than twice the annual DM per hectare as that achieved by pasture alone (Garcia et al., Reference Garcia, Fulkerson and Brookes2008), offering farmers the ability to increase the amount of home-grown feed in paddocks close to the dairy (Farina et al., Reference Farina, Garcia and Fulkerson2011). Therefore, although soybean, and potentially other forage crops, may not provide an incentive to encourage voluntary cow traffic, they may still be beneficial through reducing the average walking distance between the dairy and paddocks.
Soybean is a nutritious legume high in protein and energy but relatively low in fibre, similar to other legumes such as clover, which has been previously reported to alter rumen pH when compared with perennial ryegrass (Williams et al., Reference Williams, Doyle, Egan and Stockdale2005a and Reference Williams, Walker, Doyle, Egan and Stockdale2005b). To reduce the risk of disrupting the rumen environment and potentially causing the onset of acidosis and/or bloating in cows grazing SOYBEAN in the present study, both treatments were offered for only half of the typical ‘day’ allocation; available for 6 h rather than 12 h, and offering 4 kg DM/cow rather than 8 kg DM/cow. This reduction in target DM allocation (from 8 to 4 kg DM/cow) may have reduced the appeal of soybean as an incentive at pasture, and could partially explain why no difference in cow traffic between treatments was detected. It could also be that the longer walking distance to the SOYBEAN allocation compared with the PASTURE allocation (613 and 428 m, respectively) contributed to the lack of response in premilking waiting times between treatments, where walking distance has been associated with poorer cow traffic (Sporndly and Wredle, Reference Sporndly and Wredle2004). However there is no clear consensus within the literature as to the effect of walking distance on cow traffic, with other studies showing no effect (Ketelaar-de Lauwere et al., Reference Ketelaar-de Lauwere, Ipema, Lokhorst, Metz, Noordhuizen, Schouten and Smits2000b; van Dooren et al., Reference van Dooren, Heutinck and Biewenga2004).
Waiting time can be used as an indication of cow traffic in the premilking yard as it directly reflects the time cows (individuals or groups) spend at the dairy. However, current AMS software does not generate reports on waiting time. Therefore it may be more practical for producers looking to assess cow traffic at the dairy (particularly when operating the high throughput RR) to use queue length. It has been reported that when more than ~20 cows were in the queue, the addition of another cow negatively impacted cow traffic (Scott et al., Reference Scott, Kerrisk, Thomson, Lyons and Garcia2014), and that a density of more than ~14 cows/100 m2 (20 or fewer cows in the queue) led to increases in voluntary waiting time (Scott et al., Reference Scott, Thomson, Kerrisk and Garcia2015). In the present study, waiting time increased as queue length exceeded 10 cows (~7 cows/100 m2). Furthermore, queue length has been shown to adversely affect waiting times of subordinate cows but not necessarily dominant cows in the herd (Ketelaar-de Lauwere et al., Reference Ketelaar-de Lauwere, Devir and Metz1996; Halachmi, Reference Halachmi2009).
Strategies to limit queue length and waiting times have been investigated in indoor-housed AMS, however there is little known regarding pasture-based systems. In a simulated queuing study of an indoor AMS, limiting cows from accessing the milking equipment until more than 80% of the herd had been milked shortened the waiting time (Halachmi, Reference Halachmi2009). It was also reported that in an indoor AMS, increasing the feeding of forage from two to six times a day reduced waiting time, with a maximum of five cows in the queue at any one time (Oostra et al., Reference Oostra, Stefanowska and Sallvik2005). Although these strategies were effective in indoor systems, the nature of pasture-based management practices does not lend them to a similar approach. An alternative strategy worthy of investigation could be drafting ‘lower priority’ cows returning to the dairy to a small loafing or feeding area adjacent to the dairy facility if queue length exceeds the target/threshold length.
Cows that were fetched and/or forced to wait during their visit to the premilking yard were observed to have longer voluntary waiting times than cows that were not forced. Similar findings were reported by Scott et al. (Reference Scott, Thomson, Kerrisk and Garcia2015), with no clear explanation evident. Interestingly, queue length was shorter by an average of eight cows for cows that were forced to wait, as compared with cows that were voluntary (i.e. not forced to wait). This suggests that cows that had a portion of their waiting time as ‘forced’ chose to spend more time in the premilking yard following the milking equipment becoming available despite there being a shorter queue.
It was not surprising that higher producing cows (producing >16.1 l milk/day) spent less time in the premilking yard and took less time to come back to the dairy from pasture than lower production cows. Increases in nutrient intake, particularly energy, have been linked to increases in milk production (Kolver and Muller, Reference Kolver and Muller1998; Bargo et al., Reference Bargo, Muller, Delahoy and Cassidy2002). Therefore the more efficient cow traffic observed from higher producing cows could be related to a greater motivation to find new feed sources to satisfy their intake requirements.
An interaction between return time and lactation group (parity) demonstrated that in almost all cases return time increased as lactation group increased. In particular, heifers (Lactation Group 1) had shorter return times than cows in all other lactation groups, with the exception of Group 5 when returning from the JOINT NIGHT allocation. This supports literature suggesting that heifers traffic more readily within AMS, with heifers being reported to have more frequent non-milking visits to an AMS (Ketelaar-de Lauwere et al., Reference Ketelaar-de Lauwere, Hendriks, Zondag, Ipema, Metz and Noordhuizen2000a), more readily learn the traffic patterns required in AMS (Jago and Kerrisk, Reference Jago and Kerrisk2011) and spend less time in the premilking yard before milking (Scott et al., Reference Scott, Kerrisk, Thomson, Lyons and Garcia2014). It is not clear, however, as to whether such trends in heifers’ behaviour are related to age and maturity, social hierarchy, energy demand due to growth or behavioural differences.
Conclusion
The prospect of accessing soybean at pasture did not reduce voluntary waiting time or impact on cow traffic throughout the farm system, with similar traffic observed between treatments. However there was also no adverse effect on cow traffic when soybean was incorporated, suggesting that the integration of grazeable forage crops into pasture-based AMS is feasible. This is encouraging as forage crops offer producers the benefits of significantly increasing the volume of forage produced in a given area as well as reduce the walking distance if the cropped area is close to the dairy, which may result in improved milking frequencies. The study reported here was focussed on the impact of a forage crop offered after milking on cow traffic through the dairy facility (and also to the paddock allocation); however, investigations into whether forage crops can improve cow traffic with shorter walking distances, as well as how different forage crops may impact on cow traffic exiting the allocation (without fetching), are also needed. Queue length was identified to significantly impact premilking waiting times, where more than 10 cows (equivalent to 7 cows/100 m2) caused a negative effect on time spent in the premilking area in the present study. Results suggest that investigation into reducing queue length, such as through drafting cows returning to the dairy to a small loafing or feeding area adjacent to the dairy facility if queue length exceeds a targeted length, are also warranted.
Acknowledgements
This work was funded by the investors of the FutureDairy project, Dairy Australia, NSW Department of Primary Industries, DeLaval and The University of Sydney. The authors thank the Dairy Research Foundation for its support of the Dairy Science Group at The University of Sydney. The authors acknowledge and thank Dr Ajantha Horadagoda and Dr Ravneet Jhajj (Dairy Science Group, The University of Sydney, Camden, NSW, Australia) for their contribution to the planting and monitoring of the Soybean crop, and Professor Peter Thomson (ReproGen – Animal Bioscience Group, The University of Sydney, Camden, NSW, Australia) for his statistical advice and guidance. The authors also wish to acknowledge the technical assistance and contributions from the FutureDairy team (Camden, NSW, Australia).