Malnutrition, in all its forms – including undernutrition (wasting, stunting, underweight and micronutrient deficiencies) and overnutrition (overweight, obesity, diet-related non-communicable diseases such as type 2 diabetes, hypertension and CVD) – are among the leading causes of health problems worldwide(Reference Popkin, Corvalan and Grummer-Strawn1,Reference Swinburn, Kraak and Allender2) . Both undernutrition and overnutrition can have long-term health implications, especially when they developed early in life(Reference Wells, Sawaya and Wibaek3). Evidences show that these conditions are not mutually exclusive; on the contrary, they can reinforce each other, increasing the risk of non-communicable diseases(Reference Wells, Sawaya and Wibaek3–Reference Grey, Gonzales and Abera5). This coexistence, known as the double burden of malnutrition (DBM), is particularly prevalent in low- and middle-income countries(Reference Popkin, Corvalan and Grummer-Strawn1,Reference Swinburn, Kraak and Allender2,Reference Shrimpton and Rokx6) .
Several longitudinal studies have been carried out, demonstrating the maintenance or increase in the prevalence of overweight and obesity in schoolchildren from different countries(Reference Bel-Serrat, Heinen and Mehegan7–Reference Rudolf, Sahota and Barth11), as well as their repercussions in adult life(Reference Simmonds, Llewellyn and Owen12). At the same time, the prevalence of stunting – considered the main form of undernutrition – has shown a slow but steady decline(13). These trends highlight the growing complexity of DBM, where excess weight and undernutrition coexist, often within the same populations, and sometimes even within the same individuals(Reference Popkin, Corvalan and Grummer-Strawn1).
In this context, anthropometric indicators such as height, weight and BMI are essential tools for monitoring growth and weight status in childhood and adolescence(Reference Oliveira, Pereira and Melo14). Height reflects linear growth and is particularly sensitive to detect undernutrition, while BMI, despite its limitations as a proxy for adiposity, is widely used to screen for overweight and obesity and to assess associated health risks across the life course(Reference Oliveira, Pereira and Melo14–Reference Venn, Thomson and Schmidt21). Monitoring these indicators over time allows for a better understanding of growth patterns and the identification of deviations that may signal nutritional risk(Reference Oliveira, Pereira and Melo14).
In this way, cohort studies conducted in school settings are particularly valuable, as they allow for the systematic and repeated collection of anthropometric data in large populations. This approach enables a more nuanced understanding of growth trajectories and trends in weight status during critical stages of development. Such evidence is essential for informing us of timely, targeted and effective public health interventions. However, despite the importance of longitudinal monitoring, especially in school-based settings, relatively few studies have explored how these indicators evolve throughout childhood and adolescence(Reference Gray, Buro and Barrera Ikan22).
Therefore, the objective of the present study was to analyse and describe the trends in height and BMI among school-age children and adolescents, from 2013 to 2020, and to identify patterns in the trajectories of weight status over time.
Methods
Study design and population
Data were drawn from a cohort study, conducted using secondary data consolidated by the Eu Cresci! E Agora? (I Grew Up! – What Now?) – Epidemiological Investigation and Surveillance in Schoolchildren study, carried out in accordance with the STROBE guidelines(Reference von Elm, Altman and Egger23). Anthropometric measurements were originally collected through Component I of the School Health Program and reported to SISVAN (Brazil’s Food and Nutritional Surveillance System) as part of routine activities aimed at monitoring the weight status of the population and supporting health promotion initiatives within the Brazilian Unified Health System (SUS).
I Grew Up! – What Now? consolidated these routinely collected anthropometric data into a population-based information system designed to enhance assessment, surveillance and health promotion efforts in the municipal schools of Santana de Parnaíba, São Paulo, Brazil. This study compiled data from 41 477 individuals enrolled in forty-seven municipal public schools, which included early childhood education centers, elementary schools, high schools and Youth and Adult Education programs. All data were provided by the Municipal Department of Education through a formal data-sharing agreement. The I Grew Up! – What Now? study was conducted in accordance with the Declaration of Helsinki and Brazilian Resolution CNS 466/12, with approval from the Ethics Committee of the Federal University of São Paulo (CAAE: 62073316.1.0000.5505). Further details regarding the study protocols and ethical approval are documented in previous studies.
In Brazil, municipalities are responsible for carrying out nutritional status monitoring. The federal government supports these activities by providing documents on anthropometry and food and nutrition surveillance and by funding food and nutrition actions. Thus, the quality of anthropometric data depends largely on municipal management.
In the ‘Eu Cresci! E Agora?’ (I Grew Up! – What Now?) project, annual training was conducted for professionals on how to collect anthropometric data in schools, as well as periodic monitoring of the reliability and objectivity of the measurements obtained by each professional responsible for data collection. Furthermore, during the database configuration phase, special attention was paid to excluding implausible data.
Anthropometric (height and weight) and demographic (sex and date of birth) data were collected by trained professionals following a standardised protocol to ensure measurement accuracy and data quality. Sex was recorded as male or female based on the designation at birth. For anthropometric assessments, all individuals were measured without personal items that could interfere with the accuracy of the measurements, as standardised by the WHO(Reference Jelliffe24). Weight was recorded using a Seca® digital electronic scale (capacity of 150 kg, precision of 0·1 kg), and height was measured with a Seca® stadiometer (precision of 1 mm). BMI was calculated by dividing body mass (kg) by the square of height (m).
Data processing and statistical analysis
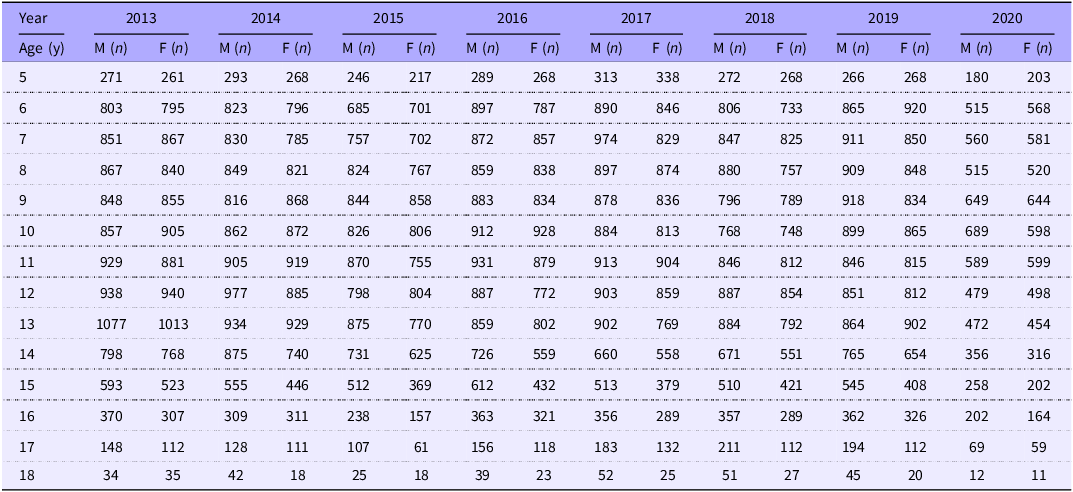
In the selection process, 138 437 data points from 41 325 participants aged 5–18 years were initially considered. Exclusions were made based on the following criteria: data inconsistencies, such as weight exceeding 300 kg (the maximum scale capacity) and height ≥ 250 cm (obs = 37); implausible values, defined as height-for-age Z-scores below −6 standard deviations (sd) or above +6 sd and BMI-for-age Z-scores below −5 sd or above +5 sd, based on WHO reference values (obs. = 213) and measurement errors, such as discrepancies in height trajectory (e.g. a significant increase of more than 0·5 cm followed by a decrease or a decrease in height of more than 0·5 cm) (n 4714), remaining 41 283 participants and 133 473 data points in the sample, with no imputation performed for missing data. For the trajectory analysis, a subsample of 11 535 children (69 048 observations) was selected, based on the criterion of having at least five valid BMI measurements recorded between 2013 and 2020. The selection process is shown in Figure 1, and Table 1 summarises the characteristics of the study population, including the distribution of participants by age, sex and year of assessment.
Flow chart of participant selection. n, number of participants; obs, Observations.

Characteristics of the study population by age, sex, and year of assessment

Table 1 Long description
A table showing sample sizes (number of participants, n) broken down by age (rows, 5 to 18 years), year (columns, 2013 to 2020), and sex (M for male, F for female, each with its own sub-column). Sample sizes generally peak in the pre-teen to early-teen ages (around 10 to 13 years), where counts often exceed 800 to 1000 per group, and decline sharply at the older ages, dropping to double or single digits by age 18. The 2020 column shows generally lower counts across most ages compared to earlier years, consistent with reduced sample sizes that year.
y, years; M, male; F, female.
Descriptive statistics were initially calculated to summarise the sample characteristics, including mean height and BMI by sex and age for each year of assessment. Participants’ height status (normal height and stunting) and weight status (underweight, normal weight, overweight and obesity) were classified according to the MULT growth reference(Reference de Oliveira, Araújo and Ramos25,Reference de Oliveira, Araújo and Severo26) for three age intervals: 5 to < 10 years, 10 to < 15 years and 15 to ≤ 18 years. To compare the sample’s height and BMI with the MULT reference values, boxplots of the z-scores were generated by sex.
Next, to estimate trends in height and BMI between 2013 and 2020, linear mixed-effects models(Reference Bates, Mächler and Bolker27) were constructed to examine changes over time for male and female participants. The models were designed to predict mean height and BMI by age and sex, with the year of assessment, and their age (years) included as fixed effects to capture temporal trends. Additionally, a random intercept for each age (in years) was included to account for variations across different ages. Both models were fitted using the lmer() function from the lme4 package in R(Reference Bates28), which allows the inclusion of random effects to control for between-group variability while assessing the fixed effect of time. Sex-specific graphs were plotted to show trends in height and BMI by age and year of assessment.
Finally, to evaluate weight status trajectories, analysis was conducted on the subsample of 11 535 participants who had at least five BMI assessments during the study period. In total, 69 048 BMI observations were available for trajectory modelling. Participants contributed a mean of 5·99 BMI assessments (sd = 0·94), with an average follow-up span of 5·40 years (sd = 1·04), indicating high temporal density for sequence and clustering analysis. Their weight status trajectories were estimated using sequence analysis and hierarchical clustering. This method accounts for variations in timing and duration and handles incomplete data, as some participants were assessed at different ages(Reference Gabadinho, Ritschard and Müller29). In this way, each participants’ weight status was transformed into discrete states using the seqdef() function from the TraMineR(Reference Gabadinho, Ritschard and Müller29) package. To measure dissimilarity between trajectories, Optimal Matching(Reference Abbott and Forrest30,Reference Maechler, Rousseeuw and Struyf31) was applied, with the INDELS method generating a substitution matrix to account for insertions and deletions. Pairwise distances were calculated using the OMslen(Reference Maechler, Rousseeuw and Struyf31) method, which incorporates sequence length to accurately reflect the timing and duration of transitions between states. Hierarchical clustering, using Ward’s method, was applied to the dissimilarity matrix to identify distinct clusters(Reference Ward32). The optimal number of clusters was determined using the elbow method and inertia plot(Reference MacQueen, Le Cam and Neyman33,Reference Thorndike34) , which identifies the point at which adding more clusters no longer significantly reduces the sum of squared errors, reflecting cluster compactness. Although follow-up intervals varied slightly across participants, the high temporal density and relatively low variability in the number of assessments make it unlikely that uneven spacing substantially influenced cluster classification. All statistical analyses were performed using R software(35), version 4.4.1 for Windows.
Results
The sample included 41 283 children and adolescents (51·0 % male). On average, 17 502 participants were assessed annually between 2013 and 2019, with a decrease to 10 962 participants in 2020 due to the COVID-19 pandemic. It is not possible to determine how much this reduction impacted the trends of the analysed variables due to selection bias, from the non-inclusion of participants who systematically differed from those included in the analysis. Mean and sd values for height and BMI by sex, age and year are presented in online Supplementary eTable 1 and eTable 2.
Height
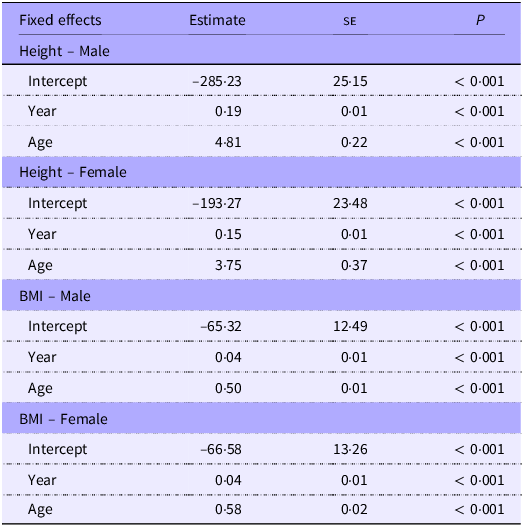
The mixed-effects models for height revealed a significant but modest annual increase over the years of assessment (2013–2020), with male participants showing an increase of 0·19 cm and female participants showing an increase of 0·15 cm. The models also indicated a positive trend according to age in both sexes, with males increasing by 4·81 cm and females by 3·75 cm, as expected (Table 2, Figure 2). Despite these trends, the magnitude of growth was insufficient to align the cohort with the MULT growth reference.
Estimates for height (cm) and BMI (kg/m2) among male and female participants per age and year of assessment (n 41 283)

Table 2 Long description
The table presents estimates for height and BMI among male and female participants, organized into four sections: Height - Male, Height - Female, BMI - Male, and BMI - Female. Each section includes rows for Intercept, Year, and Age, with corresponding Estimate, SE, and P values. For Height - Male, the Intercept is -285.23, Year is 0.19, and Age is 4.81. For Height - Female, the Intercept is -193.27, Year is 0.15, and Age is 3.75. For BMI - Male, the Intercept is -65.32, Year is 0.04, and Age is 0.50. For BMI - Female, the Intercept is -66.58, Year is 0.04, and Age is 0.58. All P values are less than 0.001, indicating significant trends.
Estimates derived from linear mixed effects models.
Trends in height (cm) and BMI (kg/m2) for male and female participants per age and year of assessment estimated from linear mixed-effects models.

Figure 2 Long description
Panel A: A line graph shows the height in centimeters for male participants aged 5 to 18 years from 2013 to 2020. The x-axis represents the year, and the y-axis represents height in centimeters. Each line represents a different age group, with heights generally increasing with age. Panel B: A line graph shows the height in centimeters for female participants aged 5 to 18 years from 2013 to 2020. The x-axis represents the year, and the y-axis represents height in centimeters. Each line represents a different age group, with heights generally increasing with age. Panel C: A line graph shows the BMI in kilograms per square meter for male participants aged 5 to 18 years from 2013 to 2020. The x-axis represents the year, and the y-axis represents BMI in kilograms per square meter. Each line represents a different age group, with BMI generally increasing with age. Panel D: A line graph shows the BMI in kilograms per square meter for female participants aged 5 to 18 years from 2013 to 2020. The x-axis represents the year, and the y-axis represents BMI in kilograms per square meter. Each line represents a different age group, with BMI generally increasing with age.
While height increased with age, the median height per age consistently remained below the MULT growth reference. For male participants, at age 9, the median height z-score of the sample dropped below the MULT reference median and remained low through age 18 (online Supplementary eFigure 1). For female participants, this pattern started later, at age 13. Among male participants, the highest prevalence of stunting was found in the 10–15 (5·1 %) and 15–18 (4·9 %) years age groups (online Supplementary eTable 3). Whereas among female participants, stunting was only observed in the 15–18 age group (6·2 %).
BMI
With regard to BMI, an increasing trend of 0·04 kg/m2 across the years was also found in both sexes. Furthermore, an increase in BMI according to age was observed in both male (0·50 kg/m2) and female (0·58 kg/m2) participants (Table 2, Figure 2). For both male and female participants and across all ages, the sample medians of BMI Z-scores were higher than the MULT reference median (online Supplementary eFigure 2).
The prevalence of underweight was 1 % or lower across all age groups for both sexes. The highest prevalence of overweight was found in the 10–15 years age group for both males (20·7 %) and females (22·2 %). Regarding obesity, the highest prevalence was observed in the 5–10 years age group for both males (12·6 %) and females (12·8 %) (online Supplementary eTable 4).
Weight status trajectories
In the analysis of weight status trajectories, 11 535 participants were included. Based on the elbow method and the inertia plot, the optimal number of clusters determined was three for both male and female participants (online Supplementary eFigure 3). Figures 3 and 4 display the three identified weight status trajectories for male and female participants, respectively. The patterns observed in both sexes are quite similar. The first cluster, consistently normal weight, includes 63·7 % of male participants (Figure 3) and 64·5 % of female participants (Figure 4). Individuals in this cluster maintain a normal weight throughout most of their childhood and adolescence, with only a small proportion experiencing transitions to other BMI categories. The second cluster, increasing overweight, comprises 21·8 % of male participants and 20·7 % of female participants. In this trajectory, a significant number of individuals initially classified as normal weight progressively transition to overweight, with some also moving into the obesity category during adolescence. The third cluster, increasing obesity, represents 14·5 % of males and 14·8 % of females. This group is characterised by a high prevalence of obesity from early childhood, with an increasing proportion of individuals classified as obese as they grow older.
Clustering of male participants into three distinct patterns based on their weight status trajectories during childhood and adolescence. n, number of participants; Rel. Freq, relative frequency.

Figure 3 Long description
Panel 1: The histogram shows the relative frequency of participants with consistently normal weight. The x-axis represents age from 5 to 17 years, and the y-axis represents relative frequency from 0 to 1. The data is categorized into underweight, normal weight, overweight, and obesity, with normal weight being the predominant category. Panel 2: The histogram illustrates the relative frequency of participants with increasing overweight. The x-axis represents age from 5 to 17 years, and the y-axis represents relative frequency from 0 to 1. The data shows a shift from normal weight to overweight and obesity as age increases. Panel 3: The histogram depicts the relative frequency of participants with increasing obesity. The x-axis represents age from 5 to 17 years, and the y-axis represents relative frequency from 0 to 1. The data indicates a significant increase in obesity with age, with obesity becoming the predominant category.
Clustering of female participants into three distinct patterns based on their weight status trajectories during childhood and adolescence. n, number of participants; Rel. Freq, relative frequency.

Figure 4 Long description
Three histograms depict weight status trajectories of participants. Panel 1: Consistently normal weight. The histogram shows relative frequency on the vertical axis and age on the horizontal axis. The data is predominantly in the normal weight category, with smaller proportions in underweight and overweight categories. Panel 2: Increasing overweight. The histogram shows relative frequency on the vertical axis and age on the horizontal axis. The data shows a shift from normal weight to overweight and obesity categories as age increases. Panel 3: Increasing obesity. The histogram shows relative frequency on the vertical axis and age on the horizontal axis. The data shows a significant increase in the obesity category as age increases.
Discussion
Among a cohort of children and adolescents from a metropolitan region of Brazil, this study described population trends in height and BMI from 2013 to 2020, as well as weight status trajectories from age 5 to 18 years. Findings demonstrated a small but statistically significant annual increase in height (0·15–0·19 cm per year); however, this upward trend was insufficient to reduce the persistent gap relative to the MULT growth reference. This pattern emerged at different ages for boys and girls. Boys began to show height values below reference levels around age 9, whereas girls exhibited this pattern starting around age 13. These observations are reflected in the prevalence of stunting, which increased with age in both sexes. Among males, stunting prevalence rose from the 5 to 10 age group to those aged 10–15 years. Similarly, for females, the highest prevalence of stunting was observed in late adolescence. These findings indicate that greater gains in height are required to close the gap with expected values for age, particularly during the transition into adolescence. At the same time, the findings also indicated increasing trends in BMI, with more weight gain and a higher prevalence of overweight and obesity from childhood through adolescence. This pattern was observed similarly among both male and female children and adolescents.
Taken together and in line with previous research(Reference Mohamed and Pallan9–Reference Rudolf, Sahota and Barth11,Reference Deshmukh-Taskar, Nicklas and Morales15) , our results highlight the presence of the DBM in Brazil, an emerging economy. This is particularly worrying given the well-established association between childhood stunting and developmental delay, which can negatively impact educational attainment and long-term economic productivity(Reference Dewey and Begum36). Conversely, overweight and obesity during childhood and adolescence are associated with increased risks of non-communicable diseases, including diabetes, CVD and cancer(Reference Llewellyn, Simmonds and Owen37). These results highlight the benefits of public health surveillance programs that monitor child growth trajectories, and specifically height and weight over time, allowing for the identification of trends at a population level and the early detection of the DBM. However, to more accurately identify population-level trends in height and prevalence rates of stunting, it is essential that monitoring begins in early childhood, possibly reaching children through daycare centres and/or preschools, and continues throughout childhood and adolescents. This is important because childhood stunting most commonly occurs during early childhood and, therefore, may not be recorded in school-based public health monitoring programs(38).
Given that both stunting and overweight/obesity during childhood and adolescence are associated with an increased risk of health complications later in life(Reference Wells, Sawaya and Wibaek3,Reference Black, Victora and Walker39,Reference Han, Mulla and Beyene40) and that children’s dietary patterns often mirror their parents’ dietary patterns(Reference Birch and Fisher41,Reference Savage, Fisher and Birch42) , there is an urgent need for family-level interventions aimed at promoting healthy weight. Such strategies should focus on the parents of young children, ideally before nutritional imbalances become evident, typically before the age of five. Early childhood is a sensitive period for development(43,Reference Wethington44) , and nutritional inadequacies during this stage can have lasting effects on growth, cognitive development and overall health(38).
Moreover, stunting and overweight/obesity may coexist within the same individual (i.e. the double burden at the individual level), and certainly within the same population, interventions should target the double burden at both the population and individual levels. Evidence-based strategies may include initiatives to improve diet quality, such as targeted supplementation programs, promoting an environment conducive to healthy eating and engaging in physical activity. Health behaviours acquired in early childhood have the potential to have lasting influences on health patterns adopted during adolescence and adulthood(Reference Guyer, Ma and Grason45). In this context, involving children in food selection and preparation, as well as encouraging family meals, contributes not only to strengthening emotional bonds but also to the formation of healthy eating habits. Furthermore, policies should incorporate the systematic promotion of physical activity as a central component of comprehensive public health strategies.
This study has several strengths, including its large sample size, with an average of 17 502 children and adolescents aged 5–18 years assessed annually from 2013 to 2019, which corresponds to approximately 61 % of the city’s youth population based on data from the 2010 census by the Brazilian Institute of Geography and Statistics (IBGE)(46). In addition, the city is home to seventy-two public schools, seventy of which are municipal(47). This study included schools representing over 65 % of the city’s public schools. The large dataset increases the statistical power of the results(Reference Cohen48) and the longitudinal design (2013–2020) allowed for the examination of trends over time. Thus, the extensive follow-up period, starting in childhood and extending into adolescence, was critical to understanding trajectories of weight status throughout adolescence, providing valuable insights into changes in height and BMI. Furthermore, the use of mixed-effects models(Reference Bates, Mächler and Bolker27) to analyse trends in height and BMI, combined with sequence analysis and hierarchical clustering(Reference Ward32) to identify weight status trajectories, strengthens the robustness of the analysis. These methods(Reference Bates, Mächler and Bolker27,Reference Gabadinho, Ritschard and Müller29,Reference Ward32) are well suited to handle the complexity of the data, accounting for both individual variability and time-dependent changes. Furthermore, by focusing on stunting, BMI and weight status trajectories, the study provides critical insights into windows of vulnerability and opportunities for intervention. These findings contribute to the evidence base needed for the development of targeted and effective public programs.
Despite the robust analysis and the large sample size, some limitations should be notes. This study was conducted in a single metropolitan area in Brazil, which may limit the generalisability of the findings to populations with different living standards that are more affected by the DBM. Additionally, measurement errors are inherent in the collection of anthropometric data and may introduce bias(Reference Coggon, Rose and Barker49,Reference Critchley50) . However, data were collected from trained staff, and we were diligent in excluding measurement errors, implausible values and data inconsistencies, which represented only 3·6 % of the sample. A third limitation was the exclusion of participants aged 5–18 years who had fewer than five assessments in the trajectory analysis. This exclusion may have introduced selection bias(Reference Coggon, Rose and Barker49,Reference Critchley50) , as it may have resulted in a non-representative sample if the excluded participants differed systematically from those included in the analysis. This limitation may also have occurred in relation to the reduction in sample size in 2020, due to the COVID-19 pandemic.
In summary, these findings highlight a worrying trend: the early onset of nutritional deviations and the presence of DBM in a large sample of children and adolescents from a Brazilian municipality in the state of São Paulo. Although extrapolation of these results deserves reservations, they highlight the need for ongoing health surveillance in school settings and the implementation of timely and targeted interventions to promote healthy growth trajectories and reduce future health risks associated with DBM.
Supplementary material
For supplementary material/s referred to in this article, please visit https://doi.org/10.1017/S000711452610703X
Acknowledgements
We are grateful to teachers Dení Domingos da Silva, André Zappa and their team for their invaluable collaboration in the data collection process, which was crucial to this study.
No funding was secured for this study.
Conceptualisation: E. P. V., M. S. S. V., R. F. C., M. H. O., I. K. S. S.; Data curation: E. P. V., M. S. S. V.; Formal analysis: R. F. C., M. H. O., I. K. S. S.; Investigation: E. P. V., M. S. S. V., R. F. C., M. H. O., I. K. S. S.; Methodology: E. P. V., R. F. C., M. H. O., I. K. S. S.; Project administration: E. P. V., M. S. S. V.; Resources: E. P. V., M. S. S. V.; Writing – original draft: E. P. V., R. F. C., M. H. O., I. K. S. S., N. G.; Writing – review & editing: E. P. V., M. S. S. V., R. F. C.
The authors have no conflicts of interest relevant to this article to disclose.