1. Introduction
Transport phenomena are ubiquitous in nature and involve the redistribution of physical quantities such as mass, charge, linear and angular momentum and energy, etc. Different mechanisms are at work in the transport processes, ranging from diffusion to advection and mixing in the case of turbulent or chaotic motions. Recently a new concept in the study of transport processes in complex fluid flows was introduced by Peacock & Haller (Reference Peacock and Haller2013): Lagrangian coherent structures (LCS). In a two-dimensional (2D) configuration, these structures are special lines advected by the fluid which organize the flow transport processes by attracting or repelling the nearby fluid elements over a finite time span. (In the most general system, the LCS are surfaces advected by the flow, but here for the sake of simplicity we will only deal with two-dimensional systems.) Strictly speaking, we should call these structures hyperbolic LCS. Two other kinds of LCS have been introduced in the literature. For the definition of all the different kinds of LCS, we indicate the recent review by Haller (Reference Haller2015). For the sake of simplicity, we will refer to these structures simply as LCS. These special lines organize the flow, splitting the domain into macro-regions with fast mixing phenomena inside them. Over the finite time span that characterizes the LCS, these macro-regions do not exchange fluid elements. The LCS have been widely used in the literature to characterize transport processes in various systems: pollutant transport on the ocean surface (Coulliette et al. Reference Coulliette, Lekien, Paduan, Haller and Marsden2007), blood flow (Shadden & Taylor Reference Shadden and Taylor2008), the spreading of plankton blooms (Huhn et al. Reference Huhn, Kameke, Pérez-Muñuzuri, Olascoaga and Beron-Vera2012), turbulent combustion (Hamlington, Poludnenko & Oran Reference Hamlington, Poludnenko and Oran2011), jellyfish predator–prey interaction (Peng & Dabiri Reference Peng and Dabiri2009), atmospheric dataset analysis (Tang et al. Reference Tang, Mathur, Haller, Hahn and Ruggiero2010), solar photospheric flows (Chian et al. Reference Chian, Rempel, Aulanier, Schmieder, Shadden, Welsch and Yeates2014), saturation of a nonlinear dynamo (Rempel et al. Reference Rempel, Chian, Brandenburg, Muñoz and Shadden2013), etc.
Plasmas are often studied using ‘fluid’ theories either in phase space, such as the Vlasov–Maxwell system, or in physical space, such as the two-fluid and the magnetohydrodynamic (MHD) systems. The LCS techniques can therefore be applied to study transport processes, i.e. the mixing of fluid elements, in these systems. In Carlevaro et al. (Reference Carlevaro, Falessi, Montani and Zonca2015) the LCS has been used to quantify the phase-space transport due to the interactions between two supra-thermal electron beams and a cold, homogeneous, background plasma. In two recent works (Borgogno et al. Reference Borgogno, Grasso, Pegoraro and Schep2011a ,Reference Borgogno, Grasso, Pegoraro and Schep b ) it was shown how the LCS can provide information about the electron transport due to the stochastization of the magnetic field in a collisionless reconnection process.
The introduction of these techniques is relatively recent and, in spite of their increasing use, their rigorous definition has been subject to debate (Shadden, Lekien & Marsden Reference Shadden, Lekien and Marsden2005; Haller Reference Haller2011). The first definitions of an LCS were based on the finite-time Lyapunov exponent (FTLE) profile. These have been shown to be incorrect by Haller, who found several counterexamples to this heuristic definition. The rigorous definition of an LCS as the most repulsive or attractive material line with respect to the nearby ones was introduced by Haller (Reference Haller2011). In this article we present a simplified version of this derivation in order to provide the reader with some physical intuition about these structures, we analytically calculate the shape of the LCS in a simple Hamiltonian system and, finally, we compare the LCS obtained by Borgogno et al. (Reference Borgogno, Grasso, Pegoraro and Schep2011a ) using the FTLE method with those obtained with the rigorous definition introduced. The numerical framework used to compute the LCS shape was developed by Onu, Huhn & Haller (Reference Onu, Huhn and Haller2015).
2. Lagrangian coherent structures and transport barriers
2.1. Lagrangian coherent structures as most repelling material lines
Following Haller (Reference Haller2011), in this section we briefly review some mathematical concepts that lead to the definition of LCS.
We consider a dynamical system in 2D phase space
 $\boldsymbol{x}=(x,y)$
,
 $$\begin{eqnarray}\frac{\text{d}x}{\text{d}t}=v_{x}(t,x,y),\quad \frac{\text{d}y}{\text{d}t}=v_{y}(t,x,y),\end{eqnarray}$$
with continuous differentiable flow map
 $$\begin{eqnarray}{\bf\phi}_{t_{0}}^{t}(\boldsymbol{x}_{0})=\boldsymbol{x}(t,t_{0},\boldsymbol{x}_{0}).\end{eqnarray}$$
Two neighbouring points
 $\boldsymbol{x}_{0}$
and
 $\boldsymbol{x}_{0}+{\it\delta}\boldsymbol{x}_{0}$
evolve into the points
 $\boldsymbol{x}$
and
 $\boldsymbol{x}+{\it\delta}\boldsymbol{x}$
under the linearized map
 $$\begin{eqnarray}|{\it\delta}x\rangle =\boldsymbol{{\rm\nabla}}{\bf\phi}_{t_{0}}^{t}|{\it\delta}x_{0}\rangle ,\end{eqnarray}$$
where, for notational convenience, we adopt a bra–ket notation for vectors and scalar products and represent a generic column vector as
 $|\boldsymbol{c}\rangle$
and a row vector as
 $\langle \boldsymbol{r}|$
. Their scalar product is denoted as
 $d=\langle \boldsymbol{c}|\boldsymbol{r}\rangle$
.
Consider a curve
 ${\it\gamma}_{0}=\{\boldsymbol{x}_{0}=r(s)\}$
. At each point
 $\boldsymbol{x}_{0}\in {\it\gamma}_{0}$
, define the unit tangent vector
 $|\boldsymbol{e}_{0}\rangle$
and the normal vector
 $|\boldsymbol{n}_{0}\rangle$
. In the time interval
 $[t_{0},t]$
, the dynamics of the system advects the ‘material line’
 ${\it\gamma}_{0}$
into
 ${\it\gamma}_{t}$
and
 $\boldsymbol{x}_{0}\in {\it\gamma}_{0}$
into
 $\boldsymbol{x}_{t}\in {\it\gamma}_{t}$
. The linearized dynamics maps the tangent vector
 $|\boldsymbol{e}_{0}\rangle$
into
 $|\boldsymbol{e}_{t}\rangle$
, which is tangent to
 ${\it\gamma}_{t}$
,
 $$\begin{eqnarray}|\boldsymbol{e}_{t}\rangle =\frac{\boldsymbol{{\rm\nabla}}{\bf\phi}_{t_{0}}^{t}(\boldsymbol{x}_{0})|\boldsymbol{e}_{0}\rangle }{\sqrt{\langle \boldsymbol{ e}_{0}|(\boldsymbol{{\rm\nabla}}{\bf\phi}_{t_{0}}^{t})^{\text{T }}\boldsymbol{{\rm\nabla}}{\bf\phi}_{t_{0}}^{t}|\boldsymbol{ e}_{0}\rangle }}\equiv \frac{\boldsymbol{{\rm\nabla}}{\bf\phi}_{t_{0}}^{t}(\boldsymbol{x}_{0})|\boldsymbol{e}_{0}\rangle }{\sqrt{\langle \boldsymbol{ e}_{0}|\unicode[STIX]{x1D63E}_{t_{0}}^{t}(\boldsymbol{x}_{0})|\boldsymbol{ e}_{0}\rangle }},\end{eqnarray}$$
where
 $\unicode[STIX]{x1D63E}_{t_{0}}^{t}(\boldsymbol{x}_{0})\equiv (\boldsymbol{{\rm\nabla}}{\bf\phi}_{t_{0}}^{t})^{\text{T}}\boldsymbol{{\rm\nabla}}{\bf\phi}_{t_{0}}^{t}$
is the Cauchy–Green strain tensor and
 $^{\text{T}}$
stands for transpose. This symmetric tensor describes the deformation of an arbitrarily small circle of initial conditions, centred at
 $\boldsymbol{x}_{0}$
, caused by the flow in a time interval
 $[t_{0},t]$
. As an example, let us consider a circle centred at
 $\boldsymbol{x}_{0}$
with radius
 $\Vert {\it\delta}\boldsymbol{x}_{0}\Vert$
. After the time interval
 $[t_{0},t]$
, this will be deformed into an ellipse with major axis in the direction of
 $|{\bf\xi}_{max}\rangle$
and minor axis in the direction of
 $|{\bf\xi}_{min}\rangle$
, with
 $|{\bf\xi}_{max}\rangle$
and
 $|{\bf\xi}_{min}\rangle$
being the two eigenvectors of
 $\unicode[STIX]{x1D63E}_{t_{0}}^{t}(\boldsymbol{x}_{0})$
. The corresponding real and positive eigenvalues are
 ${\it\lambda}_{max}$
and
 ${\it\lambda}_{min}$
. The length of the major axis is
 ${\it\lambda}_{max}\Vert {\it\delta}\boldsymbol{x}_{0}\Vert$
, while the the length of the minor axis is
 ${\it\lambda}_{min}\Vert {\it\delta}\boldsymbol{x}_{0}\Vert$
. The curves with tangent vector along
 $|{\bf\xi}_{min}\rangle$
and, respectively,
 $|{\bf\xi}_{max}\rangle$
are called strain lines of the Cauchy–Green tensor. In general, the mapping will not preserve the angle between vectors and therefore usually
 $|\boldsymbol{n}_{t}\rangle$
differs from
 $\boldsymbol{{\rm\nabla}}{\bf\phi}_{t_{0}}^{t}|\boldsymbol{n}_{0}\rangle$
.
Using the condition
 $\langle \boldsymbol{n}_{0}|\boldsymbol{e}_{0}\rangle =\langle \boldsymbol{n}_{0}|\boldsymbol{{\rm\nabla}}{\bf\phi}_{t}^{t_{0}}\boldsymbol{{\rm\nabla}}{\bf\phi}_{t_{0}}^{t}|\boldsymbol{e}_{0}\rangle =0$
and inserting (2.4), we obtain the expression for
 $|\boldsymbol{n}_{t}\rangle$
, which is given by
 $$\begin{eqnarray}|\boldsymbol{n}_{t}\rangle =\frac{(\boldsymbol{{\rm\nabla}}{\bf\phi}_{t}^{t_{0}})^{\text{T}}|\boldsymbol{n}_{0}\rangle }{\sqrt{\langle \boldsymbol{ n}_{0}|\boldsymbol{{\rm\nabla}}{\bf\phi}_{t}^{t_{0}}(\boldsymbol{{\rm\nabla}}{\bf\phi}_{t}^{t_{0}})^{\text{T }}|\boldsymbol{ n}_{0}\rangle }}\equiv \frac{(\boldsymbol{{\rm\nabla}}{\bf\phi}_{t}^{t_{0}})^{\text{T}}|\boldsymbol{n}_{0}\rangle }{\sqrt{\langle \boldsymbol{ n}_{0}|\unicode[STIX]{x1D63E}^{-1}(\boldsymbol{x}_{0})|\boldsymbol{ n}_{0}\rangle }},\end{eqnarray}$$
where
 $\unicode[STIX]{x1D63E}^{-1}(\boldsymbol{x}_{0})=\unicode[STIX]{x1D63E}_{t}^{t_{0}}(\boldsymbol{x}_{0})$
and the time interval marks have been suppressed, as will be the case in the following formulae when not explicitly needed. We define the repulsion ratio
 ${\it\rho}_{t_{0}}^{t}(\boldsymbol{x}_{0},\boldsymbol{n}_{0})$
as the ratio at which material points, in other words points advected by the flow, initially taken near the point
 $\boldsymbol{x}_{0}\in {\it\gamma}_{0}$
, increase their distance from the curve in the time interval
 $[t_{0},t]$
:
 $$\begin{eqnarray}{\it\rho}_{t_{0}}^{t}(\boldsymbol{x}_{0},\boldsymbol{n}_{0})=\langle \boldsymbol{n}_{t}|\boldsymbol{{\rm\nabla}}{\bf\phi}_{t_{0}}^{t}(\boldsymbol{x}_{0})|\boldsymbol{n}_{0}\rangle .\end{eqnarray}$$
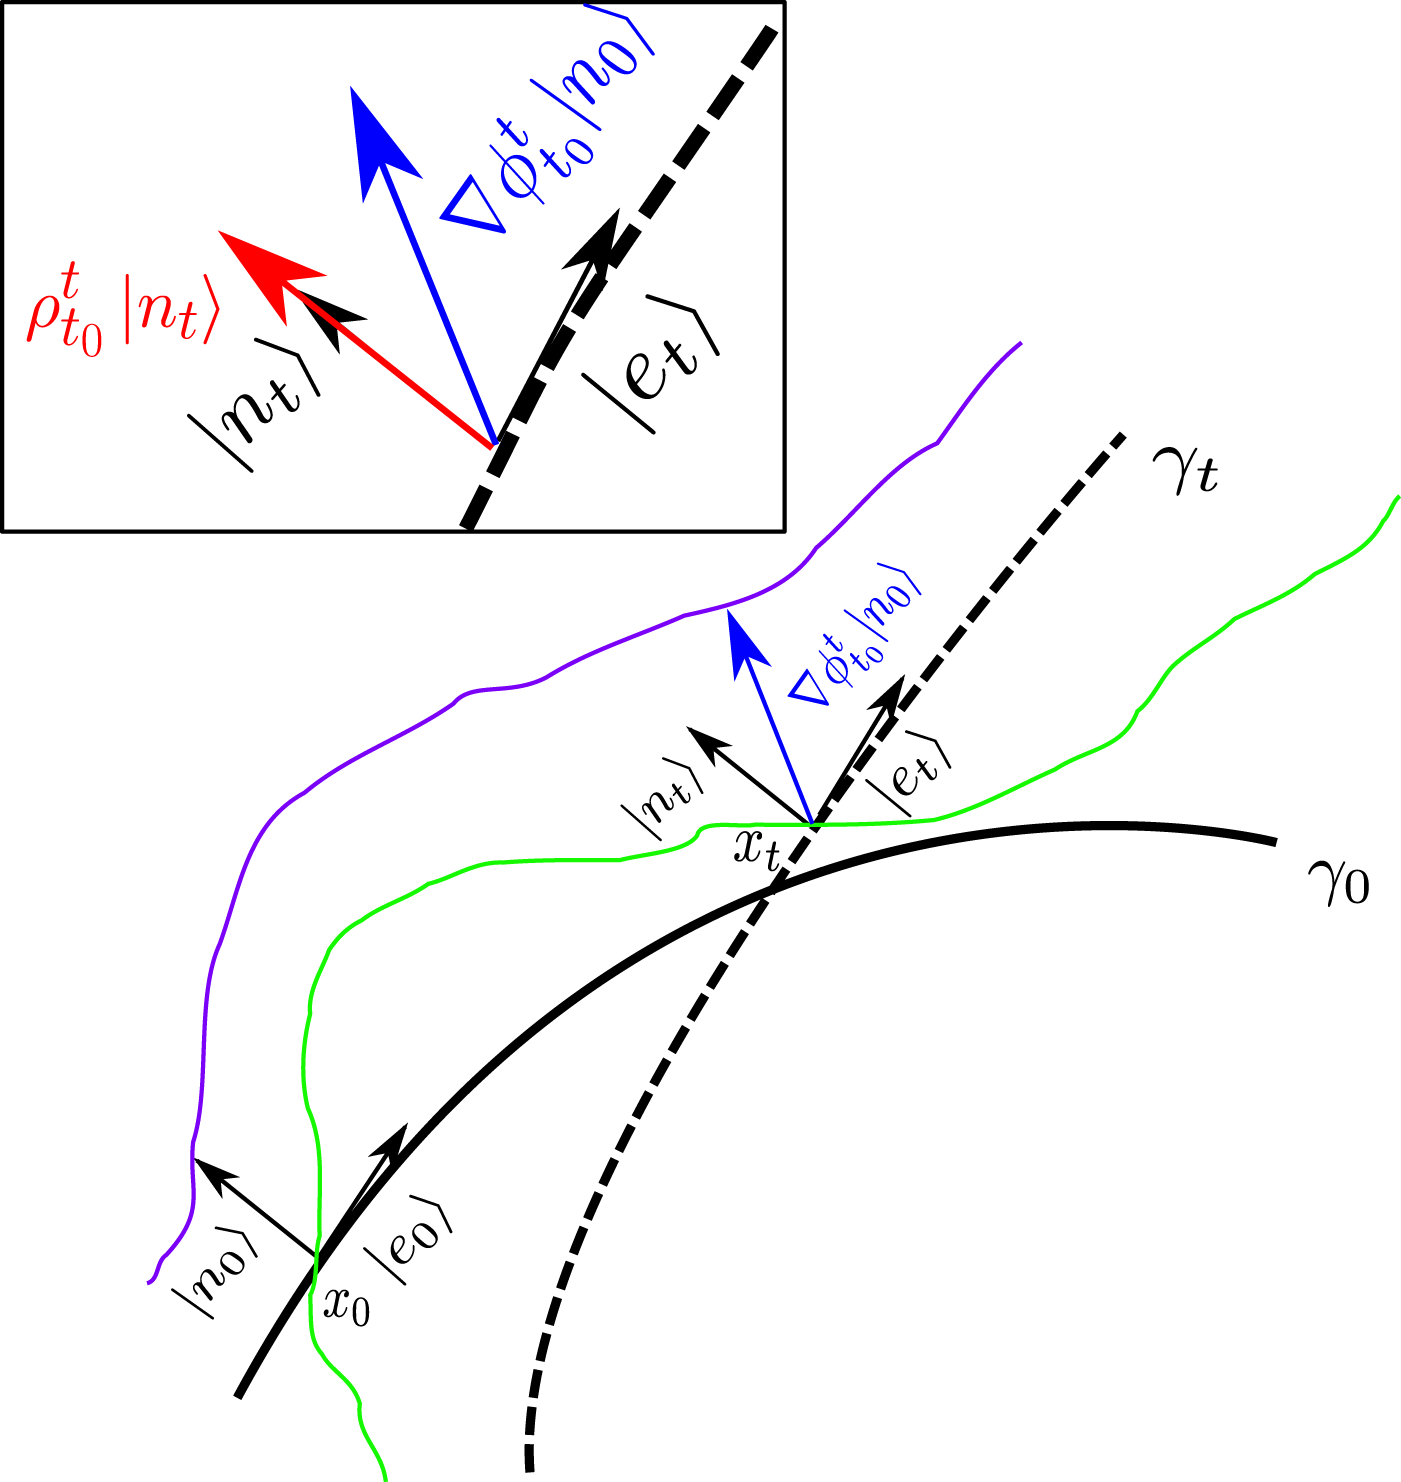
In order to understand this definition, we can imagine measuring the distance between
 $\boldsymbol{x}_{0}$
, taken on the curve
 ${\it\gamma}_{0}$
, and a point initially placed at unit distance from the curve. After a sufficiently small amount of time, this distance is measured by the projection of the vector
 $\boldsymbol{{\rm\nabla}}{\bf\phi}_{t_{0}}^{t}(\boldsymbol{x}_{0})|\boldsymbol{n}_{0}\rangle$
along
 $|\boldsymbol{n}_{t}\rangle$
as shown in figure 1. Using the previous definitions,
 ${\it\rho}_{t_{0}}^{t}(\boldsymbol{x}_{0},\boldsymbol{n}_{0})$
can be expressed in terms of either
 $\boldsymbol{n}_{0}$
or
 $\boldsymbol{n}_{t}$
as
 $$\begin{eqnarray}{\it\rho}_{t_{0}}^{t}(\boldsymbol{x}_{0},\boldsymbol{n}_{0})=\frac{1}{\sqrt{\langle \boldsymbol{n}_{0}|\unicode[STIX]{x1D63E}^{-1}(\boldsymbol{x}_{0})|\boldsymbol{n}_{0}\rangle }}=\sqrt{\langle \boldsymbol{n}_{t}|\unicode[STIX]{x1D63E}(\boldsymbol{x}_{0})|\boldsymbol{n}_{t}\rangle }.\end{eqnarray}$$
Similarly, the contraction rate
 $L_{t_{0}}^{t}(\boldsymbol{x}_{0})$
is proportional to the growth in time of the vector tangent to the material line:
 $$\begin{eqnarray}L(\boldsymbol{x}_{0},\boldsymbol{e}_{0})=\sqrt{\langle \boldsymbol{e}_{0}|\unicode[STIX]{x1D63E}(\boldsymbol{x}_{0})|\boldsymbol{e}_{0}\rangle }.\end{eqnarray}$$
The aim in these definitions is to characterize an LCS over a finite time interval
 $[t_{0},t_{0}+T]$
as a material line, in other words, a curve advected by the flow, which is locally the strongest repelling or attracting curve with respect to the nearby ones. This leads, as shown by Haller (Reference Haller2011), to the following definitions.
Definition 1. A material line satisfying the following conditions at each point:
-
(i)
(2.9) $$\begin{eqnarray}{\it\lambda}_{min}<{\it\lambda}_{max},\quad {\it\lambda}_{max}>1,\end{eqnarray}$$
-
(ii) the tangent vector is along the eigenvector associated with the smallest eigenvalue
(2.10)
$$\begin{eqnarray}|\boldsymbol{e}_{0}\rangle =|{\bf\xi}_{min}\rangle ,\end{eqnarray}$$
-
(iii) the gradient of the largest eigenvalue is along the curve
(2.11)
$$\begin{eqnarray}\langle {\bf\xi}_{max}|\boldsymbol{{\rm\nabla}}{\it\lambda}_{max}\rangle =0,\end{eqnarray}$$


is called a weak Lagrangian coherent structure (WLCS).
The green line and the purple line represent two trajectories. The continuous thick black line is the curve
 ${\it\gamma}_{0}$
, while the dashed one is its evolution
 ${\it\gamma}_{t}$
at time
 $t$
. We have marked in blue the evolution of
 $|\boldsymbol{n}_{0}\rangle$
through the linearized dynamics. The enlarged panel at the top left highlights the geometrical meaning of the repulsion ratio
 ${\it\rho}_{t_{0}}^{t}$
.

Definition 2. A WLCS that satisfies the following additional condition
-
(iv) at each point the relationship
(2.12)
$$\begin{eqnarray}\langle {\bf\xi}_{max}|{\rm\nabla}^{2}{\it\lambda}_{max}|{\bf\xi}_{max}\rangle <0\end{eqnarray}$$

holds is called a Lagrangian coherent structure.
A simplified illustration of the previous conditions can be given as follows. The first condition is obtained when requiring that at each point
 $\boldsymbol{x}_{0}$
of the material line the repulsion rate
 ${\it\rho}(\boldsymbol{x}_{0},\boldsymbol{n}_{0})$
is larger than the contraction rate
 $L(\boldsymbol{x}_{0},\boldsymbol{n}_{0})$
, which represents the effect of the shear along the material line. At each point along a material line the tangent vector can be expressed in terms of the eigenvectors
 $|{\bf\xi}_{min}\rangle$
and
 $|{\bf\xi}_{max}\rangle$
of the Cauchy–Green strain tensor
 $\unicode[STIX]{x1D63E}$
:
 $$\begin{eqnarray}|\boldsymbol{e}_{0}\rangle ={\it\alpha}|{\bf\xi}_{min}\rangle +{\it\beta}|{\bf\xi}_{max}\rangle ,\quad {\it\alpha}^{2}+{\it\beta}^{2}=1,\end{eqnarray}$$
where
 ${\it\alpha}$
and
 ${\it\beta}$
represent the orientation of the material line and may be arbitrary functions of
 $\boldsymbol{x}_{0}$
. It follows that
 $$\begin{eqnarray}|\boldsymbol{n}_{0}\rangle ={\it\alpha}|{\bf\xi}_{max}\rangle -{\it\beta}|{\bf\xi}_{min}\rangle .\end{eqnarray}$$
We can therefore express the repulsion rate in terms of
 ${\it\alpha}$
and
 ${\it\beta}$
as
 $$\begin{eqnarray}{\it\rho}_{t_{0}}^{t}(\boldsymbol{x}_{0},\boldsymbol{n}_{0})=\frac{1}{\sqrt{\langle \boldsymbol{n}_{0}|\unicode[STIX]{x1D63E}^{-1}|\boldsymbol{n}_{0}\rangle }}=\left(\frac{{\it\alpha}^{2}}{{\it\lambda}_{max}}+\frac{{\it\beta}^{2}}{{\it\lambda}_{min}}\right)^{-1/2}.\end{eqnarray}$$
Now at each point
 $\boldsymbol{x}_{0}$
we maximize
 ${\it\rho}_{t_{0}}^{t}$
with respect to the direction of the tangent vector
 $|\boldsymbol{e}_{0}\rangle$
, i.e. of the orientation of the chosen material line, with the constraint
 ${\it\alpha}^{2}+{\it\beta}^{2}=1$
. This yields
 ${\it\alpha}=1$
,
 ${\it\beta}=0$
, so that
 $$\begin{eqnarray}{\it\rho}_{t_{0}}^{t}=\sqrt{{\it\lambda}_{max}},\end{eqnarray}$$
which implies that the material line must be chosen to be the strain line oriented along the eigenvector
 $|{\bf\xi}_{min}\rangle$
as required by (2.10). At this stage we need to maximize the repulsion rate along the material line with respect to nearby material lines. Therefore we define
 $$\begin{eqnarray}R_{t_{0}}^{t}({\it\gamma}_{0})\equiv \int _{s_{1}}^{s_{2}}\text{d}s\,{\it\rho}(\boldsymbol{x}_{0}(s),\boldsymbol{n}_{0}(s)),\end{eqnarray}$$
which has the physical meaning of the repulsion rate integrated over a curve
 ${\it\gamma}_{0}$
. We consider a curve
 ${\it\gamma}_{{\it\epsilon}}$
with points
 $\boldsymbol{x}_{{\it\epsilon}}\in {\it\gamma}_{{\it\epsilon}}$
such that
 $$\begin{eqnarray}\boldsymbol{x}_{{\it\epsilon}}=\boldsymbol{x}_{0}+{\it\epsilon}h(s)|\boldsymbol{n}_{0}\rangle .\end{eqnarray}$$
The first variation of (2.17) with respect to (2.18) gives
 $$\begin{eqnarray}{\it\delta}R_{t_{0}}^{t}({\it\gamma}_{{\it\epsilon}})[h]={\it\delta}\int _{s_{1}}^{s_{2}}\text{d}s\,{\it\rho}(\boldsymbol{x}_{{\it\epsilon}}(s),n_{{\it\epsilon}}(s))=0,\end{eqnarray}$$
which can be computed as
 $$\begin{eqnarray}\lim _{{\it\epsilon}\rightarrow 0}\frac{\partial }{\partial {\it\epsilon}}\int _{s_{1}}^{s_{2}}\text{d}s\,{\it\rho}(\boldsymbol{x}_{{\it\epsilon}}(s),n_{{\it\epsilon}}(s))=\lim _{{\it\epsilon}\rightarrow 0}\frac{\partial }{\partial {\it\epsilon}}\int _{s_{1}}^{s_{2}}\text{d}s\,\sqrt{{\it\lambda}_{max}(\boldsymbol{x}_{{\it\epsilon}}(s),n_{{\it\epsilon}}(s))},\end{eqnarray}$$
leading to
 $$\begin{eqnarray}{\it\delta}R_{t_{0}}^{t}({\it\gamma}_{{\it\epsilon}})[h]=\int _{s_{1}}^{s_{2}}\frac{\text{d}s\,h(s)}{2\sqrt{{\it\lambda}_{max}}}\langle \boldsymbol{{\rm\nabla}}{\it\lambda}_{max}|{\bf\xi}_{max}\rangle =0,\end{eqnarray}$$
which vanishes if
 $|\boldsymbol{{\rm\nabla}}{\it\lambda}_{max}\rangle$
is tangent to the material line. Requiring that this material line represent a maximum of the integrated repulsion rate, we obtain
 $$\begin{eqnarray}\langle {\bf\xi}_{max}|{\rm\nabla}^{2}{\it\lambda}_{max}|{\bf\xi}_{max}\rangle <0,\end{eqnarray}$$
which is the condition that defines the locally most repelling LCS. These structures are Lagrangian by definition and have no transport through them because they are material lines.
2.2. Lagrangian coherent structures as second derivative ridges
Second-derivative ridges were defined by Shadden et al. (Reference Shadden, Lekien and Marsden2005) in terms of the features of the Lyapunov exponent field
 ${\it\sigma}(\boldsymbol{x}_{0},t_{0},t)$
that characterizes the rate of separation of close trajectories.
The finite-time Lyapunov exponent can be expressed in terms of the Cauchy–Green tensor eigenvalues as
 $$\begin{eqnarray}{\it\sigma}(\boldsymbol{x}_{0},t_{0},t)=\frac{1}{2|t-t_{0}|}\ln {\it\lambda}_{max}(\boldsymbol{x}_{0},t_{0},t).\end{eqnarray}$$
Definition 3. A curve
 $\boldsymbol{r}(s)$
(not necessarily a material line) such that
-
(i) the tangent vector
$|\boldsymbol{r}^{\prime }(s)\rangle$
and
$\boldsymbol{{\rm\nabla}}{\it\sigma}$
along the curve are parallel, -
(ii) the normal unit vector
$|\boldsymbol{n}\rangle$
is such that, along the curve for all
$\langle \boldsymbol{u}|\boldsymbol{u}\rangle =1$
, (2.24)
$$\begin{eqnarray}\langle \boldsymbol{n}|{\it\bf\Sigma}|\boldsymbol{n}\rangle =\text{min}|_{\langle u|u\rangle =1}\langle \boldsymbol{u}|{\it\bf\Sigma}|\boldsymbol{u}\rangle <0,\end{eqnarray}$$


where
 ${\it\bf\Sigma}$
is the Hessian matrix of the second derivatives of
 ${\it\sigma}$
with respect to
 $\boldsymbol{x}_{0}$
, is called a second-derivative ridge.
A major difference between the two sets of definitions is that the most repelling LCS definition involves the eigenvectors and eigenvalues of the Cauchy–Green strain tensor, while the second condition in the definition of the second-derivative ridge is governed by the eigenvectors and eigenvalues of the matrix
 ${\it\bf\Sigma}$
.
3. Example: a Hamiltonian flow map
In this section we will illustrate the definitions introduced above and the procedure needed in order to identify and characterize the Lagrangian coherent structures by direct construction in a simplified dynamical system that can be studied analytically. We find it convenient to consider a Hamiltonian system, which ensures condition (2.9) through the conservation of phase-space volume. We consider the time-independent Hamiltonian
 $$\begin{eqnarray}H=\frac{x^{2}y}{2},\end{eqnarray}$$
from which we obtain
 $$\begin{eqnarray}\left.\begin{array}{@{}l@{}}\displaystyle \frac{\text{d}x}{\text{d}t}=-\frac{x^{2}}{2},\\ \displaystyle \frac{\text{d}y}{\text{d}t}=xy.\end{array}\!\!\right\}\end{eqnarray}$$
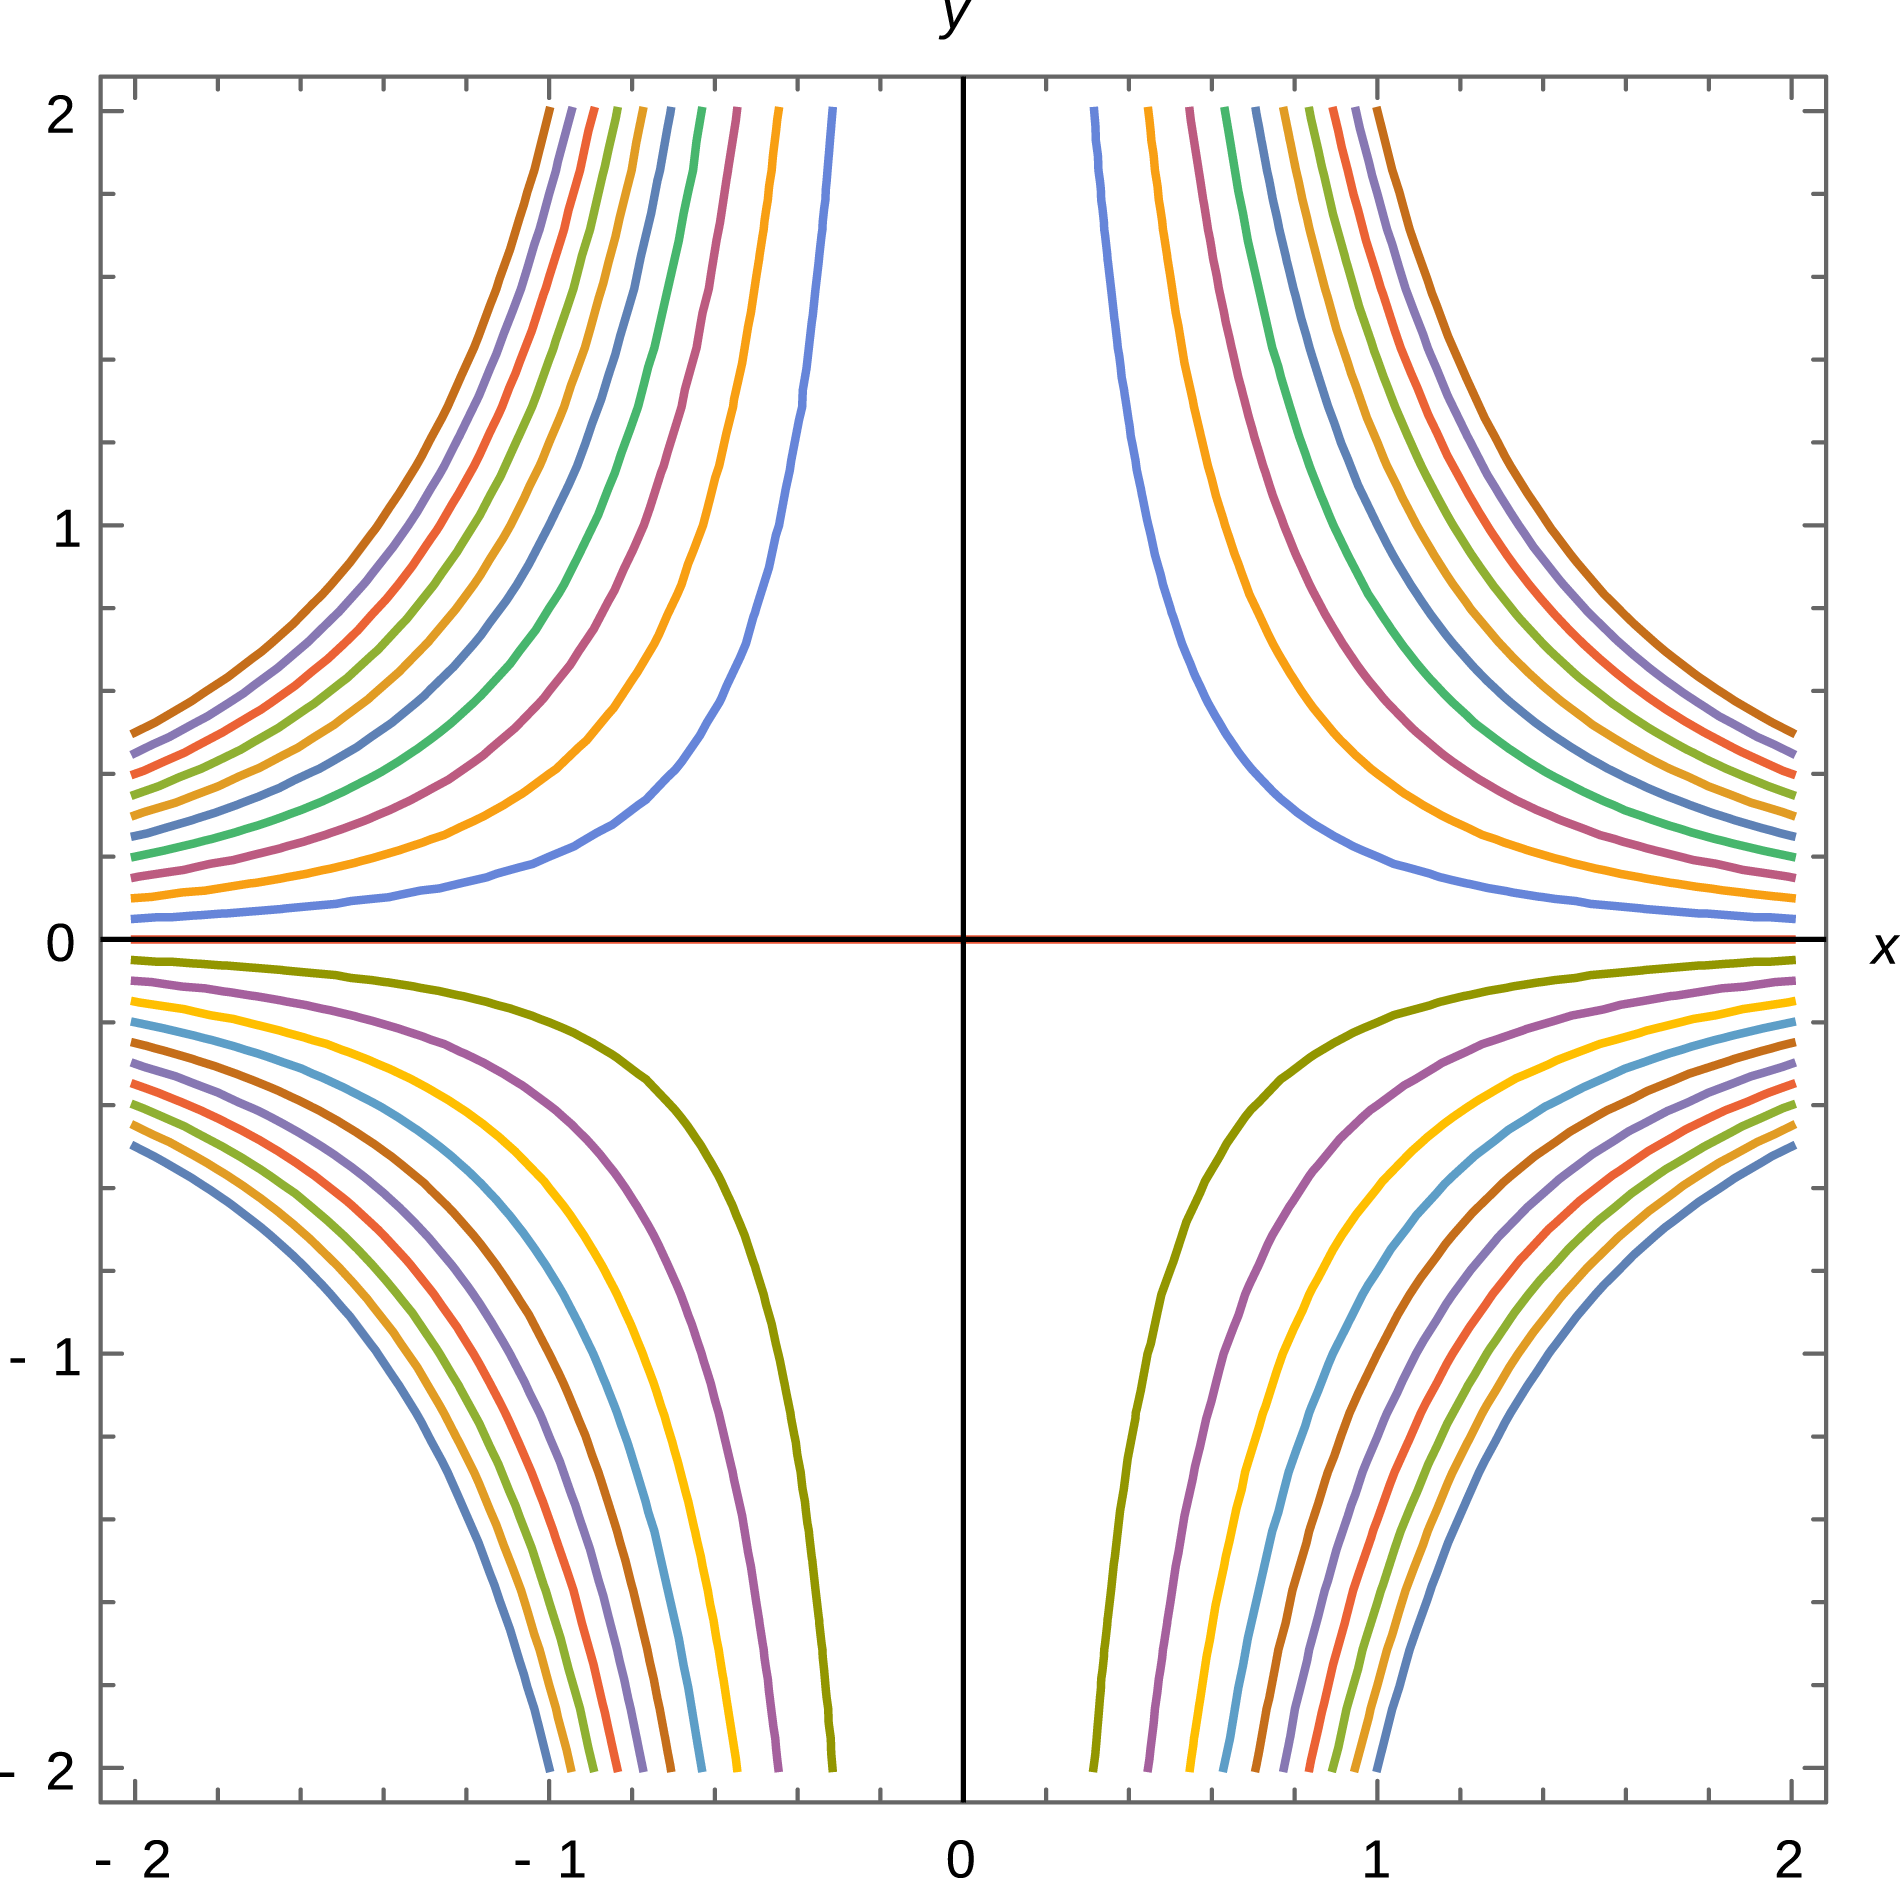
A contour plot of the Hamiltonian
 $H$
is given in figure 2. The trajectories obtained by integrating (3.2) coincide with the lines of constant
 $H$
. Integrating the system (3.2), we obtain
 $$\begin{eqnarray}\displaystyle x(t) & = & \displaystyle ({\bf\phi}_{0}^{t}(x_{0},y_{0}))_{x}=\frac{2x_{0}}{2+x_{0}t},\end{eqnarray}$$
 $$\begin{eqnarray}\displaystyle y(t) & = & \displaystyle ({\bf\phi}_{0}^{t}(x_{0},y_{0}))_{y}=y_{0}\left(1+\frac{x_{0}t}{2}\right)^{2},\end{eqnarray}$$
 $x_{0}=x(t=0)$
and
 $y_{0}=y(t=0)$
. From (3.3) we see that points with negative
 $x_{0}$
reach
 $x=-\infty$
in a finite time, while points with positive
 $x_{0}$
reach
 $x=0$
for
 $t\rightarrow \infty$
. In order to avoid this finite-time singularity, we restrict the domain to the semi-plane
 $x_{0}>0$
.
Contour plot of the Hamiltonian given in (3.1).

The matrix
 $\boldsymbol{{\rm\nabla}}{\bf\phi}_{0}^{t}$
takes the form
 $$\begin{eqnarray}\boldsymbol{{\rm\nabla}}{\bf\phi}_{0}^{t}=\left(\begin{array}{@{}cc@{}}1/B^{2} & 0\\ Bty_{0} & B^{2}\end{array}\right),\end{eqnarray}$$
where
 $B=1+tx_{0}/2$
. The Cauchy–Green strain tensor
 $\unicode[STIX]{x1D63E}_{0}^{t}(x_{0},y_{0})\equiv (\boldsymbol{{\rm\nabla}}{\bf\phi}_{0}^{t})^{\text{T}}\boldsymbol{{\rm\nabla}}{\bf\phi}_{0}^{t}$
is
 $$\begin{eqnarray}\unicode[STIX]{x1D63E}_{0}^{t}(x_{0},y_{0})=B^{2}\left(\begin{array}{@{}cc@{}}1/B^{6}+(ty_{0})^{2} & Bty_{0}\\ Bty_{0} & B^{2}\end{array}\right).\end{eqnarray}$$
In order to identify its eigenvectors and corresponding eigenvalues, it may be convenient to diagonalize it,
 $$\begin{eqnarray}R({\it\varphi})\unicode[STIX]{x1D63E}_{0}^{t}R^{\text{T}}({\it\varphi})=\unicode[STIX]{x1D63F},\end{eqnarray}$$
by means of the rotation
 $R({\it\varphi})$
,
 $$\begin{eqnarray}R({\it\varphi})=\left(\begin{array}{@{}cc@{}}\cos {\it\varphi} & -\!\sin {\it\varphi}\\ \sin {\it\varphi} & \cos {\it\varphi}\end{array}\right),\end{eqnarray}$$
with
 ${\it\varphi}$
given by
 $$\begin{eqnarray}{\it\varphi}=\frac{1}{2}\arctan \left(\frac{2Bty_{0}}{B^{2}-1/B^{6}-(ty_{0})^{2}}\right)\end{eqnarray}$$
and
 $\unicode[STIX]{x1D63F}(x_{0},y_{0})$
is the diagonal matrix
 $$\begin{eqnarray}\unicode[STIX]{x1D63F}=\left(\begin{array}{@{}cc@{}}{\it\lambda}_{min} & 0\\ 0 & {\it\lambda}_{max}\end{array}\right)\end{eqnarray}$$
with
 ${\it\lambda}_{max}={\it\lambda}_{+}$
,
 ${\it\lambda}_{min}={\it\lambda}_{-}$
and
 $$\begin{eqnarray}{\it\lambda}_{\pm }=\frac{1+B^{8}+B^{6}t^{2}y_{0}^{2}\pm \sqrt{(1+B^{8}+B^{6}t^{2}y_{0}^{2})^{2}-4B^{8}}}{2B^{4}}.\end{eqnarray}$$
The rotation angle
 ${\it\varphi}(x_{0},y_{0})$
can be used to find the orientation of the strain lines. Note that
 ${\it\varphi}(x_{0},y_{0}=0)=0$
, as the strain tensor in (3.6) is diagonal on the positive semi-axis
 $y_{0}=0$
with
 $|{\bf\xi}_{min}\rangle$
tangent to this axis, i.e. in the
 $x_{0}$
direction. In fact from (3.3) we see that if we take two points
 $x_{01}$
and
 $x_{02}$
on the positive
 $y_{0}=0$
semi-axis, with
 $x_{02}>x_{01}$
, they remain on this axis and their distance
 $d(t)$
decreases in time:
 $$\begin{eqnarray}d(t)=\frac{d(0)}{1+t(x_{02}+x_{01})/2+t^{2}x_{02}x_{01}/4},\end{eqnarray}$$
consistent with the fact that this
 $y_{0}=0$
axis is parallel to
 $|{\bf\xi}_{min}\rangle$
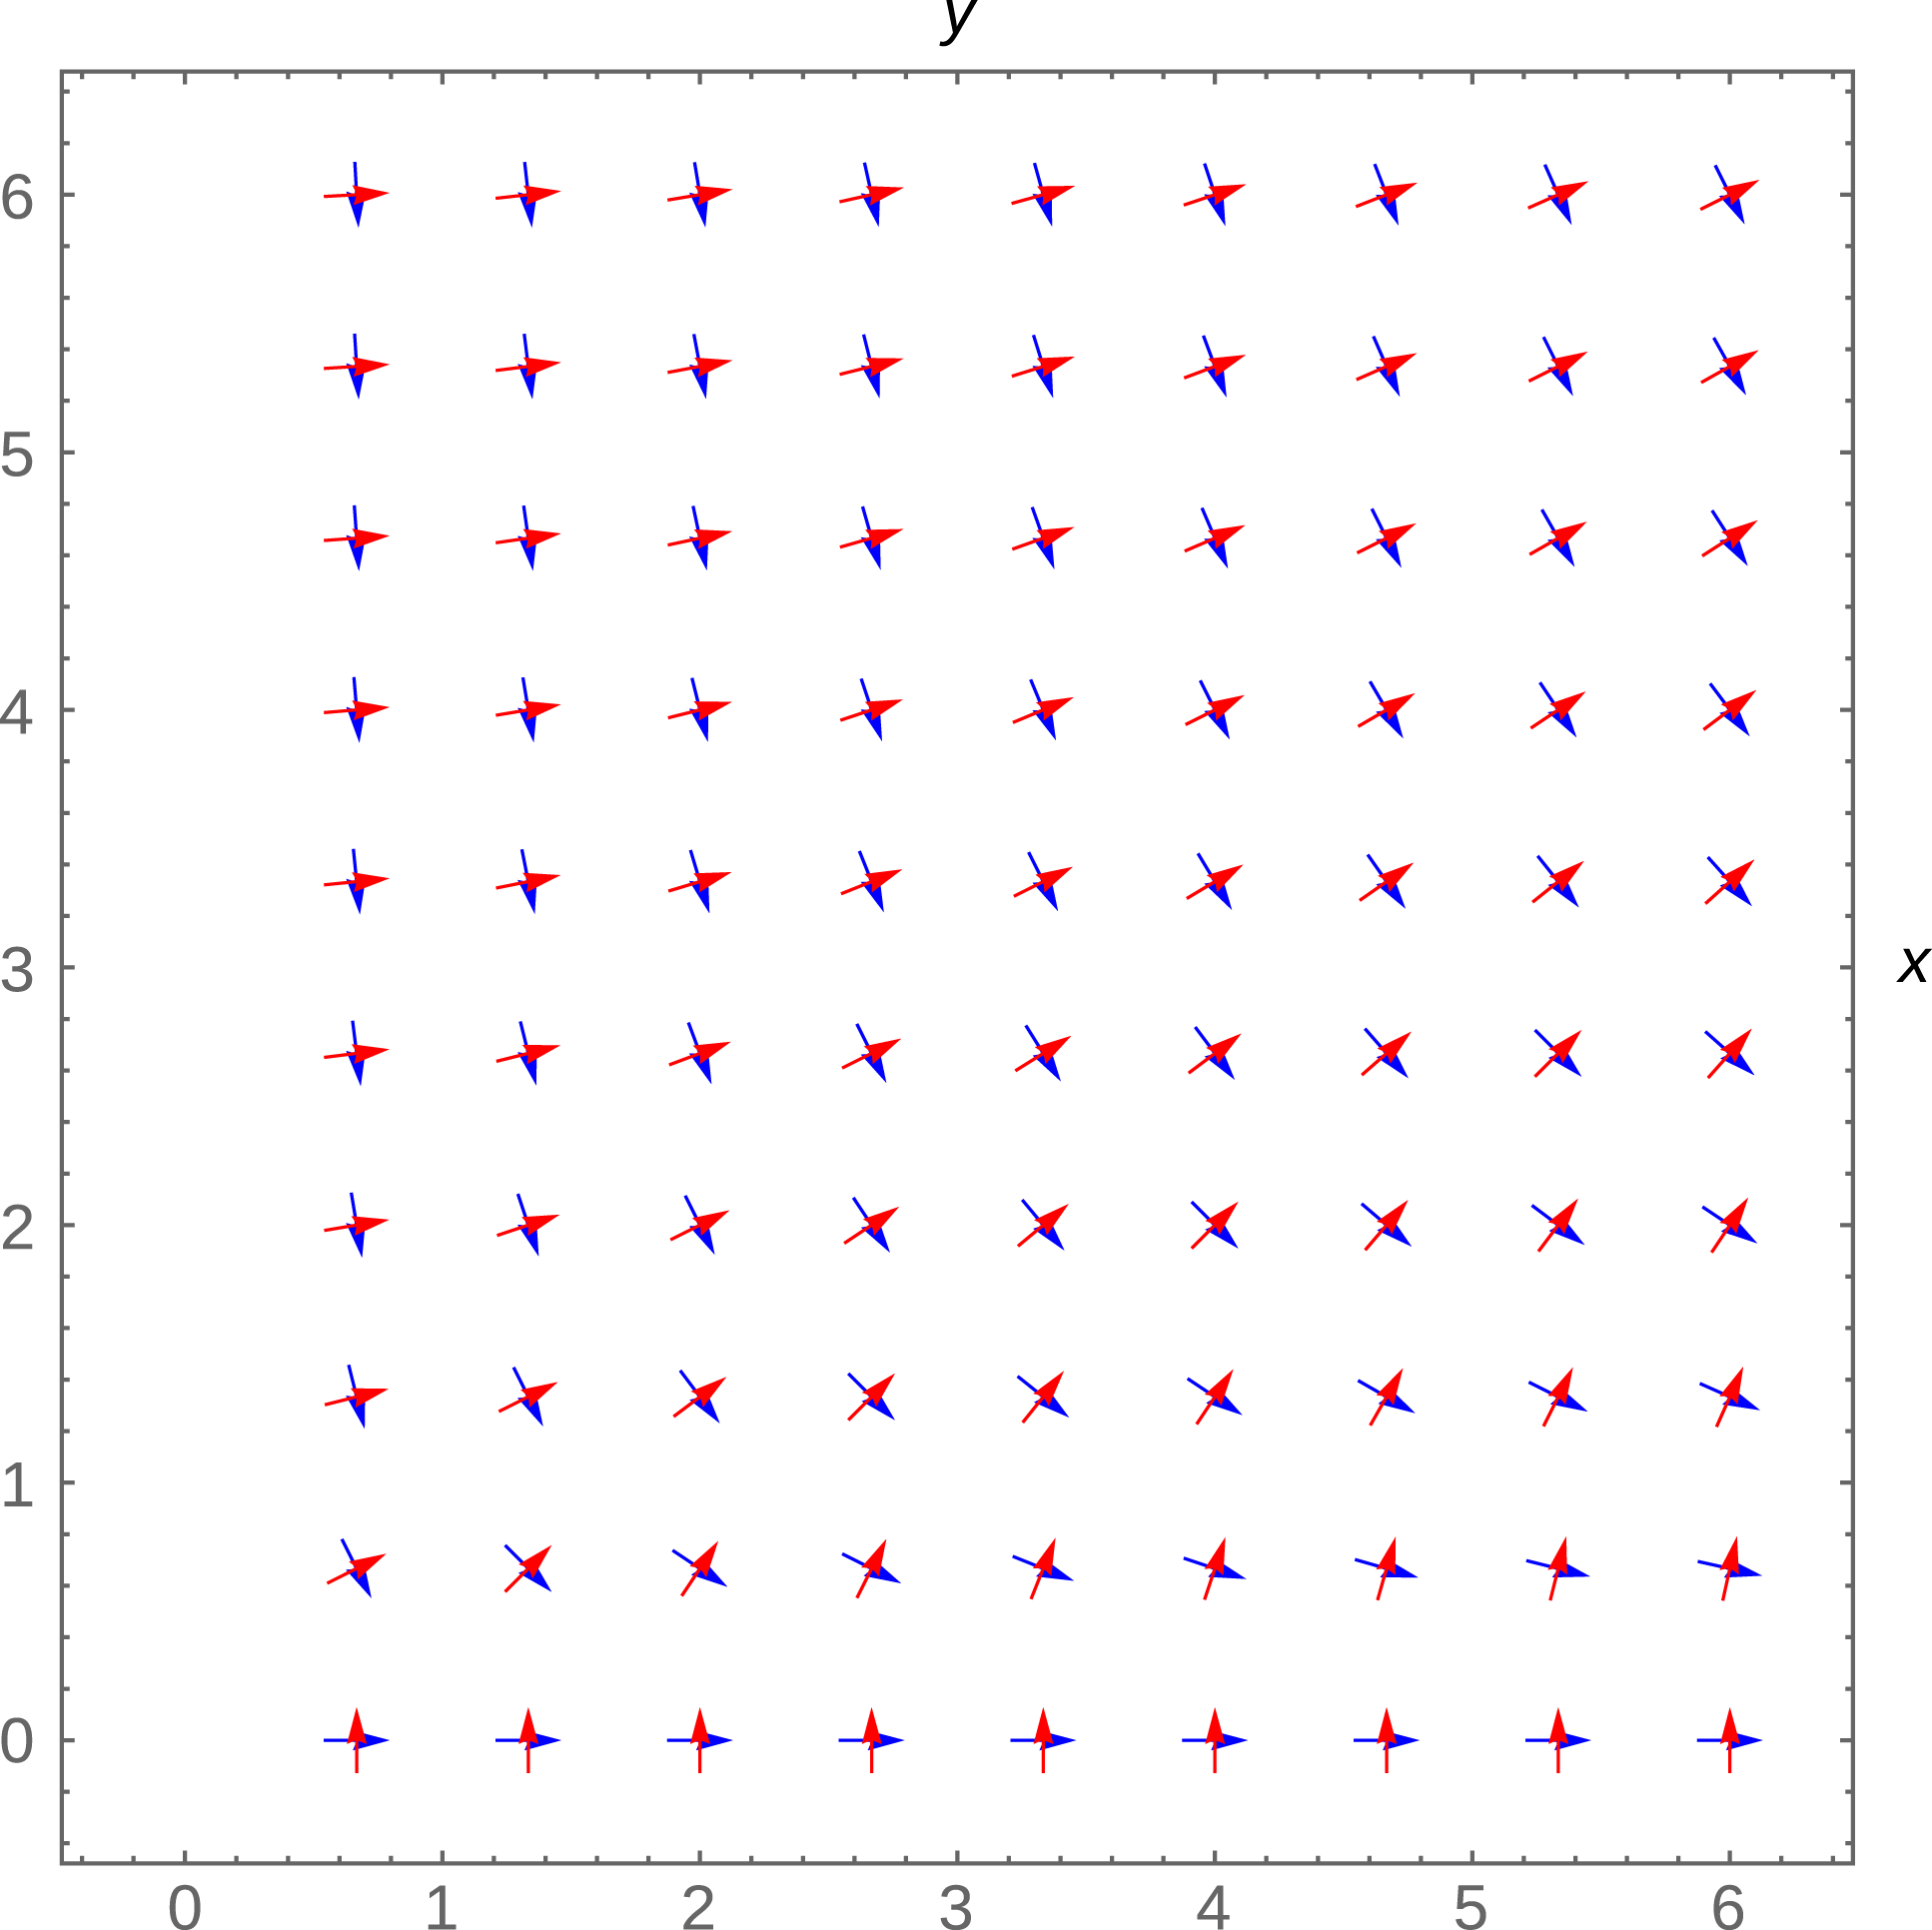
at all times. In order to show the strain lines of the Cauchy–Green tensor for
 $x_{0}>0$
in figure 3, we plot the vector fields
 $|{\bf\xi}_{max}\rangle =R^{\text{T}}({\it\varphi})|0,1\rangle =|\!\sin {\it\varphi},\cos {\it\varphi}\rangle$
and
 $|{\bf\xi}_{min}\rangle =R^{\text{T}}({\it\varphi})|1,0\rangle =|\!\cos {\it\varphi},-\!\sin {\it\varphi}\rangle$
in the limit of sufficiently long times such that
 $tx_{0}\gg 2$
, in which limit the rotation angle
 ${\it\varphi}$
reduces to
 $$\begin{eqnarray}{\it\varphi}\sim \frac{1}{2}\arctan \left(\frac{x_{0}y_{0}}{y_{0}^{2}-x_{0}^{2}/4}\right)=\arctan \frac{2y_{0}}{x_{0}}\end{eqnarray}$$
and becomes independent of time. In the same limit, the eigenvalues of the Cauchy–Green strain tensor become simply
 $$\begin{eqnarray}{\it\lambda}_{max}\sim t^{4}(x_{0}^{4}+4y_{0}^{2}x_{0}^{2})/16,\quad {\it\lambda}_{min}=1/{\it\lambda}_{max},\end{eqnarray}$$
and have a factorized time and space dependence.
Plot of the eigenvectors of the Cauchy–Green strain tensor in the limit
 $tx_{0}\gg 2$
. The vector field
 $|{\bf\xi}_{max}\rangle$
is marked in red while
 $|{\bf\xi}_{min}\rangle$
is in blue.

From (3.14) we can compute
 $\boldsymbol{{\rm\nabla}}{\it\lambda}_{max}$
(which will be parallel to
 $\boldsymbol{{\rm\nabla}}{\it\lambda}_{min}$
) as
 $$\begin{eqnarray}\boldsymbol{{\rm\nabla}}{\it\lambda}_{max}=\frac{t^{4}x_{0}}{4}\left(\begin{array}{@{}c@{}}x_{0}^{2}+2y_{0}^{2}\\ 2x_{0}y_{0}\end{array}\!\!\right)\propto \cos {\it\varphi}\left(\begin{array}{@{}c@{}}\cos ^{2}{\it\varphi}+2\sin ^{2}{\it\varphi}\\ 2\cos {\it\varphi}\sin {\it\varphi}\end{array}\!\!\right).\end{eqnarray}$$
A contour plot of (3.14) is shown in figure 4. Recalling that the sufficient and necessary condition in order to have a WLCS is
 $\langle {\bf\xi}_{max}|\boldsymbol{{\rm\nabla}}{\it\lambda}_{max}\rangle =0$
, we find the condition
 $\cos {\it\varphi}\sin {\it\varphi}\,(2\sin ^{2}{\it\varphi}+3\cos ^{2}{\it\varphi})=0$
. For
 $x_{0}\neq 0$
(i.e
 ${\it\varphi}\neq {\rm\pi}/2$
), this condition implies that
 $\sin {\it\varphi}=0$
. Thus the only repulsive WLCS is given by the positive
 $y_{0}=0$
semi-axis.
Contour plot of
 ${\it\lambda}_{max}$
.

It is easy to see that the condition (2.12) is not satisfied, i.e. this WLCS is not a maximum for the repulsive rate and thus is not an LCS.
Referring now to the definition of the second-derivative ridges, from (3.14) at
 $y_{0}=0$
we find
 $$\begin{eqnarray}{\it\bf\Sigma}(x_{0},y_{0}=0)=\frac{4}{x_{0}^{2}}\left(\begin{array}{@{}cc@{}}-1 & 0\\ 0 & 2\end{array}\right),\end{eqnarray}$$
which is not negative definite and for which
 $\langle \boldsymbol{n}|{\it\bf\Sigma}|\boldsymbol{n}\rangle$
is a maximum, not a minimum, contrary to the requirement (2.24) in the second-derivative ridge definition.
In this example the WLCS that we found at
 $y_{0}=0$
according to Haller’s definition is not a second-derivative ridge.
4. Barriers in the electron transport in a three-dimensional reconnection process
4.1. Introduction
In this section we briefly show how the above concepts can be used in order to locate the barriers to the electron transport caused by magnetic perturbations generated by three-dimensional (3D) magnetic reconnection processes in the presence of a fixed ‘guide field’ component. For the sake of simplicity, a doubly periodic slab geometry is considered with the guide field along the
 $z$
axis and the inhomogeneity direction along the
 $x$
axis. Because of the double periodicity (along
 $y$
and
 $z$
), this model can be applied mainly to toroidal thermonuclear plasmas (Avinash et al.
Reference Avinash, Bulanov, Esirkepov, Kaw, Pegoraro, Sasorov and Sen1998; Porcelli et al.
Reference Porcelli, Borgogno, Califano, Grasso, Ottaviani and Pegoraro2002; Borgogno et al.
Reference Borgogno, Grasso, Porcelli, Califano, Pegoraro and Farina2005), and with some modifications to space plasmas (Rappazzo & Parker Reference Rappazzo and Parker2013) and, more generally, to physical contexts where plasma is confined by a nearly uniform strong magnetic field with small perturbations. In a collisionless regime, following a standard approach (see e.g. Rechester & Rosenbluth Reference Rechester and Rosenbluth1978), we ‘assume that guiding-centre trajectories coincide with the field lines’. Although this is a restrictive assumption that neglects among other effects the drift caused by (fluctuating) transverse electric fields, particle trapping along field lines, etc., it has a paradigmatic role since it makes it possible to relate in a simple way barriers in the electron transport with LCS in the magnetic configuration. A more precise formulation of the (self-consistent) relationship between electron particle and heat transport and magnetic fluctuations can be found in Coronado & Akcasu (Reference Coronado, Vitela and Akcasu1992), White & Wu (Reference White and Wu1992), Beyer et al. (Reference Beyer, Garbet, Benkadda, Ghendrih and Sarazin2002), Kasilov et al. (Reference Kasilov, Reiter, Runov, Kernbichler and Heyn2002) and Hatch et al. (Reference Hatch, Pueschel, Jenko, Nevins, Terry and Doerk2012) and for space plasmas in Matthaeus (Reference Matthaeus, Qin, Bieber and Zank2003) and references therein.
The magnetic field structure and evolution are described through the magnetic flux function
 ${\it\psi}(x,y,z,t)$
by the relationship
 $$\begin{eqnarray}\boldsymbol{B}=B_{0}\boldsymbol{e}_{z}+\boldsymbol{e}_{z}\times \boldsymbol{{\rm\nabla}}{\it\psi}.\end{eqnarray}$$
As for all solenoidal fields in an odd-dimensional space, at any fixed time
 $t=\bar{t}$
the magnetic field line equations can be written in the form of Hamilton’s equations. The function
 ${\it\psi}(x,y,z,\bar{t})$
plays the role of the Hamiltonian, while the coordinate
 $z$
plays the role of the time variable in this Hamiltonian system. Using a periodic geometry along
 $z$
allows us to study the shape of magnetic field lines with dynamical systems techniques such as the Poincaré map. The growth and interaction of different unstable modes will naturally lead to the formation of structures in the magnetic field such as magnetic islands and to chaotic behaviour of field lines. Assuming, as is commonly done, that electrons complete a number of turns along
 $z$
before the magnetic field is significantly changed, we can investigate the advection of particles in such a chaotic system at a fixed
 $t=\bar{t}$
using the LCS technique. This requires in particular that the electron thermal velocity be sufficiently larger than the Alfvén speed and allows us to highlight the finite-time transport barriers of the system. Choosing the LCS characteristic time span
 $|z-z_{0}|$
properly, we obtain the boundaries of the regions where fast electron mixing is expected. After a time span of the order of the Alfvén time, we can expect that the shape of the magnetic field lines will have changed significantly, and therefore we need to ‘refresh’ the Hamiltonian
 ${\it\psi}(x,y,z,\bar{t})$
and plot a new Poincaré map for the magnetic field. The LCS of the Poincaré map, calculated with a sufficient number of iterations, marks the boundaries of the regions where the electrons will mix.
In this paper we will not deal with the numerical integration of the partial differential equation (PDE) governing the dynamics. We will instead study the shape of the magnetic field lines at fixed
 $t$
, extracting
 ${\it\psi}$
from the numerical simulation carried out in this work by Borgogno et al. (Reference Borgogno, Grasso, Porcelli, Califano, Pegoraro and Farina2005). An analogous analysis has been carried out by Borgogno et al. (Reference Borgogno, Grasso, Pegoraro and Schep2011a
), where the LCS have been calculated using the definition based on the ridges of the finite-time Lyapunov exponent field. We choose the same values for the parameters defining the LCS in order to make a comparison with that work.
4.2. The physical system
The physical system studied is a Hamiltonian reconnection process in a dissipationless 3D plasma immersed in a strong, uniform, externally imposed magnetic field. A slab geometry is used, with a formal additional periodicity along
 $x$
imposed for numerical convenience. The algorithm applied in the numerical simulation is detailed in Borgogno et al. (Reference Borgogno, Grasso, Pegoraro and Schep2008). The reconnection process develops starting from a static equilibrium configuration given by
 $$\begin{eqnarray}{\it\psi}_{eq}(x)=A\cos (x),\end{eqnarray}$$
with
 $A=0.19$
. The integration domain is defined by
 $-L_{x}<x<L_{x}$
,
 $-L_{y}<y<L_{y}$
and
 $-L_{z}<z<L_{z}$
with
 $L_{x}={\rm\pi}$
,
 $L_{y}=2{\rm\pi}$
and
 $L_{z}=16{\rm\pi}$
. The equilibrium is perturbed as
 $$\begin{eqnarray}{\it\psi}(x,y,z,t)={\it\psi}_{eq}(x)+\tilde{{\it\psi}}(x,y,z,t),\end{eqnarray}$$
where
 $\tilde{{\it\psi}}(x,y,z,t)$
is written as a sum over Fourier modes,
 $$\begin{eqnarray}\tilde{{\it\psi}}(x,y,z,t)=\mathop{\sum }_{i}\tilde{{\it\psi}}_{i}(x,k_{yi}y+k_{zi}z,t),\end{eqnarray}$$
with
 $k_{yi}=2{\rm\pi}m_{i}/L_{y}$
and
 $k_{zi}=2{\rm\pi}n_{i}/L_{z}$
. The field line equations can be cast in Hamiltonian form:
 $$\begin{eqnarray}\left.\begin{array}{@{}l@{}}\displaystyle \frac{\text{d}x}{\text{d}z}=\frac{1}{B_{0}}\frac{\partial {\it\psi}}{\partial y}=\frac{B_{x}}{B_{0}},\\ \displaystyle \frac{\text{d}y}{\text{d}z}=-\frac{1}{B_{0}}\frac{\partial {\it\psi}}{\partial x}=\frac{B_{y}}{B_{0}}.\end{array}\!\!\!\right\}\end{eqnarray}$$
Because of its periodicity along
 $z$
, the system can be paired to its Poincaré map and therefore we will deal with a 2D discrete-time system instead of a 3D continuous one.
The resonant condition
 $\boldsymbol{B}_{eq}\boldsymbol{\cdot }\boldsymbol{{\rm\nabla}}{\it\psi}=0$
leads to the definition of the resonant surfaces
 $x=x_{si}$
where the reconnection process takes place:
 $$\begin{eqnarray}\frac{\text{d}{\it\psi}_{eq}(x)}{\text{d}x}=-\frac{\partial {\it\psi}_{i}/\partial z}{\partial {\it\psi}_{i}/\partial y}=-\frac{k_{zi}}{k_{yi}}.\end{eqnarray}$$
The initial perturbation considered by Borgogno et al. (Reference Borgogno, Grasso, Porcelli, Califano, Pegoraro and Farina2005) consists of two contributions with different wavenumber pairs
 $(k_{zi},k_{yi})$
, i.e.
 $(1,0)$
and
 $(1,1)$
respectively:
 $$\begin{eqnarray}\tilde{{\it\psi}}(x,y,z,t)=\hat{{\it\psi}}_{1}(x,t)\exp (\text{i}k_{y1}y+\text{i}k_{z1}z)+\hat{{\it\psi}}_{2}(x,t)\exp (\text{i}k_{y2}y+\text{i}k_{z2}z).\end{eqnarray}$$
The amplitude of the perturbation
 $\hat{{\it\psi}}_{1}$
is of order
 $10^{-4}$
, while
 $\hat{{\it\psi}}_{2}$
is of order
 $10^{-5}$
. Magnetic islands are induced around the resonant surfaces
 $x=x_{si}$
, i.e.
 $x_{s1}=0$
and
 $x_{s2}=0.71$
. When the magnetic islands are sufficiently large, the islands start interacting. Different modes of higher order are generated and the magnetic field topology becomes chaotic. The whole process can be visualized with the Poincaré map technique, which at any fixed
 $t$
gives a snapshot of the magnetic field lines passing through a fixed
 $z$
plane. Following Borgogno et al. (Reference Borgogno, Grasso, Porcelli, Califano, Pegoraro and Farina2005) we consider the system after a time lapse of
 $t=415{\it\tau}_{A}$
, obtaining the Poincaré map shown in figure 5 with the intersections between the magnetic field lines and the
 $z=L_{z}/2$
surface.
Poincaré plot of the magnetic field lines obtained taking the intersections between the magnetic field lines and the surface
 $z=L_{Z}/2$
with
 $t=415{\it\tau}_{A}$
.

4.3. Numerical results and comparison with FTLE ridges
Following Haller (Reference Haller2011), we look for the LCS of the system, defined as the most repelling material lines. This is the physical definition of a hyperbolic LCS, and it is independent of the method chosen in order to identify it, by means of either the FTLE field or the eigenvalues and eigenvectors of the Cauchy–Green strain tensor. The main difference between the two methods stems from the fact that the FTLE ridges are not in general material lines, i.e. are not advected by the flow. The transport barriers of the system, instead, must be advected by the flow. In rigorous terms, if we want to use the FTLE field in order to describe the transport barriers in a dynamical system, we need to estimate the flux across the ridges and show that it is null, or at least vanishingly small, i.e. that initial data starting on one side of the ridge cannot cross it in the finite time interval considered. In the most general case, this condition is not satisfied by an FTLE ridge. Several examples of FTLE ridges that are not advected by the flow were shown in Haller (Reference Haller2011). In Borgogno et al. (Reference Borgogno, Grasso, Pegoraro and Schep2011a ,Reference Borgogno, Grasso, Pegoraro and Schep b ) no estimate of the flux was made but, a posteriori, it was verified that initial conditions taken on one side of certain FTLE ridges stay on that side for a finite number of iterations of the map. Therefore these ridges are classified as finite-time transport barriers. The LCS calculated using the method described in this work, instead, are by definition material lines and, therefore, they have no flux across them.
The transport barriers of the system also include the most repelling material lines obtained integrating backwards in time, i.e. the attractive structures. We exploit the symmetry of the system under reflection over
 $y=0$
to compute only the repulsive structures, obtaining the attractive ones through their reflection symmetry. The algorithm used to integrate the dynamical system defined above is described by Onu et al. (Reference Onu, Huhn and Haller2015). The result is shown in figure 6, where the red lines represent the repulsive structures while the blue ones represent the attractive ones. These lines are the hyperbolic LCS of the system and, therefore, finite-time transport barriers. In particular, the plot in figure 6 shows the typical lobes that characterize the chaotic transport in a 2D non-autonomous dynamical system (see e.g. Wiggins Reference Wiggins1992).
Plot of the most repelling material lines in red and of the most attractive ones in blue on the
 $z=L_{z}/2$
plane superimposed onto the Poincaré map of the system. There is good agreement between the structures of the map and the material lines.

As in figure 6, but with a lower filtering parameter. Repelling structures are marked in red, the attracting ones with other colours.

A comparison between the structures obtained and the FTLE ridges shown in Borgogno et al. (Reference Borgogno, Grasso, Pegoraro and Schep2011a
,Reference Borgogno, Grasso, Pegoraro and Schep
b
) shows a significant qualitative agreement when one accounts for the relative shift along
 $y$
of the two island chains, which follows from the fact that these structures are plotted for different values of
 $z$
. While a more quantitative numerical comparison will be presented in a future paper, we can easily identify in figures 6 and 7 the regions of maximum internal mixing separated by transport barriers that correspond to the regions separated by the ridges in figure 7 of Borgogno et al. (Reference Borgogno, Grasso, Pegoraro and Schep2011a
).
5. Conclusions
This article is meant as an introduction to the study of Lagrangian coherent structures in chaotic magnetic field configurations. It aims to:
-
(a) stress the role that Lagrangian coherent structures can play in the description of transport phenomena in magnetically confined plasmas;
-
(b) introduce the plasma physics reader to a debate, occurring mostly in the fluid dynamics and oceanographic communities, on the proper operational definitions of these structures;
-
(c) exemplify the differences between the two definitions given by Haller (Reference Haller2011) and by Shadden et al. (Reference Shadden, Lekien and Marsden2005) on a simple, analytically solvable, case; and
-
(d) present a preliminary numerical comparison between the results given in previous articles (Borgogno et al. Reference Borgogno, Grasso, Pegoraro and Schep2011a ,Reference Borgogno, Grasso, Pegoraro and Schep b ) where the first definition given by Shadden et al. (Reference Shadden, Lekien and Marsden2005) was used and a recalculation of the same structures based on the corrected definition given by Haller (Reference Haller2011).
The results presented appear to be promising enough to start implementing a wider investigation of the applicability of LCS to magnetic configurations without the constraint of periodicity that is inherent to the Poincaré map method.
Acknowledgement
The authors wish to thank D. Borgogno for clarifying discussions and for his assistance in accessing the data of the numerical integration of the PDE governing the magnetic field line equations of Borgogno et al. (Reference Borgogno, Grasso, Porcelli, Califano, Pegoraro and Farina2005).