1. INTRODUCTION
Scientific and technological interest in hard amorphous hydrogenated carbon coatings [also known as diamond-like carbon (DLC) films] is continuously increasing because this material has properties similar to those of diamond but can be obtained by simpler technological processes (Wu et al., Reference Wu, Wang, Su and Xu2015; Chen et al., Reference Chen, Zhang and Huang2013; Xu et al., Reference Xu, Su, Hang and Cheng2013). The useful properties of DLC originate in sp 3-bonding carbon. In fact, the sp 3 content influences the properties of the DLC (Cui et al., Reference Cui and Zhao2006; Singh et al., Reference Singh, Xie, Bendavid, Martin, Munroe and Hoffman2008; Kai et al., Reference Kai, Ke, Li, Zou and Wang2015). Su et al. have shown through simulation and calculation that the main cause of a DLC film's low anti-laser damage ability is a thermal effect that causes the film to become graphitized in areas of laser irradiation (Xu et al., Reference Xu, Su, Xie and Liang2007; Su et al., Reference Su, Liang and Xu2010). Therefore, it is very important to determine a method to reduce the graphitization of DLC thin films and enhance their anti-laser damage ability.
2. DEPOSITING THE DLC FILM
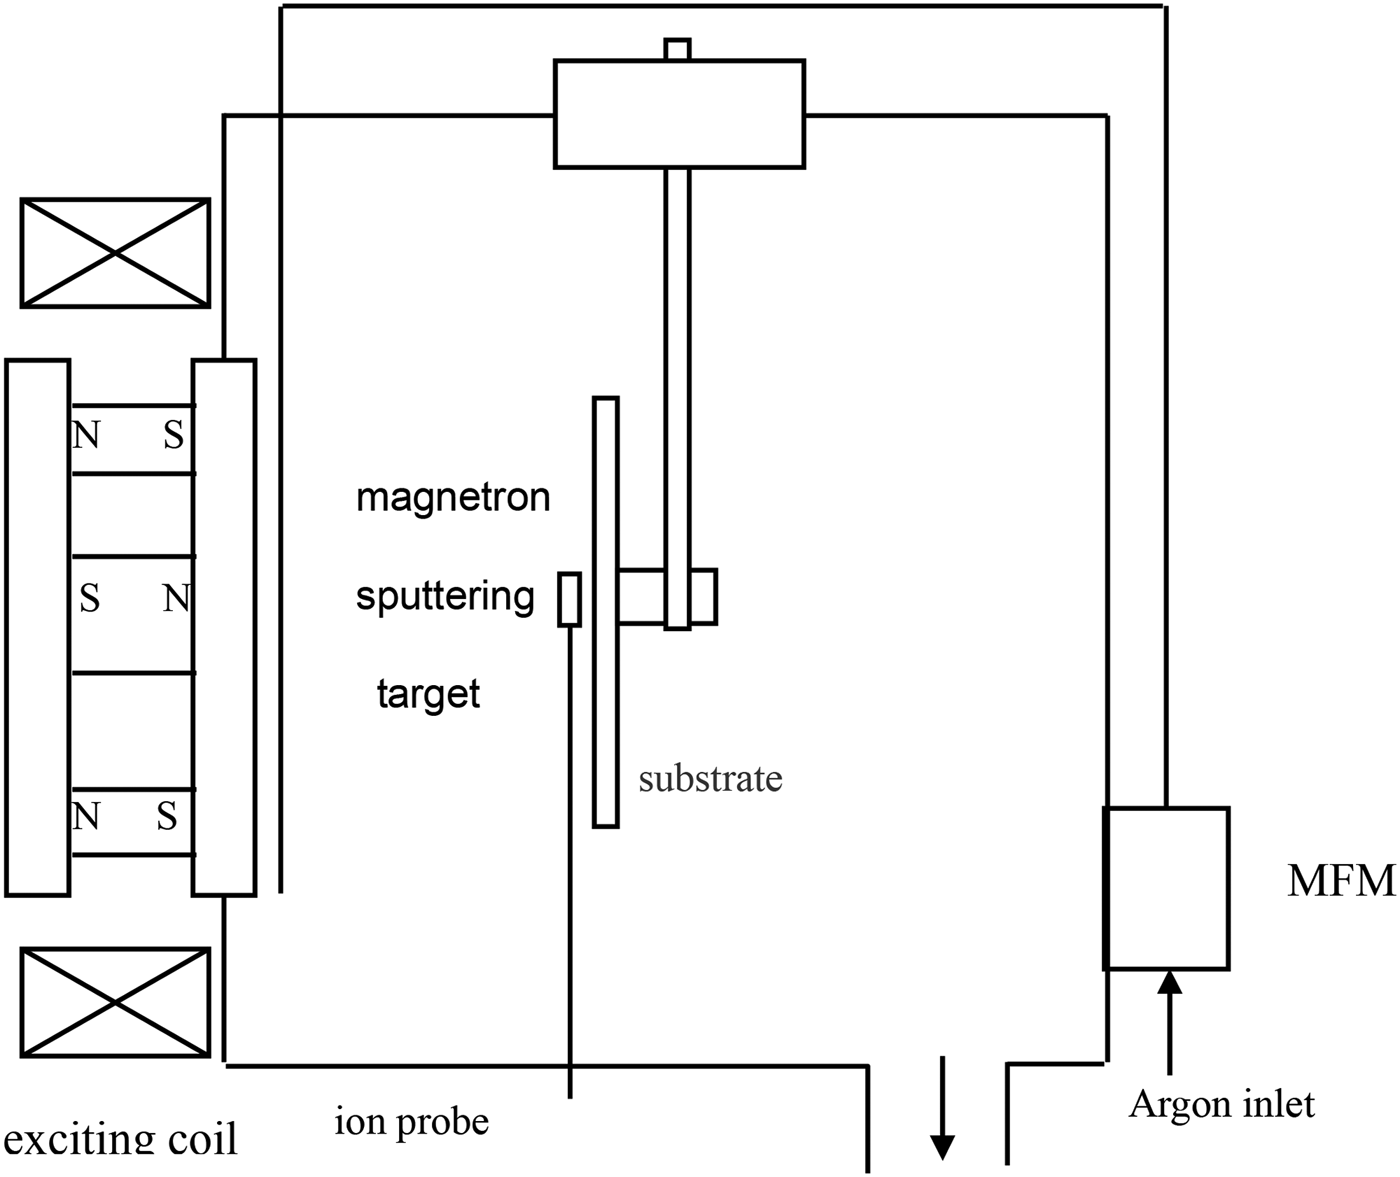
Magnetron sputtering has many advantages including applicability to diverse film materials, high adhesiveness, high purity, and the ability to work in a pressure range from 10−2 Pa to several hundred Pa (Wu et al., Reference Wu, Shi, Su, Xu and Xi2010). In this study, DLC films were deposited by unbalanced magnetron sputtering (UBMS). A diagram of the UBMS system is shown in Figure 1.
Diagram of the UBMS system.

Prior to film deposition, silicon was placed in a 3:1 mixture of ethanol and ethyl, cleaned for approximately 10 min using an ultrasonic technique, and air-dried in a vacuum chamber, which was brought down to 2 × 10⁻³ Pa before using an ion-cleaning source and argon (5 N) to clean the surface of the substrate (Wu et al., Reference Wu, Shi and Su2012a). The cleaning system used a working vacuum of 2 × 10⁻¹ Pa and an ion beam of 50 mA with an energy of approximately 1500 eV. After 30 min of cleaning, the ion-cleaning source was switched off, the argon gas supply was stopped, and a pulsed arc began depositing the films. A bias voltage of 80 V, a target current of 8 A, an argon gas flow of 200 sccm, and an excitation current of 100 A were used for DLC deposition (Wu et al., Reference Wu, Su, Shi and Wang2012b).
3. ELECTRODE DEPOSITION
The electrodes were deposited on the DLC films by current magnetron sputtering at a spacing of 10 mm (Wu et al., Reference Wu, Wang, Su and Xu2015). The deposition parameters for the preparation of electrodes were as follows: Sputtering power was 75 W, pressure was 0.8 Pa, Ar flux rate was 30 sccm, and deposition time was 30 min. A model of the deposited electrodes, together with a physical specimen, is shown in Figure 2. The average thickness of the electrodes was 329.5 nm. To realize a uniform horizontal electric field, the influence of the thermal stress was reduced during the deposition process.
Deposition of Ti electrodes on DLC films; (a) electrodes on the same side, (b) electrodes on opposite sides.
Ti electrodes were deposited on the DLC films. Figure 2a, 2b show the case in which electrodes were deposited on the same side and opposite sides of the DLC film, respectively. The electrodes were deposited on the surface of the DLC film to form an electric field. The electrodes must have good Ohmic contact and little thermal stress to be able to form a parallel electric field.
The electrode thickness was measured by a white-light interferometer, and the average thickness of the electrodes was 325.90 nm. The surface roughness of the electrodes was tested using the Talysurf CCI 2000 noncontact surface-measuring instrument, and the average roughness of the electrodes was 0.50 nm.
4. EXPERIMENTS
The laser-induced damage threshold (LIDT) testing system was established following ISO11254-1 standards using the setup shown in (Xu et al., Reference Xu, Fan, Liu and Su2008). The testing system shown in Figure 3 was operated using a 1-on-1 zero rate of damage. The laser used in the testing system was a transverse electromagnetic mode (TEM00) Q Nd:YAG with a wavelength of 1064 nm and a pulse width of 10 ns. The laser beam passed through a lens with a focal length of 250 mm to focus the beam on the sample surface. The sample film was situated on a two-dimensional (2D) platform that could be manually operated or run automatically. The diameter of the laser spot on the sample surface was obtained by a diaphragm method as 0.8 mm. The LIDT of the sample DLC film was 0.57 J/cm2.
LIDT measurement system.
The thin film laser damage threshold testing system was used to test laser damage under the horizontal electric field, and the processes involved were as follows:
(1) Adjust and determine the initial laser energy density when a bias voltage is not exerted.
(2) Exert a horizontal electric field by adjusting the constant current power. Irradiate the films according to the damage processes with incident lasers at increasing energy levels and observe the damage threshold and morphology.
(3) Adjust the constant current power to 100, 200, 300, 400, 500, 600, 700, 800, 900, and 1000 V, and then repeat step (2) and observe and record the phenomena.
(4) Compare the damage morphology of the DLC films under different horizontal electric fields. Observe the trend of the film damage threshold when the bias changes from a lower level to a higher level.
4.1. Horizontal electric field
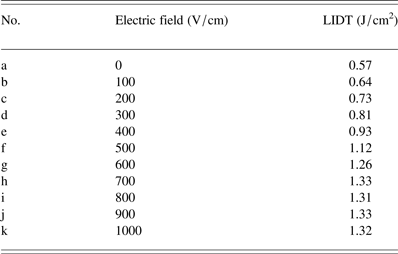
Horizontal electric fields were applied to the DLC film from 0 to 1000 V/cm, and the corresponding LIDTs of the DLC films are shown in Table 1.
Horizontal electric fields and LIDTs of DLC films.
According to Table 1, the LIDT of the DLC film was 0.57 J/cm2 without an applied electric field. The LIDT increased to 0.64 J/cm2 when the bias field increased to 100 V/cm. The LIDT increased with increasing electric field, reaching a saturation value of 1.33 J/cm2 when the electric field increased to 700 V/cm; thereafter, even when the bias electric field increased to 1000 V/cm, the corresponding LIDT remained at about 1.33 J/cm2.
The surface topography images were observed using a white-light interferometer before and after the electric field was applied to the DLC films, and the induced laser energy density was 2.95 J/cm2. The 3D profile characteristics of the DLC films are shown in Figure 4.
3D profile characteristics of DLC films under a horizontal electric field; (a) 0 V/cm, (b) 220 V/cm.
The laser energy density was 2.95 J/cm2. The laser irradiated the DLC film surface. The laser damage morphology became small, and only a few small pits appeared in the laser-irradiated area when a bias electric field was applied to the DLC film.
4.2. Longitudinal electric field
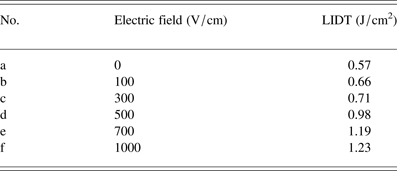
The longitudinal electric fields were applied to the DLC film from 0 to 1000 V/cm, and the corresponding LIDTs of DLC films are shown in Table 2.
Longitudinal electric fields and LIDTs of DLC films.
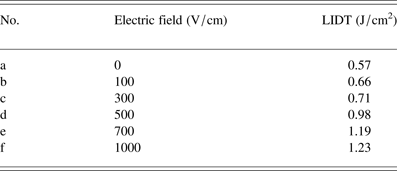
According to Table 2, the LIDT of the DLC film was 0.57 J/cm2 without an applied electric field. The LIDT increased to 0.66 J/cm2 when the bias field increased to 100 V/cm. The LIDT increased with increasing electric field, reaching a saturation value of 1.19 J/cm2 when the electric field increased to 700 V/cm; thereafter, even when the bias electric field increased to 1000 V/cm, the corresponding LIDT remained at about 1.23 J/cm2.
The surface topography images were observed using a white-light interferometer before and after the longitudinal electric field was applied to the DLC films, and the induced laser energy density was 2.10 J/cm2. The 3D profile characteristics of the DLC films are shown in Figure 5.
3D profile characteristics of DLC films under a longitudinal electric field; (a) 0 V/cm, (b) 220 V/cm.
4.3. Influence of electric field direction on LIDT
The direction of an electric field with constant strength was varied and the change in the LIDT of the DLC film was observed.
The change in the LIDT of the DLC film was compared with the same electric field intensity and different electric field directions, as shown in Figure 6. The effect of the horizontal bias electric field was greater than that of the longitudinal electric field on the improvement of the DLC film's LIDT. For electric field intensities of ≥700 V/cm, the LIDT showed little change. Since the experimental conditions were limited, an experiment with a higher bias voltage has not been conducted. Higher electric fields are expected to obtain a greater LIDT.
Effect of different electric field directions on LIDT.
5. PHYSICAL CHARACTERIZATION AND ANALYSIS RESULTS
Raman spectroscopy was used to analyze the DLC films’ properties before and after they were laser-irradiated; Figure 7a shows the original film sample and Raman spectrum; Figure 7b shows the Raman spectrum of the DLC film with 0 V/cm under a laser energy density of 1.56 J/cm2; at this time, the film was seriously damaged. Figure 7c shows a Raman spectrum of 1.56 J/cm2 after an horizontal electric field of 110 V/cm was applied; at this point, the surface of the DLC film showed a small degree of dot damage.
Raman spectra of DLC films under different electric fields and laser intensities; (a) original DLC film (E = 0 V/cm, F = 0 J/cm2) (b) E = 0 V/cm, F = 1.56 J/cm2, and (c) E = 110 V/cm, F = 1.56 J/cm2.
As shown in Figure 7, there were two characteristic peaks in the DLC Raman spectra. One was D-peak, which represented the defects and disorder induced. The other was G-peak, which represented the stretching movement of all sp 2 hybrid bonds in the carbon ring. The intensity ratio of the D- and G-peaks (I D/I G) was used to describe the intensity of the two peaks (Xu et al., Reference Xu, Shi, Hou, Xue, Wu and Dai2010; Ali et al., Reference Ali, Parviz, Mehdi, Hadi and Rouholah2015). Because the D-peak represented the defect ratio, greater values of I D were representative of more defects in the film. The range of the G- and D-peaks of the DLC film's Raman spectra was from 1200 to 1700 cm−1. Figure 7 shows that the samples still exhibited typical DLC spectra after laser irradiation. As the external electric field increased from 0 to 110 V/cm at a constant laser energy (1.56 J/cm2), the sp 2 hybrid (G) of the DLC film moved to the Takanami number, the content of the sp 3 hybrid bond in the DLC films was decreased, and the content of the sp 2 hybrid bond markedly increased. Under the same laser energy, the I D/I G ratio when the electric field density was 110 V/cm was less than the I D/I G ratio when no voltage was applied. Therefore, the degree of damage to the film was significantly decreased after the voltage was applied.
6. CONCLUSIONS
The LIDT of the DLC film under different electrode structures was compared on the basis of the LIDT testing platform developed by Xi'an Technological University. The changes in LIDTs were observed as the electric field intensity changed from 0 to 1000 V/cm. The 3D morphologies of the films were observed by a confocal microscope under an electric field of 220 V/cm. The Raman spectra of the DLC films were observed under laser energy densities of F = 0 and 1.56 J/cm2 and an electric field intensity of 110 V/cm. According to the film damage morphologies taken before and after a bias electric field was applied, the LIDT of the DLC film was obviously improved by the horizontal and longitudinal electric fields. The LIDT was also relatively improved by the increase in the applied voltage. Further increase in the electric field intensity did not significantly increase the LIDT. This method could reduce the transformation of the sp 3–sp 2 hybrid and prevent thin film formatting of sp 2 clusters (Xu et al., Reference Xu, Fan, Liu and Su2008; Liu et al., Reference Liu, Zhu and Luo2010). Moreover, the method can slow down the progress of DLC film graphitization and thereby noticeably improve the anti-laser damage ability of the film (Niu et al., Reference Niu, Zhang, Huang, Duan, Wang, He, Yu and Yao2005).
ACKNOWLEDGMENT
This research was supported by the National Natural Science Foundation of China (Grant No. 61205155 and 61378050) and the International Science & Technology Cooperation Program of China (2013DFR70620).
Supplementary material
To view supplementary material for this article, please visit http://dx.doi.org/10.1017/S0263034615001056.