Introduction
The European grapevine moth Lobesia botrana (Den. & Schiff., Lepidoptera: Tortricidae) represents one of the key insect pests in European viticulture. Lobesia botrana is known to be present throughout the Palaearctic as well as parts of the Oriental region and is widespread in all European grapevine growing regions today (Roehrich & Boller, Reference Roehrich, Boller, Van der Geest and Evenhuis1991; CABI/EPPO, 2012). In 2008, L. botrana was detected for the first time in Chile and Argentina (CABI/EPPO, 2012) and a year later in Napa County, California, USA, with subsequent records in nine additional counties in California (Gutierrez et al., Reference Gutierrez, Ponti, Cooper, Gilioli, Baumgartner and Duso2012). Damage is inflicted by first generation larvae feeding on flowers of grapevine plants as well as by second and subsequent generation larvae feeding on berries. Feeding of L. botrana larvae reduces yield and more importantly, creates infection sites for pathogens causing berry rotting such as Botrytis cinerea, Aspergillus spp. or Penicillium spp. or increases infestation of berries by fruit flies. Besides grapevine plants, additional plants from approximately 27 different families have been reported as suitable hosts for L. botrana larvae including the flax-leaved daphne Daphne gnidium (Thymelaeaceae) as well as olive trees Olea europaea (Oleaceae) (Thiéry & Moreau, Reference Thiéry and Moreau2005; Maher & Thiéry, Reference Maher and Thiéry2006). Most of these plants are native to the Mediterranean region and might represent the ancestral host plants of L. botrana since the Mediterranean basin is regarded as the putative geographic genetic origin of this species (Maher & Thiéry, Reference Maher and Thiéry2006). In line with this assumption, adaptation to grapes as a host plant is considered to have happened only relatively recently, as intense damage symptoms in vineyards have not been noticed prior to the beginning of the 20th century (Thiéry & Moreau, Reference Thiéry and Moreau2005). Moreover, going back to ancient literature, L. botrana was formerly reported to be restricted in its distribution to relatively warm grapevine cultivation areas (e.g., for Germany see Stellwaag, Reference Stellwaag1928), indicating a range expansion of L. botrana during the last 50–70 years, maybe due to climate change and rising overall temperatures. Future dispersal and range shifts of this species to other grapevine growing areas worldwide as a consequence of globalization as well as global warming are thus to be expected (Svobodova et al., Reference Svobodova, Trnka, Dubrovsky, Semeradova, Eitzinger, Stepanek and Zalud2014a , Reference Svobodova, Trnka, Zalud, Semeradova, Dubrovsky, Eitzinger, Štepanek and Brazdil b ). In addition, L. botrana population densities vary from year to year in various viticultural areas probably related to climatic conditions and might also change within relatively short distances (Roehrich & Boller, Reference Roehrich, Boller, Van der Geest and Evenhuis1991). Recently, Vogelweith et al. (Reference Vogelweith, Dourneau, Thiéry, Moret and Moreau2013) demonstrated a marked geographical variation in immune defences and extent of parasitism among different natural L. botrana populations, again indicating the high potential of this species to adapt locally to different biotic and abiotic selective forces. All these aspects make L. botrana a suitable model species for understanding genetic mechanisms of both range expansion and adaptation to host plants and local abiotic factors.
A prerequisite for understanding the population structure, dispersal capacity and overall genetic diversity of a given insect pest species is the availability of polymorphic molecular markers. Such markers have been used in the past to detect local host race formation and sympatric speciation of insect species (Michel et al., Reference Michel, Rull, Aluja and Feder2007; Groot et al., Reference Groot, Marr, Heckel and Schöfl2010), to understand the spread of insecticide resistance (Franck et al., Reference Franck, Reyes, Olivares and Sauphanor2007; Endersby et al., Reference Endersby, Ridland and Hoffmann2008; Gund et al., Reference Gund, Wagner, Timm, Schulze-Bopp, Jehle, Johannesen and Reineke2012), to define population genetic structures and dispersal patterns (Lozier et al., Reference Lozier, Roderick and Mills2009; Chen & Dorn, Reference Chen and Dorn2010; Torriani et al., Reference Torriani, Mazzi, Hein and Dorn2010) and to describe the global spread of a species as well as range expansion and colonization of new areas (Lombaert et al., Reference Lombaert, Guillemaud, Cornuet, Malausa, Facon and Estoup2010; Papura et al., Reference Papura, Burban, van Helden, Giresse, Nusillard, Guillemaud and Kerdelhue2012). Microsatellite markers (simple sequence repeats (SSRs)) are among the most frequently used genetic markers for these purposes as they are co-dominant, usually show a high degree of polymorphism and thus have high information content. However, isolation and development of SSR markers has been time-consuming and difficult so far, limiting the availability of SSR markers for genetic analysis of many target pest insects (Sinama et al., Reference Sinama, Dubut, Costedoat, Gilles, Junker, Malausa, Martin, Neve, Pech, Schmitt, Zimmermann and Meglécz2011; Schoebel et al., Reference Schoebel, Brodbeck, Buehler, Cornejo, Gajurel, Hartikainen, Keller, Leys, Říčanová, Segelbacher, Werth and Csencsics2013).
In the past, seven SSR markers have been described for L. botrana by Amsellem et al. (Reference Amsellem, Risterucci and Benrey2003), however they have not been applied to population genetic studies in this insect so far. In a preliminary study carried out in our laboratory with different European L. botrana populations, amplification was possible for only three of these seven markers, despite intensive modifications of amplification conditions. Here, we report on the development of a novel set of SSR markers for L. botrana using a next-generation sequencing technique and apply these markers to describe genetic structures and diversities in European populations of this pest insect.
Material and methods
Sampling
Lobesia botrana adults and larvae were collected from 14 vineyards located in 6 different countries between 2007 and 2012. The samples included three populations from Germany, one population from Spain, three populations from the Veneto region in Northeastern Italy, two populations from Syria, one population from Israel and four populations from Turkey (table 1, fig. 1). The term ‘population’ refers to samples taken from the same location. In all locations except for location I_MEO, adults were gathered by the use of pheromone traps. In vineyards of location I_MEO larvae were collected by the direct sampling from infested grape bunches. Individuals were stored in 95% ethanol for shipping and at −20°C until DNA extraction.
Map of Europe with Lobesia botrana collection sites. For abbreviation and details of collection sites see table 1.

Geographic origin and population genetic statistics for 14 Lobesia botrana populations analysed by mean values over 10 SSR loci including total number of individuals (N), number of alleles (A) including standard deviation (SD), observed (HO) and expected (HE) heterozygosity and multilocus estimates of F IS. Collection was achieved via pheromone trapping of adults, except for location Meolo (I_MEO) where larvae were collected.

1 Denotes significance at P < 0.005.
DNA extraction
Total genomic DNA was extracted from adults and larvae using a CTAB-based method (Reineke et al., Reference Reineke, Karlovsky and Zebitz1998) modified by the addition of an isopropanol precipitation step. DNA concentration was measured spectrophotometrically and DNA preparations were stored at −20°C.
Microsatellite marker generation
For initial generation of SSR markers via 454 pyrosequencing, DNA was isolated from the head and thorax of 10 adult L. botrana individuals obtained from a laboratory rearing at Geisenheim University as described above. Individual DNA was pooled in equimolar amounts and a total of 5 μg DNA was subjected to 454 pyrosequencing. Microsatellite identification and 454 pyrosequencing were performed commercially at Ecogenics, CH. In a first step, the size-selected fragments from genomic L. botrana DNA were enriched for SSR content using magnetic streptavidin beads and biotin-labelled CT and GT repeat oligonucleotides. The SSR-enriched library was then analysed on a Roche 454 platform using the GS FLX Titanium reagents. In total, 4171 reads were obtained, which had an average length of 153 base pairs. Of these, 1074 contained a microsatellite insert with a tetra- or a trinucleotide of at least 6 repeat units or a dinucleotide of at least 10 repeat units. Applying a stringent set of criteria in a tailor-made pipeline (property of Ecogenics) based on the Primer 3 core code (available from http://primer3.sourceforge.net/releases.php) design of primers flanking the microsatellite motifs was possible in 217 reads. A set of 20 oligonucleotide primer pairs having the highest probability of being functional were accordingly picked and tested for polymorphism in the present study.
Polymerase chain reactions (PCR) analysis, primer validation and population genetic analysis
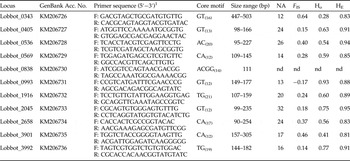
The 20 obtained microsatellite markers were initially classified according to their performance and degree of polymorphism in four different L. botrana populations, each including four individuals using the conditions described below. Markers having a strong tendency to form stutter peaks or an intensive background were excluded from this initial screening. With the remaining set of 11 SSR markers (table 2) a total of 314 L. botrana individuals were analysed in PCR. Amplifications were carried out in 15 μl reaction volumes containing 40 ng of the DNA template in a Bio-Rad C1000 thermal cycler. To allow a fluorescent labelling of the generated PCR products, three primers were incorporated in the PCR reactions according to the method described by Schuelke (Reference Schuelke2000): 2 pmol of a SSR-specific forward primer with an universal M13(-21) tail at its 5′-end (5′-TGTAAAACGACGGCCAGT-3′), 5 pmol of an unlabelled SSR-specific reverse primer, and 5 pmol of a fluorescently labelled universal M13(-21) primer, which will incorporate the fluorescent dye into the PCR product (Schuelke, Reference Schuelke2000). For multiplexing of the reactions for capillary electrophoresis this M13(-21) primer was either labelled with BMN5 blue (Lobbot_0838, Lobbot_1916, Lobbot_2045, Lobbot_2658), DY-751 black (Lobbot_0405, Lobbot_3901, Lobbot_3992) or DY-681 green (Lobbot_0343, Lobbot_0536, Lobbot_0569, Lobbot_0993). Cycling conditions were according to the following PCR program using the Phire Hot-Start DNA Polymerase (Biozym): initial denaturation and hot-start step at 98°C for 30 s, followed by 35 cycles of 98°C for 5 s, 58°C for 15 s and 72°C for 15 s, additional 8 cycles of 98°C for 15 s, 53°C for 15 s and 72°C for 15 s and a final extension at 72°C for 10 min.
Microsatellite loci identified via 454 pyrosequencing in the European grape berry moth Lobesia botrana. Single locus statistics such as observed size range of alleles, number of alleles (NA), average F IS and observed (HO) and expected (HE) heterozygosity were averaged over 14 different L. botrana populations.

1 The first 18 bp of the forward primers used in the present study are not shown as they correspond to an universal M13(–21) tail used for fluorescently labelling the PCR products during the reactions. nd = not determined as marker was monomorphic in all populations analysed.
PCR products were analysed for SSR allele size via capillary electrophoresis on a GenomeLab GeXP DNA Genetic Analysis System (Beckman). Reactions were loaded as a multiplex analysis and included PCR products of three different fluorescently labelled primers (products of primers labelled with BMN5 blue, DY-751 black and DY-681 green). Most of the PCRs were repeated at least twice to check the reproducibility of amplified microsatellite markers. Allele sizes were determined using GenomeLab GeXP Version 10.2 (Beckman) software.
Statistical and population genetic data analysis
Descriptive statistics such as average number of alleles per locus obtained with the respective microsatellite marker or observed (HO) and expected heterozygosities (HE) as well as deviations from Hardy–Weinberg equilibrium (HWE) at each locus were calculated using Cervus version 3.0.3 (Kalinowski et al., Reference Kalinowski, Taper and Marshall2007). For each L. botrana population, Arlequin version 3.5 (Excoffier & Lischer, Reference Excoffier and Lischer2010) was used to calculate HO and HE and to test for HWE. To investigate population differentiation, a global estimate of F ST as well as population pairwise measures of F ST were estimated and tested for significance using FSTAT version 2.9.3.2 (Goudet, Reference Goudet1995). A Bonferroni correction for multiple comparisons (Rice, Reference Rice1989) was applied to all P values from F ST estimates. The program Genepop version 4.2 (Raymond & Rousset, Reference Raymond and Rousset1995) was used to estimate the inbreeding coefficient (F IS) and to test for the presence and frequency of null alleles in the populations. A correction for the positive bias induced by presence of null alleles in the data set on F ST estimates was performed using the program FreeNA (Chapuis & Estoup, Reference Chapuis and Estoup2007). To test for an isolation by distance among the L. botrana samples, a Mantel test was performed using the Isolation by Distance Web Service, version 3.23 (Jensen et al., Reference Jensen, Bohonak and Kelley2005).
Using a Bayesian-based method in the program Structure version 2.3.3 (Pritchard et al., Reference Pritchard, Stephens and Donnelly2000) the best-fit number of genetic populations (K) in the dataset was calculated. This method assigns individuals to an initially unknown number of K populations if their genotypes indicate that they are admixed, ignoring any prior data on sampling locations. The model used for all Structure analyses was based on an assumption of admixed ancestry and correlated allele frequencies among populations (Falush et al., Reference Falush, Stephens and Pritchard2003). To estimate the most probable number of populations, initially 10 independent runs for each K from 1 to 10 were carried out with 10,000 burn-in steps followed by 10,000 MCMC (Markov Chain Monte Carlo) iterations (Pritchard et al., Reference Pritchard, Stephens and Donnelly2000). Subsequently, the method described by Evanno et al. (Reference Evanno, Regnaut and Goudet2005) implemented in the program Structure Harvester (Earl & vonHoldt, Reference Earl and vonHoldt2012) was used to infer the most likely value of K. Simulations in the program Structure were then run again for the most likely K with a burn-in period of 50,000 steps and 100,000 MCMC iterations.
Cross-species transferability of isolated SSR markers
Amplification of the 11 SSR markers isolated from L. botrana and thus conservation of primer sequences was tested in three other lepidopteran species of the family Tortricidae, i.e., codling moth Cydia pomonella, plum fruit moth Cydia funebrana and grapevine moth Eupoecilia ambiguella. Two adult individuals per species obtained from laboratory cultures of the respective insect species were used for DNA extraction, PCR amplification and marker screening as described above.
Results
Suitability and cross-species transferability of SSR markers
Of the 20 markers analysed in an initial marker screening, 11 showed stable and reproducible amplification patterns with distinct peaks present in capillary electrophoresis (table 2). The other nine markers either failed to amplify at all in most of the four populations assessed in the preliminary screening or contained a lot of stutter bands and were therefore discarded from further analysis. One of the 11 markers (Lobbot_0838) was monomorphic in all L. botrana populations analysed in the present study and data were thus not included in the subsequent analysis.
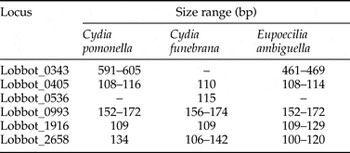
Over all 14 L. botrana populations analysed the remaining 10 SSR markers amplified between 12 and 32 different alleles per locus (table 2). Observed heterozygosities per locus ranged from 0.28 to 0.93 and were lower to those expected under Hardy–Weinberg equilibrium, indicating a deficiency of heterozygotes in the analysed L. botrana populations and/or the presence of null alleles. A heterozygous deficit is also indicated with positive F IS values obtained for all but one primer (table 2). Estimated frequencies of null alleles were variable depending on the respective SSR marker and L. botrana population (table 3) and varied between 0 and 42%. Overall low frequencies were recorded e.g. for markers Lobbot_0993 (2%) or Lobbot_3992 (7%), however, for both markers single populations showed higher frequencies (e.g., D_KAI with 25% null alleles in Lobbot_0993 or SY_AR with 20% in Lobbot_3992). High overall proportions of null alleles were evident for markers Lobbot_0343 (29%) or Lobbot_3901 (22%); however, in particular for Lobbot_3901 single populations varied extremely in their frequency of detected null alleles (e.g., populations I_RON and T_MCA showing 0% null alleles with marker Lobbot_3901, while IL_MG and D_LEI had about 40% null alleles; table 3). Of the 11 SSR markers developed in this study for L. botrana, 6 amplified successfully in some or all of the three other tortricid species assessed in this study (table 4) indicating that respective primer sequences and repeat motifs are conserved within members of this family.
Null allele frequencies for each of the 10 polymorphic SSR markers and each Lobesia botrana population including the average null allele frequency F(0). For population codes see table 1.

Amplification and size range of isolated Lobesia botrana SSR markers in three other members of the family Tortricidae. Two individuals per species were tested for positive amplification. Only loci that amplified in at least one species are shown. Amplification failure is indicated by a dash.

Diversity and structure of European and Middle East L. botrana populations
In total, 198 different alleles were scored for the 10 SSR loci in 14 L. botrana populations (314 individuals) with a mean number of 10.2 alleles amplified per locus and population (table 1). Observed heterozygosities ranged from 0.41 to 0.73 (table 1) with a mean value of 0.56 across all loci and populations.
Averaged over all 10 loci, F IS was significantly greater than zero in 12 of the 14 L. botrana populations analysed (P < 0.005), indicating a heterozygote deficit in these populations (table 1). Two Italian populations were characterized by a relatively small F IS value, indicating that these populations are at or near Hardy–Weinberg equilibrium and thus inbreeding can be assumed to be insignificant in these populations.
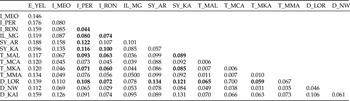
The overall F ST value of 0.075 (95% confidence interval (CI) of 0.045–0.114 determined by 1000 bootstraps over all loci) suggested a moderate but significant genetic differentiation between the 14 L. botrana populations included in this study. If null alleles were excluded from the analysis according to the method described by Chapuis & Estoup (Reference Chapuis and Estoup2007) and using program FreeNA the global F ST value was similar (F ST = 0.074, 95% CI of 0.04–0.111) suggesting that the presence of null alleles in the dataset had no impact on the accurate estimation of F ST. Of the 91 pairwise F ST values calculated among the 14 populations, 18 were significantly different from zero after Bonferroni correction (at α = 0.0005) (table 5). Pairwise F ST values were in all cases comparable when the refined estimation method excluding null alleles (Chapuis & Estoup, Reference Chapuis and Estoup2007) was used (data not shown). Twelve of the population pairs with significant genetic differentiation included two of the three analysed populations from Italy. The highest significant F ST values were found between the two populations from Syria, which showed significant genetic differentiation at a moderate to pronounced level to a population in Italy (I_PER) and Germany (D_LOR), respectively, with F ST values around 0.12.
Pairwise F ST estimates between populations of Lobesia botrana (for details on locations and code see table 1). Bold typeface denotes pairwise F ST estimates that are significantly different from zero after Bonferroni correction (at α = 0.000549).

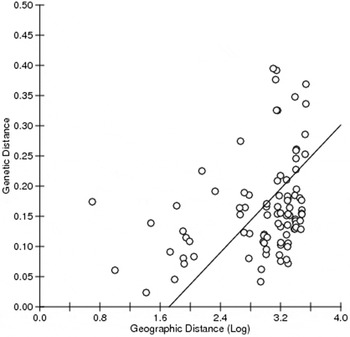
A Mantel test of isolation by distance showed a highly significant association between the linearized F ST values and the logarithmic values of the geographic distance between all 14 L. botrana populations analysed in this study (r = 0.335, P < 0.001) (fig. 2).
Regression of Slatkin's linearized genetic distance against the logarithm of the geographical distance (km) indicating the existence of a significant isolation by distance between the Lobesia botrana populations.

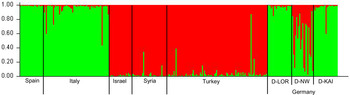
Assignment of L. botrana individuals to clusters using software Structure and multiple Structure simulations indicated that the given data set most likely represented K = 2 genetically defined clusters, supported by the calculated ΔK values (Evanno et al., Reference Evanno, Regnaut and Goudet2005) (fig. 3). Assignment of the L. botrana individuals to these two genetic groups was in general consistent with the geographic origin of the respective population, as one cluster (denoted in green colour in fig. 3) represented the populations from Europe included in the present analysis (Spain, Italy and Germany), while individuals obtained from the Middle East (Israel, Syria and Turkey) were in most of the cases assigned to the second cluster (denoted in red colour in fig. 3). However, in particular individuals from the German population D_NW did not follow this overall pattern as half of the individuals of this population were assigned to either of the two clusters with a probability of ca. 50%.
Bayesian assignment of Lobesia botrana individuals from different sampling locations to each of the K = 2 identified clusters (green: cluster 1; red: cluster 2). Each bar represents the estimated membership coefficient (Q) for each individual in each cluster. Countries of origin are indicated at the bottom of the graph. For abbreviation and details of collection sites see table 1.

Discussion
Microsatellites are widely known as powerful and easy to score co-dominant markers and are thus the most commonly used markers for population genetic studies in a vast variety of organisms. However, so far, their isolation has been difficult and time-consuming and was therefore a major hurdle in particular for non-model organisms lacking a full genome sequence (Schoebel et al., Reference Schoebel, Brodbeck, Buehler, Cornejo, Gajurel, Hartikainen, Keller, Leys, Říčanová, Segelbacher, Werth and Csencsics2013). Here, we successfully applied a high-throughput 454 pyrosequencing approach for the isolation of SSR markers in the non-model lepidopteran grapevine pest species L. botrana. Among 1074 reads containing a microsatellite insert which fulfilled a given set of criteria, this approach allowed the selection of 217 sequences for which suitable primer design was possible. This number is substantially higher than numbers previously achieved through standard cloning procedures (Zane et al., Reference Zane, Bargelloni and Patarnello2002; Zhang, Reference Zhang2004) and is in accordance with other recently published studies using the same SSR marker isolation approach (e.g., Dobes & Scheffknecht, Reference Dobes and Scheffknecht2012). In this study, we decided to design primers for a limited number of 20 sequences having the highest probability of being functional, thus the overall efficiency of our approach to isolate SSR markers in this lepidopteran non-model species might be higher, if additional markers will be developed and tested based on the excluded set of obtained sequences.
Of the 20 SSR markers tested in this study, 11 showed stable amplification patterns with one of the markers being monomorphic in all populations analysed during an earlier pre-screening of the markers. This marker was thus not included in the subsequent analysis. The remaining set of nine SSR markers either failed to amplify in individuals included in the previous marker screening or showed a pronounced level of stutter bands or indistinct peaks in capillary electrophoresis. Isolation of SSR markers in Lepidoptera has been shown to be particularly difficult due to similarities of regions flanking microsatellite loci or due to a multiplication of microsatellite loci as a consequence of the presence of mobile genetic elements (Meglécz et al., Reference Meglécz, Petenian, Danchin, D'Acier, Rasplus and Faure2004, Reference Meglécz, Anderson, Bourguet, Butcher, Caldas, Cassel-Lundhagen, d'Acier, Dawson, Faure, Fauvelot, Franck, Harper, Keyghobadi, Kluetsch, Muthulakshmi, Nagaraju, Patt, Péténian, Silvain and Wilcock2007; Zhang, Reference Zhang2004; Sinama et al., Reference Sinama, Dubut, Costedoat, Gilles, Junker, Malausa, Martin, Neve, Pech, Schmitt, Zimmermann and Meglécz2011). In addition, high null-allele frequencies and heterozygote deficits have been reported in many studies on SSR markers in Lepidoptera including L. botrana in the past (Amsellem et al., Reference Amsellem, Risterucci and Benrey2003; Ji et al., Reference Ji, Zhang, Hewitt, Kang and Li2003; Franck et al., Reference Franck, Guerin, Loiseau and Sauphanor2005; Van't Hof et al., Reference Van't Hof, Zwaan, Saccheri, Daly, Bot and Brakefield2005; Espinoza et al., Reference Espinoza, Fuentes-Contreras, Barros and Ramirez2007; Sinama et al., Reference Sinama, Dubut, Costedoat, Gilles, Junker, Malausa, Martin, Neve, Pech, Schmitt, Zimmermann and Meglécz2011). Presence of null-alleles may overestimate population differentiation and might hamper cross-species but also cross-population transferability and thus application of these markers in population genetic studies (Chapuis & Estoup, Reference Chapuis and Estoup2007). For the set of markers developed in this study, average null allele frequencies of more than 20% were evident for two of the 10 polymorphic SSR markers tested, with a high degree of variability of null allele frequencies depending on the locus-population combination. Moreover, presence of null alleles did not introduce a bias in our dataset and did thus not result in an overestimation of global and pairwise F ST values in L. botrana populations. With six SSR markers stable amplification patterns were obtained with DNA isolated from three other closely related tortricid species, despite the presence of null alleles at these loci in some L. botrana populations.
In 12 of the 14 L. botrana populations included in this study a significant heterozygote deficit was evident which might be due either to the presence of nonamplifying (or null) alleles as discussed above or due to factors related to the reproductive biology and dispersal capability of L. botrana. Usually, adult moths do not migrate over substantial distances but rather tend to mate with individuals nearby in the vineyard right after emergence from pupae. Male moths show an aggregated distribution pattern with a range of displacement between 50 and 170 m being reported in various studies (Schmitz et al., Reference Schmitz, Roehrich and Stockel1996; Sciarretta et al., Reference Sciarretta, Zinni, Mazzocchetti and Trematerra2008). Accordingly, inbreeding could account for the observed homozygote excess in the populations, which is supported by the significant and positive F IS values in our dataset. Alternatively, a sampling bias might have caused the apparent heterozygote deficiency, commonly known as the Wahlund effect (if in large populations containing subpopulations genetic data from subpopulations are combined a higher proportion of homozygotes will be present than if the subpopulations were analysed separately). As sampling was mainly achieved via pheromone-trapping of adults, we might have actually sampled individuals from neighbouring vineyards and/or from subpopulations established on bushes and other vegetation surrounding the respective vineyards, which might lead to a Wahlund effect.
The global F ST value of 0.075 among all L. botrana populations as well as the pair-wise F ST values reported here are in the range of values reported in microsatellite studies of a close relative of L. botrana, the codling moth Cydia pomonella (Franck et al., Reference Franck, Reyes, Olivares and Sauphanor2007; Chen & Dorn, Reference Chen and Dorn2010; Voudouris et al., Reference Voudouris, Franck, Olivares, Sauphanor, Mamuris, Tsitsipis and Margaritopoulos2012). However, in contrast to results of most studies on C. pomonella we found a clear geographic structure in our samples, evident through a significant isolation by distance and through results from structure analysis. In the later, L. botrana populations were grouped according to their European or Middle Eastern origin in two clearly separated clusters. This indicates both a regional adaptation of local populations to the given abiotic conditions in the respective habitat as well as a limited human-aided dispersal, resulting for example from the global trade of plant material or the exchange of harvester machines between different countries.
With the novel set of microsatellite markers developed in this study future research will now be possible on the evolutionary ecology of this species including host shifts and host adaptation as well as spread of individuals within Europe. Availability of these markers is also important for defining source populations in case this species is again introduced into new areas as it has recently happened in South America and California. Tracking introduction pathways with the aid of molecular markers is a central component towards preventing future worldwide spread of this grapevine pest species.
Acknowledgements
We sincerely thank our colleagues in Europe for help in collecting L. botrana specimens, in particular Berthold Fuchs (D_LOR), Gertrud Wegener-Kiß (D_KAI), Karl-Josef Schirra and Ursula Hetterling (D_NW), Özlem Altindişli (T_MAL, T_MCA, T_MLA, T_MMA), Tirtza Zahavi (IL_MG), Bruno Bagnoli and Andrea Lucchi (E_YEL). Thanks to Mirjam Hauck for help in the laboratory and Cariparo (Padova) for supporting PhD studies of Haya Abou-Assaf.