Introduction
Chemical energy storage from natural energy is an important technique for future energy management in order to overcome fluctuations in natural energy and achieve long-distance energy transportation. Especially, solar to hydrogen is expected to serve as a key technique for maintaining the balance between electricity generation and demands.[Reference Fujii, Nakamura, Watanabe, Bagheri, Sugiyama and Nakano1] However, from the material design point of view, the mechanism of electrochemical catalysts for water splitting has not been clarified. Especially, the design of water oxidation catalysts is said to be difficult due to their four-electron transfer reaction. Recently, in addition to well-known binary CoO, NiO, and MnO water oxidation catalysts, ternary Fe compounds with these binaries have been reported to be good catalysts for water oxidation.[Reference McCrory, Jung, Peters and Jaramillo2, Reference Galán-Mascarós3] Their water oxidation improvement mechanism is, however, still unclear. For instance, it is not known whether these catalysts reduce the excited carrier recombination and/or improve photoelectrochemical reactions.
Photoelectrochemical evaluation is a useful means of investigating the water oxidation process and exploring the methods for designing electrochemical catalysts. In particular, the analyses of the carrier transfer mechanism from the semiconductor photoelectrode to the electrochemical catalyst and vice versa, and chemical reactions of electrochemical catalysts are a good start for learning about the roles of electrochemical catalysts.
For the above reason, hereafter discussions are focused on photoelectrochemical reactions. The order of energy level is important in the carrier transportation from a photoelectrode to a redox reactant in an electrolyte or vice versa because the electrons and holes move toward lower energy levels. In addition, the electron orbitals of the reaction site and reactant molecules need to be overlapping since the electron transportation between the electrode and electrolyte is assumed to include some tunneling process even if the reactant ions are adsorbed onto the electrode surface. It is well known that the electron capture site is required in the electrode for water oxidization to oxygen. Thus, light-excited valence band edge of n-type semiconductors, where generated holes by light illumination exist, is an ideal candidate for electron capture (or hole donor to a reactant) in water oxidation. However, it is clear that the valence band edges of conventional oxide semiconductors are too deep for the water oxidation tunneling process from the energy level point of view.[Reference Nozik and Memming4] This indicates that the holes trapped in the intermediate state at the surface play a role in water oxidation, which has been proposed since the start of photoelectrochemical studies.[Reference Memming5, Reference Winnerl, Garrido and Stutzmann6]
The actual observation of the mechanism of the water oxidation process is, however, difficult because the circumstances of use of the catalyst are complicated and are difficult to build models of these circumstances. Since the use of single crystal semiconductor photoelectrodes for evaluating the effects of the electrochemical catalyst is one way of simplifying these circumstances, the NiO electrochemical catalyst was used on single crystal n-type GaN on sapphire substrates in this study.
In our experiments, the analysis of the carrier transfer mechanism between bare n-type GaN and aqueous electrolyte clarified that GaN holes trapped in the intermediate state play an important role in water oxidation. The intermediate state in which holes are trapped is said to be related to the yellow luminescence (YL) observed in photoluminescence (PL) measurement, which has a broad peak located at around 2.2 eV. In the intermediate state, excited holes have an extremely long carrier lifetime of μs to ms order and their energy levels are close to the water oxidation–reduction energy level.
The electrochemical catalyst of NiO is reported to be a p-type semiconductor with a 3.56 eV band gap. The p-type characteristic is due to the nonstoichiometric property of the Ni vacancy.[Reference Sasi, Gopchandran, Manoj, Koshy, Rao and Vaidyan7] The band structure is complicated because of the existence of d-orbital given that Ni is a transition metal. One example of band structure complexity is the d–d transition of the electron. This is related to the transition of an electron from low-energy d-orbital to high-energy d-orbital, which are split by asymmetric fields, by light absorption and vice versa by luminescence.
In NiO island-like loading on n-type GaN, the NiO islands covering some parts of the GaN surface improve photoanodic current and prevent its photoanodic corrosion.[Reference Hayashi, Deura and Ohkawa8–Reference Koike, Yamamoto, Ohara, Kikitsu, Ozasa, Nakamura, Sugiyama, Nakano and Fujii12] Thus, the carrier transfer mechanism from GaN to NiO is mainly discussed in this report using a band lineup model and optical measurements.
Experiments
In this study, experiments were conducted using the NiO layer and island structures on the SiO2 glass, sapphire, and n-type GaN on sapphire substrates.[Reference Koike, Yamamoto, Ohara, Sugiyama, Nakano and Fujii11] The GaN single crystal layer grown by MOVPE (metal-organic vapor phase epitaxy) consisted of a 2.0 µm n-type layer (2.0 × 1017 cm−3) grown on a 2.0 µm undoped layer, which is deposited on a (0001) sapphire substrate.
We used synthetic Ni(OH)2 dispersed solution to form the NiO islands. The solution was synthesized as follows: 15 mL DI (deionized) water and 5 mL 1.0 M KOH were added to 2 mmol nickel nitrate hexahydrate solution. After that, the product was separated by centrifugation and mixed with ethanol to prepare 0.02 M solvent. The Ni(OH)2 dispersed solution was applied to a substrate surface as a coating using a spin coater. After that, the sample was annealed at 280 °C for 1 h in a nitrogen atmosphere. Analysis by STEM (scanning transmission microscopy)[Reference Koike, Yamamoto, Ohara, Kikitsu, Ozasa, Nakamura, Sugiyama, Nakano and Fujii12] showed that the NiO island is about sub-μm to μm order in size, and consists of nm-sized single NiO crystals.
The NiO layer sample was prepared in a similar way by using NiO-MOD (metal-organic decomposition). Specifically, the NiO-MOD solution (Ni-O3 dip coat-precursors made by KOJUNDO Chemical Laboratory) was coated on a substrate surface using a spin coater and annealed at 120 °C for 10 min using a hotplate. The concentration of the NiO-MOD solution was 3 wt%. After that, the sample was annealed at 500 °C for 30 min in a nitrogen atmosphere. The thickness of the NiO layer was estimated to be a few hundred nm.[Reference Koike, Yamamoto, Ohara, Kikitsu, Ozasa, Nakamura, Sugiyama, Nakano and Fujii12]
In order to prepare the contacts for photoelectrochemical evaluation, indium electrodes with the epoxy cover were coated on the GaN surfaces in the area without NiO-loading. The indium electrodes area was covered using Kapton tape when the NiO precursors were loaded. The counter and reference electrodes were Pt wire and Ag/AgCl/NaCl, respectively for checking the flatband potential. Only the Pt wire was used for the two-electrode measurement without bias application. The light source used was a 500 W Xe-lamp and was controlled to 100 mW/cm2 on the working electrode surface. The electrolyte was 1.0 M NaOH (pH 13.6). The electrolyte of 0.5 M H2SO4 (pH 0.5) was also used for the flatband evaluation. A potentiostat was used for measuring the electrochemical and photoelectrochemical properties. Atomic force microscope (AFM) was used for the surface observation of the samples. PL excited by 325.0 nm He–Cd laser and photoabsorption with Xe-lamp at room temperature under ex situ conditions were also used in the evaluation.
Results and discussion
Photoelectrochemical properties of NiO on n-type GaN
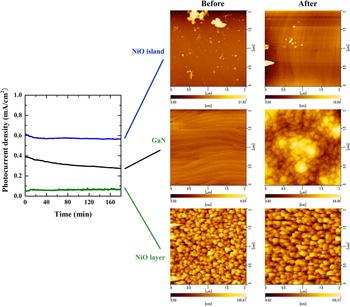
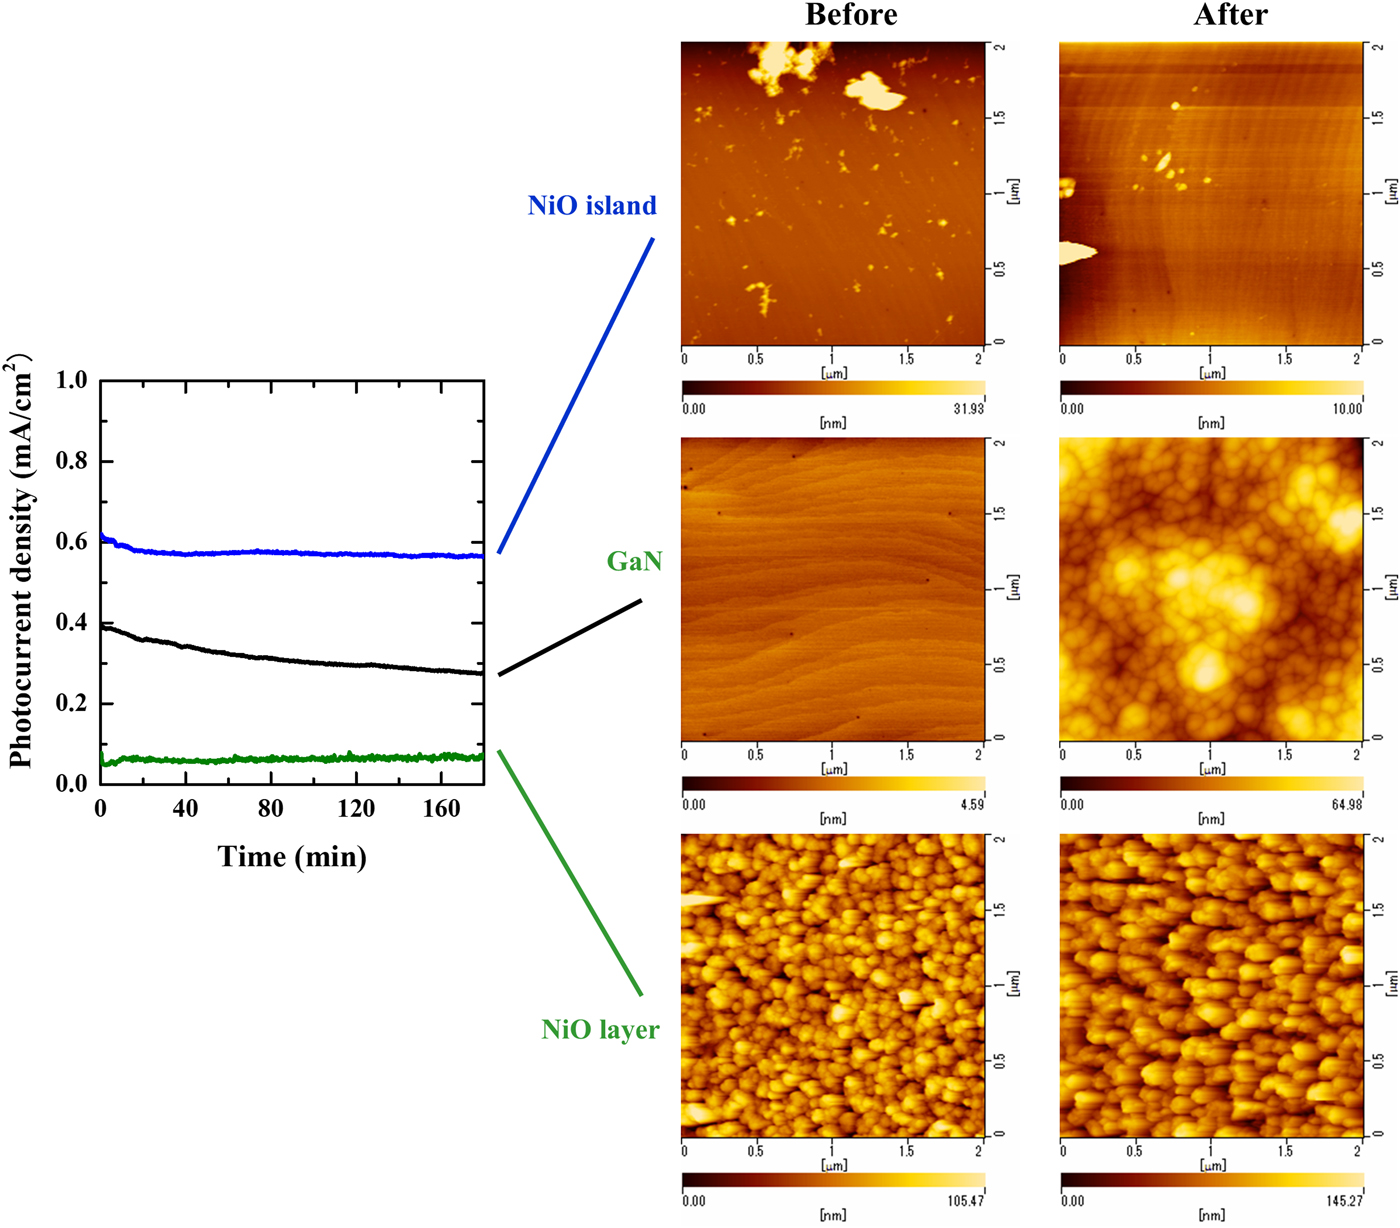
Experimental photoelectrochemical properties of the NiO layer and islands on n-type GaN compared with those of bare n-type GaN are shown in Fig. 1. Since the measurements were performed in 1.0 M NaOH aqueous electrolyte under two-electrode configuration without bias application, the Pt counter electrode was the same and the depth into the electrolyte was also the same in order to keep the same conditions for the counter electrode. The photocurrent density of the NiO island sample was higher than that of bare GaN; however, the photocurrent density of the NiO layer sample was lower than that of bare GaN. AFM observation revealed that the surface of the NiO island and NiO layer samples did not change before and after reactions. The surface of the NiO island sample was smooth except in the NiO island region. On the other hand, the surface of the NiO layer sample was rough due to NiO deposition. The surface of the bare GaN sample became rough after the reactions due to its anodic corrosion.
Photocurrent density trend and AFM results before and after reactions. The samples are NiO island on n-type GaN, NiO layer on n-type GaN, and bare n-type GaN. The photocurrents were observed under two-electrode configurations using with the same Pt counter electrode. The illuminated light intensities were 100 mW/cm2 Xe-lamp. The electrolytes were 1.0 M NaOH (pH 13.6) and biases were not applied.
Band structures of NiO and GaN
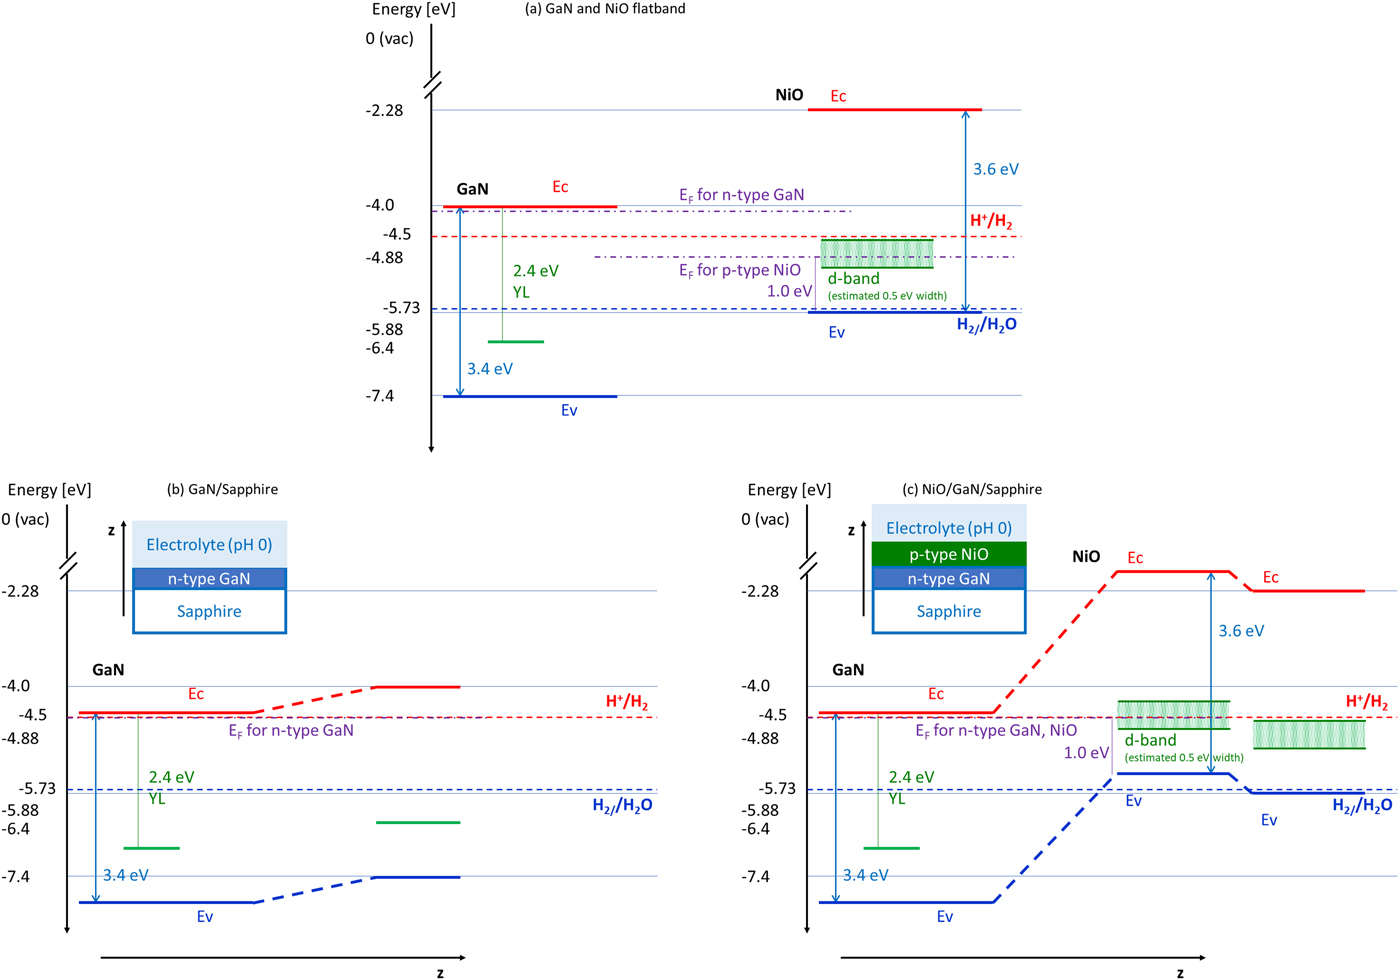
Although the photocurrent measurements of Fig. 1 were performed with pH at around 14, the pH of the discussion of this section is based on 0. The band structures of pH 0 and pH 14 are believed to be almost the same because the Nernst relationship of GaN is very similar with that of water.[Reference Fujii and Ohkawa13, Reference Fujii and Ohkawa14] In order to evaluate the carrier transfer at the photoelectrode surface of NiO on GaN, the flatband condition and band alignment of NiO and GaN are required. The flatband condition and band structure of GaN have already been well evaluated[Reference Fujii and Ohkawa13, Reference Fujii and Ohkawa14] but those of NiO are not clear. Under our experimental conditions, the flatband condition of NiO is difficult to evaluate because the NiO is located on GaN and it is very thin with the shape of an isolated island. Given that the properties of GaN are basically dominant in our experimental evaluation (slightly shift in negative direction). In the case of the NiO layer, the evaluation of flatband potential by the impedance measurements of the NiO layer sample was not possible due to the existence of solid heterostructure between GaN and NiO and/or the high resistivity of the NiO layer. The flatband condition of NiO needs to be estimated using other approaches. One effective estimation method is the use of calculated energy of band gaps and electron affinity with hydrogen-terminated surface. Since the state of the surface structure is close to that of the electrode attached to the pH 0 electrolyte, the absolute value of the band edge energy is close to the flatband energy at pH 0.[Reference Van de Walle and Neugebauer15] Based on this assumption, the band edge energy position of NiO was used to calculate the band gap of 3.7 eV and electron affinity of 2.28 eV.[Reference Toroker, Kanan, Alidoust, Isseroff, Liaob and Carter16] Since the band edge position is varied in experiments and its theoretically calculated results are inconsistent, these values are used as typical values.[Reference Sasi, Gopchandran, Manoj, Koshy, Rao and Vaidyan7, Reference Toroker, Kanan, Alidoust, Isseroff, Liaob and Carter16–Reference Irwin, Buchholz, Hains, Chang and Marks20] The positions of GaN evaluated experimentally and NiO assumed from the theoretical calculation are shown in Fig. 2(a).[Reference Sasi, Gopchandran, Manoj, Koshy, Rao and Vaidyan7, Reference Fujii and Ohkawa13, Reference Fujii and Ohkawa14, Reference Toroker, Kanan, Alidoust, Isseroff, Liaob and Carter16–Reference Reshchikov and Morkoç21] Holes trapped in the intermediate state associated with YL in GaN and d-band of NiO are also shown in Fig. 2(a). The origin of the d-band of NiO is the energy position of the theoretically estimated oxygen vacancy of NiO and the band energy level is assumed to be about 1 eV above the valence band edge in Fig. 2(a).[Reference Sokolov, Pustovarov, Churmanov, Ivanov, Gruzdev, Sokolov, Baranov and Moskvin18] Reported d-band positions also vary. The existence of d-band positions is assumed from the reported p-type NiO with oxygen vacancy. They have not been observed from undoped stoichiometric NiO.[Reference Sokolov, Pustovarov, Churmanov, Ivanov, Gruzdev, Sokolov, Baranov and Moskvin18–Reference Irwin, Buchholz, Hains, Chang and Marks20] This estimation shows that the energy of the valence band edge of NiO is close to that of water oxidation–reduction.
(a) Flatband condition energy level relationships of conduction (Ec), valence (Ev), and hole trap level associated with yellow luminescence (YL) for GaN, and conduction (Ec), valence (Ev) and d-band for NiO. The Fermi levels (EF) are plotted with the assumption of n-type GaN and p-type NiO. The d-band position related to the Fermi level (EF) and the width is assumed to be at 1.0 eV or above from the valence band edge and 0.5 eV. The redox energy levels of water oxidation (O2/H2O) and reduction (H+/H2) are also plotted. This band relationship shows the band alignment at the surface direction (x–y plane) of GaN and NiO dot. (b) Energy level alignment for n-type GaN attaching to pH 0 electrolyte. The plotted band energies (z-axis) are those for the n-type GaN deep inside from the interface of electrode and electrolyte (left), and the n-type GaN at the interface (right). The Fermi level of n-type GaN is assumed to be the same as the redox energy level of water reduction due to pH 0. (c) Energy level alignment for p-type NiO on n-type GaN attaching to pH 0 electrolyte. The plotted band energies (z-axis) are those for the n-type GaN (right) and p-type NiO (middle) which are far from the GaN and NiO interface, which are deep from the interface of electrode and electrolyte, and that for the NiO (left) at the interface of electrode and electrolyte. The Fermi level of p-type NiO and n-type GaN is assumed to be the same as the redox energy level of water reduction due to pH 0.
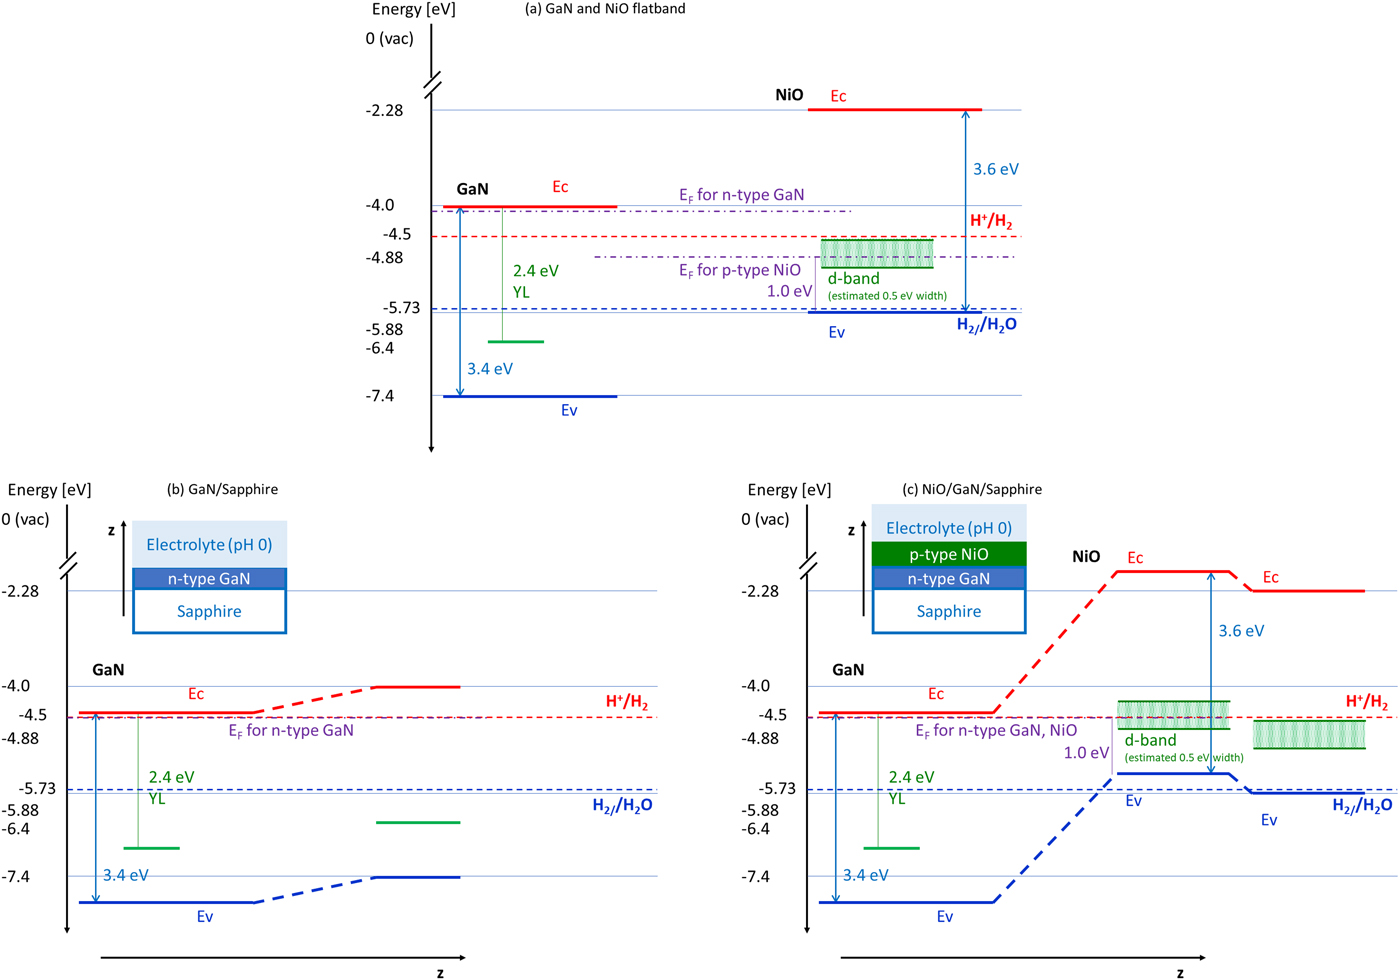
When a semiconductor is dipped into an electrolyte, the Fermi level of the semiconductor coincides with the chemical potential energy of the electrolyte. Although the chemical potential of the electrolyte is the summation of each redox potential in the electrolyte, the chemical potential can be assumed to be the water reduction potential when the water-related material is regarded as the dominant reactant and the reaction is water reduction. As well known, in the case of single semiconductors such as n-type GaN, the surface band energy is defined by the surface adsorbed molecule, which is a flatband condition. As a result, the band is bending near the surface to prevent carrier flow under an equilibrium condition. The schematic energy alignment from the surface to deep into the semiconductor direction (z-axis) for GaN attached on pH 0 electrolyte is shown in Fig. 2(b). It is clear that the carrier transfer does not occur in the equilibrium condition because the majority carrier is electron. Instead, the electrochemical reaction can occur under illumination because the minority carrier of the hole is generated by light energy and can move to the surface.
The band alignment is more complicated when the semiconductor surface structure is p-type NiO on n-type GaN. Since the Fermi level tends to align even for heterojunctions between GaN and NiO, the band structure forms an upper convex shape, which means both the electron and hole cannot reach the surface. The schematic energy alignment from the surface to deep into the semiconductor direction (z-axis) is shown in Fig. 2(c). This alignment confirms that the electrochemical reaction is difficult to occur with the structure of NiO layer on n-type GaN because not many carriers exist at the surface even though the light is illuminated, and the hole exists at the GaN. The holes concentrate at the top of the band convex shape and are thought to be consumed by the recombination with electrons. This was observed in actual photoelectrochemical experiments where the photocurrent density of NiO layer on n-type GaN was less than that of bare n-type GaN, which is shown in Fig. 1[Reference Koike, Yamamoto, Ohara, Sugiyama, Nakano and Fujii11] This phenomenon is also supported by the evaluation results of p-type GaN on n-type GaN homojunction structure when the thickness of the surface p-type GaN is over about 10 nm.[Reference Fujii, Ono, Iwaki, Sato, Ohkawa and Yao22] The conditions for the photoelectrochemical reaction of NiO island on n-type GaN are different from that for the NiO layer on n-type GaN. Band alignment in the z-direction, which is the direction from deep inside the electrode to the electrode–electrolyte interface, is the same as the NiO layer structure. However, band alignment in the surface direction (x–y plane), which is the plane of the interface between an electrode and electrolyte, is the same as the relationship of the flatband energy band alignment shown in Fig. 2(a) due to both GaN and NiO attached to the electrolyte. The surface direction band alignment indicates that the hole can move from the GaN valence band edge to NiO valence band edge. In our experiments, the observed photocurrent density of NiO islands on n-type GaN was larger than that of bare n-type GaN and NiO layers on n-type GaN, which is also shown in Fig. 1.[Reference Koike, Yamamoto, Ohara, Sugiyama, Nakano and Fujii11] This surface direction band structure is probably one of the reasons for this large photocurrent density of the NiO islands when the speed of water oxidation on the NiO surface is faster than that of the GaN surface.
Optical properties of NiO used in our experiments
The properties of NiO are not unique because NiO forms oxygen and Ni vacancy easily, and because the surface chemical form changes from NiO to NiOOH due to the existence of OH− in the electrolyte, and Ni valency changes from Ni2+ to Ni3+ due to the trapping of photoexcited holes. Especially in our experiments, the NiO islands on GaN are assumed to be a mixture of NiO and NiOOH due to the hydroxide form of the precursor and their low annealing temperature of around 473 K.[Reference Sasi, Gopchandran, Manoj, Koshy, Rao and Vaidyan7] Thus, the evaluation of the band structure of the NiO electrochemical catalyst used is important because its structure may not be ideal. Therefore, the band structures of the NiO used were evaluated by the ex situ optical properties of NiO in our experiments.
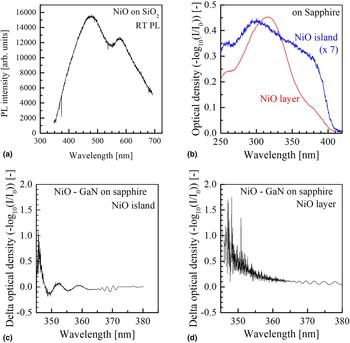
PL of NiO is difficult to observe due to its very low emission rate. In addition, especially in our experiments, the thickness of NiO is very thin and the NiO is located on GaN, whose luminescence is very strong. Thus, the PL from NiO was not observed by using the sample on GaN. The only observation of room temperature PL was that on the NiO layer on SiO2 glass as shown in Fig. 3(a). The peaks of 477 nm (2.60 eV) and 577 nm (2.15 eV) were observed. These PLs are thought to be conduction band to d-band transition from the NiO band structure and its estimated Fermi level energy.
(a) Room temperature photoluminescence (PL) from NiO layer on SiO2 glass. (b) Room temperature photoabsorption from NiO layer and NiO island on sapphire. The photoabsorption of NiO island is enlarged seven times. Room temperature photoabsorption difference between (c) NiO island on GaN on sapphire and GaN on sapphire, and (d) NiO layer on GaN on sapphire and GaN on sapphire. Optical interferences were observed because the thicknesses of the samples are different.
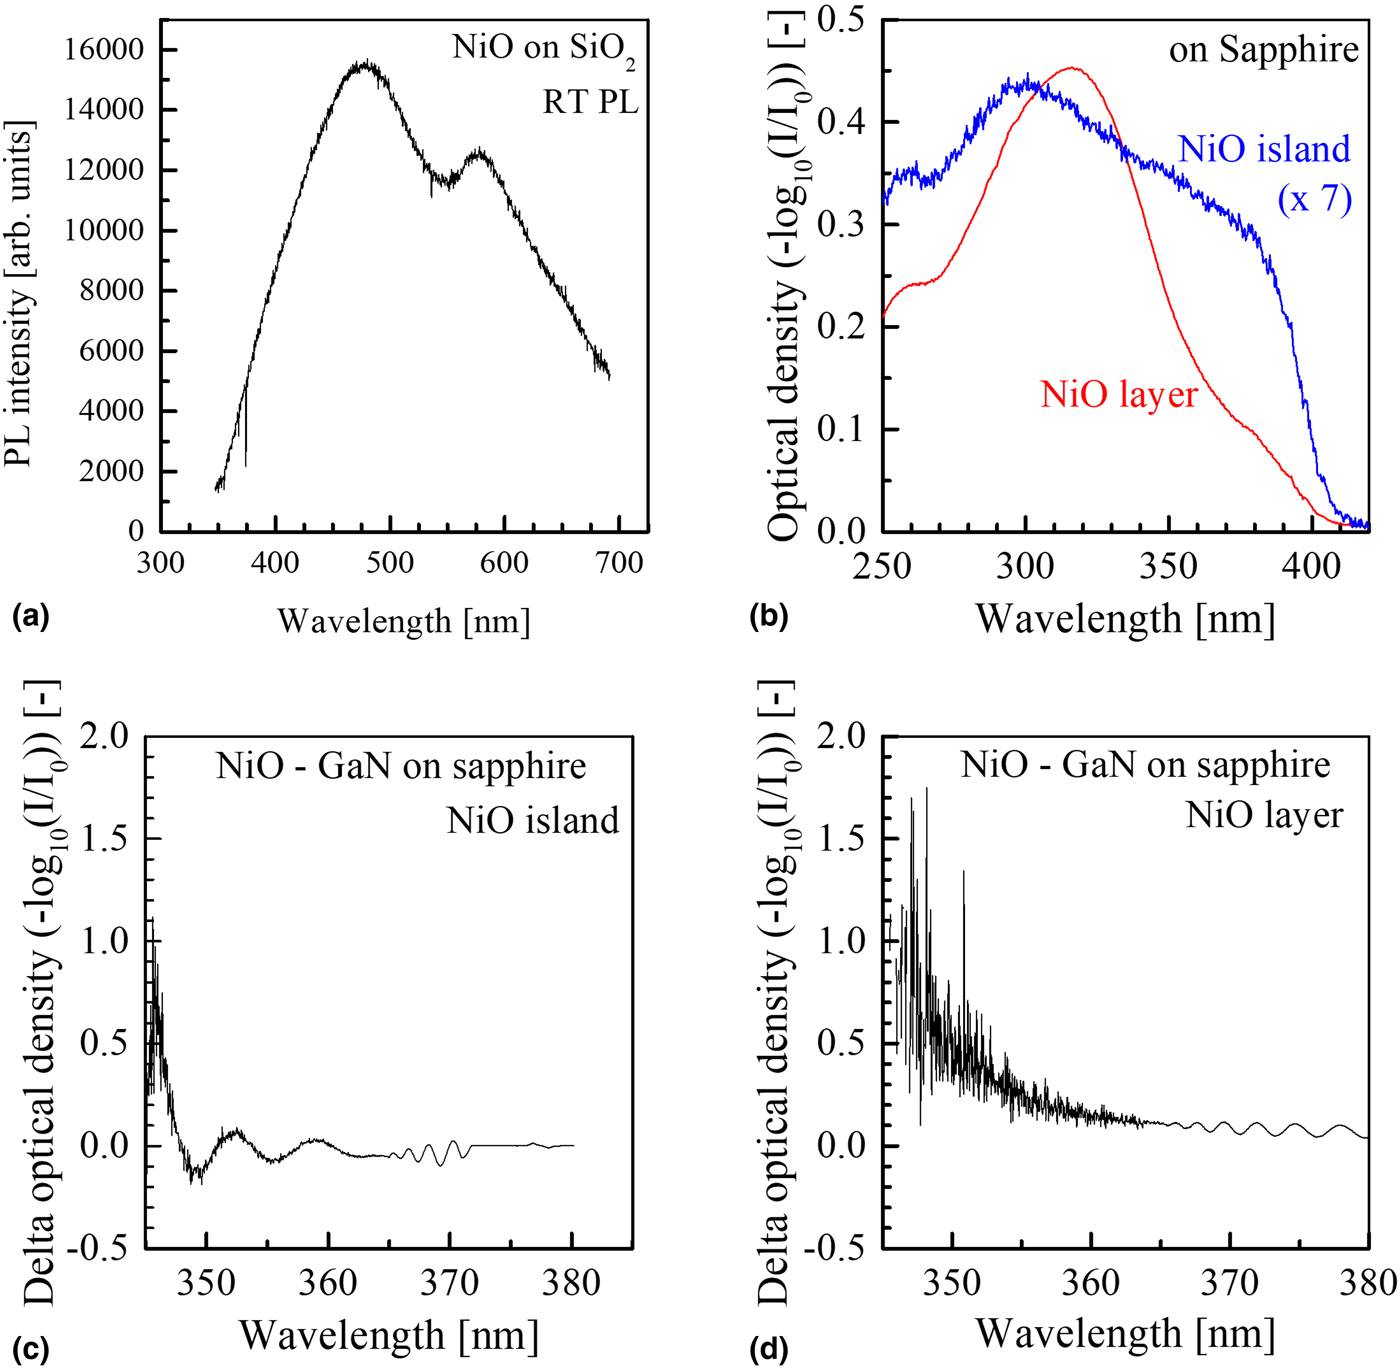
The photoabsorption peak at around 315 nm (3.94 eV) was clearly observed from the NiO layer on the sapphire substrate. The peak shifted to 298 nm (4.16 eV) and broadened for the NiO island sample. The 3.94 eV peak was reported to be a d–d transition absorption from valence band edge to the conduction band.[Reference Sokolov, Pustovarov, Churmanov, Ivanov, Gruzdev, Sokolov, Baranov and Moskvin18, Reference Peng, Li, Lin, Wang, Gao and Wu19] The transition was assumed to be the formation of charge transfer type exciton (electron–hole pair), which is the carrier transfer from one Ni atom to another neighbor Ni atom.[Reference Sokolov, Pustovarov, Churmanov, Ivanov, Gruzdev, Sokolov, Baranov and Moskvin18] This exciton is thought to be an excited state which causes water oxidation. A broad absorption peak at about 381 nm (3.25 eV), which probably originated due to the amorphous-like structure, was observed in both samples. The spectra are shown in Fig. 3(b). Since the peak position and spectrum shape changed according to the structure of NiO from layer to island, the distortion and/or crystal geometry are expected to differ according to the structure of the layer and island. This also suggests the difference in the chemical form (bonding structure of the atoms) between the layer and island structure, and that not only NiO but also NiOOH structures exist in large amounts in the NiO island as discussed in Ref. Reference Kang, Kim, Ebaid, Lee and Ryu10. This difference in chemical form may affect the water oxidation reaction speed.
Although the absorption peak observation of the NiO sample on the GaN on the sapphire substrate is difficult due to the optical interference phenomenon of the GaN layer, the absorption of the NiO layer and island from around 360–345 nm (3.45–3.60 eV) was observed from the differential spectra from the GaN on the sapphire substrate as shown in Fig. 3(c) and (d), respectively. This result shows that the basic characteristics of the NiOs on GaN do not differ significantly from those of sapphire substrates.
Based on these PL and photoabsorption observation, the energy level structures of NiO are summarized in Fig. 4. The theoretically estimated NiO band structure in the flatband condition is also illustrated in Fig. 4. Although differences in the energy level positions and several peaks were observed in our experiments probably due to the d-orbital energy splitting by lattice distortion and/or the existence of similar but different structures, the overall energy structure is similar. From this comparison, it can be said that the estimated band structure is more or less correct even in our experimental conditions. From this analysis, it can be concluded that the water oxidation is associated with the valence band edge of NiO and not the intermediate state of trapped holes, which plays a role in water oxidation by using n-type GaN photoelectrodes. The results also suggest that hole concentration at the valence band edge of NiO may be larger than that in the intermediate state of trapped holes for n-type GaN. This may suggest that the concentration of the electron capture hole is related to the water oxidation speed from the chemical reaction point of view.
Comparison between estimated NiO band structure at flatband condition and photoluminescence (PL) and photoabsorption (PA) observed energy at room temperature. PLs were observed from NiO layer. The PAs of 3.96 and 3.25 eV were observed from NiO layer and those of 4.16 and 3.25 eV were observed from NiO island. The PA is assumed to be the generation of charge transfer excitation[Reference Sokolov, Pustovarov, Churmanov, Ivanov, Gruzdev, Sokolov, Baranov and Moskvin18] and the grand state is regarded at the top of the valence band edge.

Reaction mechanisms of NiO island and NiO layer on n-type GaN
The rate of water oxidation on the NiO surface can be concluded to be faster than that of the GaN surface because the water oxidation current density of the NiO island sample is larger than that of bare GaN. Although the distortion and/or chemical form may differ between the NiO island and NiO layer samples in the optical evaluation, improvement of water oxidation is expected compared with the bare GaN sample. From the optical evaluation, the electron capture of NiO for water oxidation is thought to be associated with the valence band of NiO. For n-type GaN, this capture is associated with the intermediate state. The difference between the NiO island and NiO layer samples lies in the carrier transfer speed from GaN. This means that the carrier recombination in the GaN is reduced when the NiO island sample is used, due to its fast hole transfer along the surface direction.
Conclusion
The band structures of NiO island and NiO layer structures on n-type GaN were compared with that of bare n-type GaN. From the comparison results, it was concluded that the valence band edge of NiO is likely to be located near the water oxidation–reduction potential energy position, although the water oxidation at GaN is associated with holes trapped in the intermediate state. In addition, the hole from the GaN valence band edge is thought to transfer to the NiO valence band edge in the horizontal plane (x–y plane) direction. This is one of the reasons why the photocurrent density of the NiO layer on GaN is lower than that of bare n-type GaN and the density for the NiO island is higher than that for GaN. Although the chemical structure and/or distortion of NiO islands is expected to differ from the NiO layer from the results of photoabsorption observation, the rate of water oxidation of NiO is expected to be faster than that of GaN. This is another reason why there is a need to improve the water oxidation reaction at NiO compared with that of bare GaN.
Acknowledgements
The authors would like to thank all the members of Global Solar plus Initiative in The University of Tokyo, Nakano, Sugiyama, Tanemura Laboratory in The University of Tokyo, and RIKEN Research Center for Advanced Photonics for their support.