I. INTRODUCTION
The production of nanoporous polymer structures is a very active area of research because of the promise of unique combinations of properties not achievable with microcellular or macrocellular foams. Films and membranes with connected nanopores are used as catalyst support due to their high surface area, or as filtration or separation media in which the balance of properties such as particle rejection and flux can be tuned by adjusting the pores size distribution. Nanoporous membranes also find their application as battery separators, in the transport of ions, and can be controlled by hindered diffusion in the narrow channels. Other potential applications of these high surface area materials include biosensors, scaffolds, etc. The most common methods to produce such structures involve the use of a solvent with a porogen component, a co-solvent, or a copolymer with sacrificial blocks.Reference Zalusky, Olayo-Valles, Taylor and Hillmyer1,Reference Zalusky, Olayo-Valles, Wolf and Hillmyer2 The solvent has to be extracted to obtain the porous material.
These methods are ill-suited for closed pore structures, for which it is preferable to use a gas or supercritical fluid which will easily diffuse out of the polymer matrix. Very thin films with closed pores have been produced for electronic or optical applications by Yokoyama et al.Reference Yokoyama and Sugiyama3 using templated block copolymer systems. The fugitive medium was CO2, which swells CO2-philic domains at high pressure and leaves voids when the pressure is slowly decreased. A more conventional solid-state batch foaming process was used by KrauseReference Krause, Mettinkhof, van der Vegt and Wessling4 to nucleate cells in films made from high T g polymers, and subsequently expanding these films into partially foamed membranes in a hot oil bath. Miller et al.Reference Miller, Chatchaisucha and Kumar5,Reference Miller and Kumar6 used a similar solid-state batch foaming process to make thin films with PEI. The porosity of these membranes remains low (in the range of 20–50%).
A major application expected from nanocellular foams is thermal insulation, which requires thicker porous structures—at least a few millimeters thick—and high porosity. Thermal conductivities as low as 10 mW/m-K have been obtained for aerogelsReference Hrubesh and Pekala7 with pore size in the range of 10–50 nm, i.e., smaller than the mean free path of air molecules at ambient temperature and pressure (approximately 75 nm). To achieve such performance, aerogels need to have a low density (high void fraction or porosity close to 85–90%Reference Hrubesh and Pekala7), which reduces the contributions on heat conduction via phonon transport through the solid. Producing such structures by a conventional gas foaming process would be advantageous, but generating a large number of cells—of the order of 1015 cells per cm3 of polymer, compared to 1012 for microcellular foams—and stabilizing these cells so that they remain of nanoscale dimensions (approximately 100 nm diameter) is a very significant challenge.
Otsuka et al.Reference Otsuka, Taki and Ohshima8 used a process similar to Yokoyama’sReference Yokoyama and Sugiyama3 to produce nanoscale cells with PS/PMMA interpenetrating networks. Ruckdäschel et al.Reference Ruckdäschel, Gutmann, Altstädt, Schmalz and Müller9 used blending as a way to enhance cell density using immiscible blends with a dispersed phase having a higher CO2 solubility than the matrix. Their two-step process similar to Krause’sReference Krause, Mettinkhof, van der Vegt and Wessling4 yielded foams with about 1013–1014 cells/cm3 and porosities approaching 50% of the foam volume. Reglero et al.Reference Reglero Ruiz, Dumon, Pinto and Rodriguez-Pérez10,Reference Reglero Ruiz, Pedros, Tallon and Dumon11 and Pinto et al.Reference Pinto, Rodríguez-Pérez, de Saja, Dumon, García and Dietz12 subsequently used a dispersed acrylic block copolymer in an acrylic matrix to enhance nucleation. They were able to show that the number of block copolymer domains in the polymer matrix correlates with the number of cells generated (approximately 1014 cm−3). It is often concluded that nucleation occurs in the dispersed phase, although the interface between the phases seems to provide preferred conditions to generate nuclei. Costeux et al.Reference Costeux13–Reference Costeux and Zhu15 showed that addition of nucleating nanoparticles to acrylic or styrenic polymers can produce 80–85% porosity nanofoams with 100 nm cells or less and cell densities of 1015–1016 cm−3 by a two-step batch foaming process. Further workReference Costeux16,Reference Costeux, Jeon, Bunker and Khan17 showed that tailoring the molecular structure of acrylic copolymers to enhance CO2 solubility could produce foams with similar characteristics without using a nucleator.
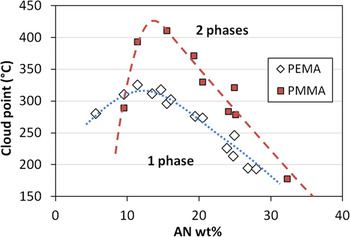
Modification of styrenic polymers does not provide the same flexibility as acrylic copolymers as far as significantly enhancing CO2 interactions by copolymerization. However styrene acrylonitrile copolymers (SAN) have a window of miscibility with acrylic polymers such as PMMA and PEMAReference Fowler, Barlow and Paul18,Reference Suess, Kressler and Kammer19 for intermediate acrylonitrile levels. While for each SAN polymer the blends at various compositions show a classical LCST behavior, when plotting cloud point data from the work of Fowler et al.Reference Fowler, Barlow and Paul18 for 50/50 (wt%) blends of either PMMA or PEMA with SAN containing various levels of acrylonitrile, as shown in Fig. 1, the phase diagram exhibits a maximum for AN content around 11–15 wt% of AN, for which the temperature window for miscibility is the broadest. This miscibility window gets narrower at both low and high AN levels. For instance, when producing blends by melt blending at 200 °C, PMMA/SAN 50/50 blends will tend to become immiscible for SAS resins with AN levels lower than about 8 wt%, or higher than about 32 wt%. For PEMA/SAN blends, immiscibility is most likely to be for AN levels above 28 wt%. Inhomogeneities in such immiscible blends may influence the foaming behavior, but would require a careful control of the blend morphology to obtain consistent results.
Phase equilibrium for (50/50 wt%) blends of SAN with PMMA and PEMA as a function of AN content (data from Ref. Reference Fowler, Barlow and Paul18).

Therefore, homogeneous blends could be good candidates to tailor the foaming behavior and structure of nanofoams by controlling blend properties such as CO2 solubility, rheology or glass transition temperature. The present work focuses on blends of SAN with various acrylic polymers and their use for the preparation of nanofoams.Reference Costeux20
II. EXPERIMENTAL
A. Materials
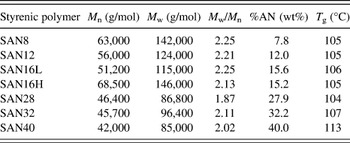
SAN listed in Table I were produced by conventional free radical polymerization using continuous addition of the monomer to achieve various AN compositions, from 8 to 40 wt%.
Characteristics of styrenic polymers.

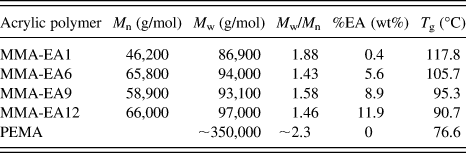
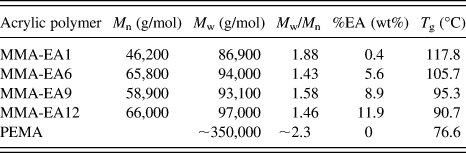
Acrylic polymers in Table II were obtained from commercial sources. PEMA is a poly(ethyl methacrylate) obtained from Scientific Polymer Products (catalog # 308, nominal molecular weight 350 kg/mol). MMA-EAx are poly(methyl methacrylate-co-ethyl acrylate) random copolymers: MMA-EA9 is Plexiglas® VM-100 (Arkema Inc., King of Prussia, PA); MMA-EA1, MMA-EA6 and MMA-EA12 are Optix® CA-75, Optix® CA-68 and Optix® CA-41 (Plaskolite Inc., Columbus, OH) respectively.
Characteristics of acrylic polymers.
Blends were prepared using a Haake Rheomix 610 mixing bowl (Thermo Fisher Scientific, Waltham, MA) in 50 g batches. The mixing bowl was heated to 180 °C and polymers were added under low RPM. The materials were melted and blended for 10 min at 60rpm. A recirculating fluid cooling jacket was used to maintain desired temperature during blending.
B. Polymers and blend characterization
Molecular weight distributions were determined by using an Agilent 1100 series liquid chromatograph equipped with two Polymer Laboratories PLgel 5 μm mixed-C columns (Agilent, Santa Clara, CA) connected in series, and an Agilent G1362A refractive index detector (Agilent, Santa Clara, CA). Tetrahydrofuran was used as the eluent with a flow rate of 1 mL/min at 35 °C. Molecular weights listed in Table II are reported as apparent molecular weights with respect to a set of PMMA standards.
Glass transition temperatures, T g, were determined by differential scanning calorimetry (Q100, TA Instruments, New Castle, DE), on the second heating curve of a temperature cycle between 0 and 200 °C. The heating rate was 10 °C/min, and T g was detected at the half-height of the transition on the heat flow curve.
Dynamic mechanical spectroscopy (DMS) measurements were carried out either on an RMS 800 (Rheometrics, TA Instruments, New Castle, DE) equipped with 8 mm parallel plates or on an ARES (TA Instruments) equipped with 25 mm parallel plates. For the former, the frequency range was 0.1–100 rad/s and the strain amplitude was kept between 2% and 10% to remain in the linear regime. For the latter, the range of 300–0.03 rad/s was used with the auto-strain feature (the initial strain amplitude of 0.5% at 300 rad/s is allowed to increase at lower frequencies for the torque to remain in the optimal range). Data from both rheometers were within 4% of one another.
High pressure viscosity data for polymers saturated with CO2 were measured at McGill University (Montreal, Canada) using a high pressure sliding plate rheometer (HPSPR). By design, the CO2 concentration in the HPSPR experiments is the equilibrium concentration at a given CO2 pressure, i.e., the solubility at the measuring conditions. Experimental details can be found elsewhere.Reference Park and Dealy21
Transmission electron microscopy (TEM) was carried out on the blends using a FEI/Philips Tecnai 12 (FEI, Hillsboro, OR) operating at an accelerating voltage of 120 kV. Samples were first cryo-polished, the SAN phase was stained over a 2% ruthenium tetroxide vapor for 3 min, and 70-nm thick slices were sectioned by ultramicrotomy with a Leica UC6 microtome (Leica Microsystems Inc., Buffalo Grove, IL).
Scanning transmission x-ray microscopy (STXM) was carried out on the polymer STXM at the advanced light source (beamline 5.3.2.2, Lawrence Berkeley National Laboratory, Berkeley, CA). Samples were scanned and the x-ray absorption spectra were collected over the 280–320 eV energy range. The intensity of the peaks corresponding to the aromatic C=C bonds of SAN (285 eV) and C=O bonds of acrylic polymers (288.5 eV) was used to determine polymer composition throughout the foam specimen.
C. Foaming and foam characterization
1. Two-step foaming process
Batch foaming was carried out in a cylindrical high pressure vessel (50 mL) made of stainless steel connected to a high pressure carbon dioxide source, consisting of a CO2 cylinder, a syringe pump (Teledyne ISCO 100D, Teledyne Isco, Lincoln, NE), and a depressurization device (tubing + automated release valve). The sample was pressurized with CO2 for a given time (t soak) under the preset pressure (P soak) and temperature (T soak). The release valve was then fully opened for rapid depressurization (less than 1 s, pressure drop rate of the order of 1 GPa/s) to make foams by pressure-induced nucleation.
Following this first expansion, the sample was retrieved and, within 1 min, immersed into a heated water bath. This “postfoaming” (PF) process was found to be necessary to avoid uncontrolled changes in cell dimensions and fracturing of the foam samples. Indeed, high residual levels of CO2 trapped at high pressure within the foam cause high internal stresses and plasticize the polymer matrix, affecting foam stability. This annealing step was performed at a temperature higher than the soaking temperature, but below the T g of the pure polymer. The postfoaming duration was controlled to allow residual CO2 to further expand the foam and diffuse out. For consistency of the results, postfoaming was started about 45 s after depressurization for all samples. Only the weight of the sample was measured during this short time interval. Unless specified, the following reference conditions for initial foaming and postfoaming were used: T soak =30 °C, P soak = 33 MPa, t soak = 10 h, PF at 60 °C for 3 min.
The density of the polymer prior to foaming and of the nanofoam was determined using a density determination kit (Sartorius YDK 01, Data Weighing Systems, Inc., Elk Grove, IL) and a microbalance (Mettler AE 160, Mettler-Toledo, LLC, Columbus, OH) at ambient temperature. The porosity (p) of the foams is determined by the equation
 $$p = 1 - {\rm{\rho }}_{\rm{f}} /{\rm{\rho }}_{\rm{p}} \quad,$$
where ρf is foam density obtained by the buoyancy method and ρp is the density of polymers or polymer blends.
2. Cell structure
High resolution images of the foam morphology were acquired using a scanning electron microscope (SEM, FEI Nova NanoSEM 600, FEI, Hillsboro, OR) equipped with a secondary electron detector in the immersion mode. The foam samples were cryogenically fractured and sputter-coated with osmium prior to imaging.
Average cell size,  $\phi$, was determined from the SEM images of a foam cross-section by measuring the length between two opposite cell walls of at least 200 representative cells (ImageJ software v1.45b, National Institute of Health, http://rsb.info.nih.gov/ij/) and generating a histogram. In cases where certain cells were anisotropic, the distance between cell walls was measured for these cells in a direction intermediate between the long and short axes. This distance was taken as the diameter of a spherical cell of equivalent cross-sectional area. The reported average cell size
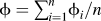 $\phi = \sum\nolimits_{i = 1}^n {\phi _i /n}$ is the mean of measured cells of diameters
 $\phi _i$ and volume v i proportional to
 $\phi _\iota ^3$.
The volume average size is thus given by  $\phi _v = \sum\nolimits_{i = 1}^n {\phi _i } v_i /\sum\nolimits_{i = 1}^n {v_i } = \sum\nolimits_{i = 1}^n {\phi _\iota ^4 /} \sum\nolimits_{i = 1}^n \phi _i^3$, and we chose as a measure of the polydispersity of the cell size distribution.
Cell density is calculated by first dividing the pore volume of the foam by the volume of an average cell, and by multiplying by the expansion ratio.Reference Kumar and Suh22 The equation below gives the cell density per cm3 of un-foamed material:
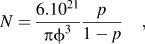 $$N = {{6.10^{21} } \over {{\rm{\pi }}\phi ^3 }}{p \over {1 - p}}\quad,$$
where  $\phi$ is expressed in nanometers and p = 1 − ρf/ρp. This definition of the cell density proves to be more meaningful than the number of cells per cm3 of the final foam when comparing foams that have different densities.
3. CO2 solubility and approximate CO2 uptake
CO2 solubility was measured with a magnetic suspension balance (MSB, Rubotherm, Germany) at pressures below 14 MPa. The samples were first saturated with CO2 at 35 °C at the lowest pressure of interest (around 8 MPa). Equilibration was considered achieved when the apparent mass became stable. Subsequent measurements were carried out at increasing pressure values. The apparent mass is a function of the true solubility and of the buoyancy force, which depends on the density difference between the CO2-laden polymer and CO2 at the measuring conditions. The perturbed chain statistical associating fluid theory equation of state (PC-SAFT EOS) was used to fit the apparent mass and polymer-CO2 mixture density at various pressures simultaneously, from which CO2 solubility in the polymer was determined.
The solubility of CO2 in the polymers at foaming conditions (33 MPa) could not be directly measured with the MSB due to equipment pressure limitations. Instead, CO2 uptake at foaming conditions was estimated by weighing the sample for 30 s after the initial foaming. The rate of diffusion of CO2 was such that CO2 loss prior to weighing should be less than 10% of the true solubility. This was deemed adequate to compare the relative affinity of polymers with CO2. This number will be reported as the “CO2 uptake.”
III. RESULTS AND DISCUSSION
A. Foams from base polymers: SAN, PMMA-co-EA and PEMA
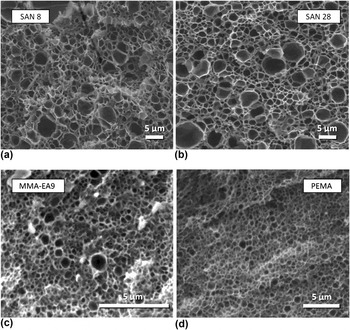
Individual polymers were foamed under the reference conditions (T soak = 30 °C, P soak = 33 MPa, t soak = 10 h, PF at 60 °C for 3 min) to establish a baseline from which we evaluate the blends. To eliminate the effects of heat history, polymers underwent the same compounding process as the blends. The characteristics of the foams are listed in Table III. Under these conditions, the SAN materials all produced foams with rather broad cell size distributions, with a majority of cells smaller than 1 μm but with a population of larger cells, in the 1–6 μm range. Such foams, shown in Fig. 2(a) and Fig. 2(b), will be denoted as inhomogeneous in the following. As a result, the cell density of the foams is rather low, in the range of 1012 to 2 × 1013 cm−3. Table III also shows the estimated CO2 uptake, which increases from 18.6 to 22.7% as the AN level is increased. This is consistent with the expectations that CO2 solubility should increase with the acrylonitrile content.
Characteristics of foams from individual polymers under standard conditions (T soak = 30 °C, p soak = 33 MPa, t soak = 10 h, PF at 60 °C for 3 min).
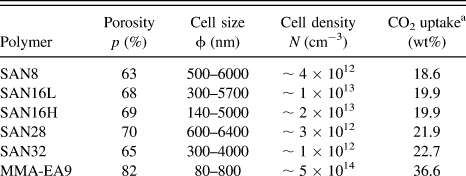
a Measured in a separate foaming experiment, 30 s after depressurization.
SEM images of selected foams. (a) and (b): from styrenic copolymers. (c) and (d): from acrylic polymers.

Foams made from acrylic copolymer MMA-EA9 produced much smaller cells on average (approximately 260 nm) but also with a relatively broad distribution ranging from about 80–800 nm [Fig. 2(c)]. In contrast, PEMA foams show a more homogeneous cell structure [Fig. 2(d)], with an average cell size of 345 nm. The two acrylic foams have cell densities of 5 × 10¹⁴ and 1.8 × 1014 cm−3 respectively. The CO2 uptake for these two polymers is significantly higher than for the SAN series, as shown in Table III.
The average cell size of nanofoams, reflected into the cell density, is strongly dependent on the rate of nucleation. The nucleation rate is known to be sensitive to the concentration of the blowing agent, pressure drop and interfacial tensionReference Costeux, Jeon, Bunker and Khan17,Reference Colton and Suh23 as well as to the presence of a nucleating agent,Reference Colton and Suh23 even under conditions used for solid state batch foaming followed by postfoaming.Reference Costeux and Zhu14
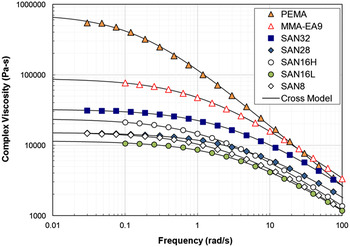
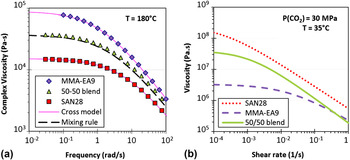
However, the occurrence of a population of larger cells in the foams indicates the presence of at least one other mechanism controlling cell size. A possible mechanism is cell coalescence, which could occur either during the initial foaming step or during postfoaming. Because coalescence traditionally involves deformation of flow of material in cell walls, a comparison of polymers’ viscosity could point to materials for which coalescence is more likely to occur. Figure 3 shows a comparison of the viscosity curves as a function of angular frequency ω for the base polymers, measured at 180 °C. The viscosity data were fitted with a cross equation:
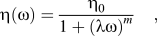 $${\rm{\eta (\omega )}} = {{{\rm{\eta }}_0 } \over {1 + ({\rm{\lambda \omega )}}^m }}\quad,$$
where η0 is the zero shear viscosity, λ is the characteristic time and m is the power law exponent.
Viscosity in oscillatory shear at 180 °C for the main base polymers. Lines represent fits with the cross equation.

Although not a direct representation of the low temperature viscosity of polymer/CO2 mixtures, high temperature melt rheology provides a relative comparison of molecular relaxation between the base polymers which have various averaged molecular weights and mass between entanglements. The viscosity of PEMA is significantly higher than that of any other resins, and produces the most homogeneous foams. The zero shear viscosity of MMA-EA9 is one order of magnitude lower, but higher than any of the SAN polymers. This polymer does not show any cell larger than 1 μm. The largest cells observed for the SAN foams are for SAN8, SAN16L and SAN28, which also have the lowest zero-shear viscosities. This may be an indication that the slow flow during postexpansion, at a temperature higher than the T g of the polymer/CO2 mixture, relates rather simply to the low shear melt viscosity of the pure polymer, and that low viscosity polymers are less able to resist cell wall drainage responsible for coalescence.
In addition, the foam porosity for pure SAN foams is relatively low, not exceeding 70%, while it is close to 80% for the acrylic polymers. This is generally consistent with higher CO2 uptake for the acrylic polymers, as shown in Table III.
Based on these observations and hypotheses, a blending strategy can be proposed to improve the foaming behavior of SAN toward the production of nanofoams. First, it seems a priori beneficial to increase CO2 solubility in the blend compared to pure SAN by adding a CO2-philic acrylic polymer. PEMA is the first choice, as it has higher affinity for CO2 than MMA-EA9. Maximizing the AN level in SAN also increases CO2 solubility. Based on Fig. 1, it is expected that SAN28 should be miscible both with PEMA and MMA-EA9 at the blending conditions (180 °C), while SAN32 may not be miscible with PEMA. Due to the high viscosity ratio between SAN32 and PEMA, it may be difficult to achieve a fine dispersion of immiscible SAN/PEMA blends by shear, the prevalent mode of deformation in the mixing bowl. Thus SAN28 is chosen as the starting styrenic copolymer.
After the initial evaluation of SAN28/PEMA blends, the other SAN resins will be used in blends with PEMA, then with MMA-EA9 to assess the role of the chemical composition of the polymer matrix on the foam structure.
B. Nanofoams from SAN-PEMA blends
1. Effect of SAN28/PEMA blend composition
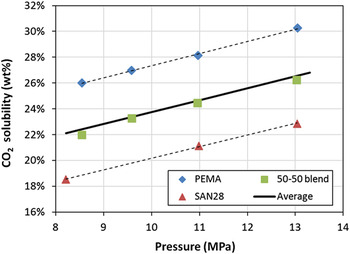
First we examine the assumption that CO2 solubility in a blend can be interpolated from its solubility in the individual polymers. This is confirmed in Fig. 4, which shows that the low pressure solubility data measured with a MSB for a 50/50 (wt%) blend of SAN28 and PEMA and closely approximated by the average of the solubilities of the two polymers. Here the average is a linear mixing rule based on the weight fractions of both polymers in the blend.
CO2 solubility in SAN28, PEMA and their 50/50 (wt%) blend as a function of CO2 pressure (T = 35.5 ± 0.3 °C). Dotted lines are linear regressions. The continuous line is a prediction based on a linear mixing rule.

Assuming that the same mixing rule is still valid at high pressure and low temperature, the CO2 uptake for the SAN28/PEMA (50/50 wt%) blend is expected to be similar to that of MMA-EA9 under standard conditions.
Prior to foaming experiments, attention was paid to the miscibility of the blends. SAN28/PEMA blends were first produced at the SAN28 level increasing from 30 to 50 wt%. All of these blends presented a single T g on the DSC heat flow curve, and were all translucent. Based on the difference of refractive index between the polymers (1.49 for PMMA versus 1.57–1.59 for SAN at a wave length of 550 nm), this was interpreted as a good indication of the miscibility of the blends. The foams obtained from these blends under standards conditions are listed in the first three rows of Table IV.
Foam characteristics for SAN/PEMA blends.

a This is the final AN content in the blend.
b Two values are given when separate transition are visible on the heat flow curve.
The foams made at the highest PEMA level have similar cell density and porosity as the pure PEMA foam shown in Table III. As the SAN28 level is increased, the porosity decreased from 81 to 75%. This could be interpreted as a result of the lower CO2 solubility of blends with high SAN content compared to PEMA-rich blends. However, this is also accompanied by a progressive decrease of the average cell size, and an increase of the cell density. A simultaneous decrease of porosity and cell size could simply be the consequence of foam collapse during the postfoaming step. Yet in such an event, the cell density should not increase, as it is calculated as the number of nuclei in the un-foamed polymer that results in a cell in the final foam. A concomitant increase of cell density indicates that, despite a reduction in CO2 solubility, cell nucleation was enhanced in the blends with high SAN content. This is unexpected based on previous findings.Reference Costeux, Jeon, Bunker and Khan17
2. Effect of the molecular composition of SAN
To verify this tendency, blends were prepared with a fixed amount of PEMA (50 wt%) but different SAN resins with lower acrylonitrile levels. The corresponding foam properties are listed in rows 4–7 of Table IV.
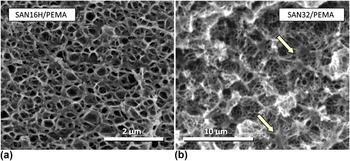
SAN resins with lower CO2 solubilities (lower AN level of 8 and 16 wt%) produced very fine cell structures and cell densities in excess of 3 × 1015 cm−3, albeit with lower porosity than the blend with SAN28. An example of SEM image for the foam containing SAN16H is shown in Fig. 5(a). The cell density is found to increase as the AN level increases, as previously described. However, this is accompanied by a slight increase of CO2 affinity for the blend, whereas in the SAN28/PEMA series, better foams were obtained as the CO2 affinity of the blend was decreased. Increasing the level of SAN8 from 50 to 60 wt% also produced smaller cells and higher cell density.
SEM image of foams produced from (a) a miscible blend, SAN16H/PEMA (50/50 wt%) and (b) an immiscible blend, SAN32/PEMA (50/50 wt%). Arrows indicate nodules of high density polymer.

However, further increasing the AN level in SAN to 28 wt% and then to 32 wt% while keeping SAN loading at 50 wt% produced increasingly larger cells (239 and 357 nm on average respectively) than for the SAN16-based blends (∼95 nm). Porosities are generally lower as the cell size decreases.
Thus, there does not seem to be a robust trend between the ability to produce fine cell morphologies with SAN/PEMA blends and their CO2 affinity. Increasing the level of acrylonitrile generally produces higher cell densities, but this trend reversed with SAN containing 28 wt% of AN or more.
One factor worth considering to explain this trend reversal is the compatibility of PEMA with the SAN resins with high AN content. As mentioned previously, Fig. 1 suggests that SAN32 may not form homogeneous blends with PEMA. This is confirmed by the presence in the DSC curve of two distinct glass transition temperatures: one close to that of PEMA (77 °C) and the other close to that of SAN32 (107 °C).
Introduction of CO2 could alter the morphology of these blends (for instance promote miscibility, or facilitate phase separation) because of the relative long soaking time (10 h). The foam from SAN32/PEMA (50/50 wt%) shown in Fig. 5(b), has a homogeneous distribution of cells, but displays irregular structures resembling nodules of partially foamed or un-foamed polymer [see arrows on Fig. 5(b)]. These domains, about 1 μm in size, could be formed by a dispersed polymer phase having lower solubility or higher diffusivity of CO2 than the surrounding medium. This morphology was not observed for miscible blends with lower acrylonitrile SAN resins. This suggests that exposure to CO2 does not promote miscibility between SAN32 and PEMA.
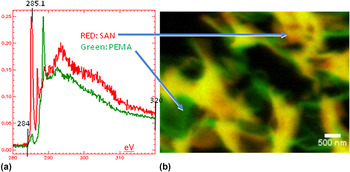
This was confirmed by STMX analysis, which provides a composition map of the nanofoam, due to the different x-ray absorption spectra of SAN and PEMA, shown in Fig. 6(a). The colored image in Fig. 6(b) shows that the nanofoam still has the PEMA rich phase and SAN-rich phase. Dark regions are foam cells, green-colored regions are a PEMA-rich phase and red-color regions correspond to high SAN content. Yellow color indicates the composition consistent with that of the blend before foaming, or an overlap of a SAN-rich region with a PEMA-rich region located on planes at different depths.
STXM analysis of nanofoams from SAN28/PEMA (50/50 wt%), with absorption spectra of SAN and PEMA and colored image showing separate phases.

This establishes without ambiguity that a partial phase separation remains in the SAN32/PEMA (50/50 wt%) foam, which could affect the rate of nucleation, and explain in part the increase of cell size for these foams compared to blends with SAN8 and SAN16. Blends with SAN28, despite being miscible in the melt, may become marginally miscible in the presence of CO2.
In summary, while addition of PEMA increases CO2 affinity of pure SAN and contributes to the production of homogeneous nanofoams, foaming results reveal unexpected trends. First, increasing the CO2 solubility of the blends either by increasing the PEMA level or increasing the AN content in the SAN resin did not systematically result in higher nucleation density. Actually, the reverse trend is observed in most cases (the only exception is SAN8/PEMA 50/50 wt%). Second, the window of miscibility for the SAN/PEMA blends is limited to SAN with 28 wt% of AN or less. Phase separation in the blend does not help cell nucleation. However, the very high viscosity of PEMA may be an advantage in maintaining a relatively fine cell structure during higher temperature postfoaming.
An acrylic polymer with lower CO2 affinity but a broader miscibility window may thus be a good alternative to PEMA. By selecting the adequate composition, the T g of the acrylic polymer can be chosen so that the blend T g remains close to 100 °C.
C. Nanofoams from SAN/MMA-co-EA blends
Poly(methyl methacrylate) homopolymer (PMMA) has a broader miscibility window with SAN containing high acrylonitrile levels but should be less compatible with low AN resins, as shown in Fig. 1. However, PMMA has poor thermal stability, and partial degradation during blend processing could affect the foaming performance. Therefore, more thermally stable copolymers with ethyl acrylate (EA) were used for the blend study. Due to the strong affinity of EA for CO2, manipulating both the EA content and the ratio of SAN to acrylic polymer in the blends provides an additional degree of freedom to improve the nanofoam structure.
1. Role of SAN28/MMA-EA9 blend composition
The first set of experiments with MMA-EA9 involved blends with SAN28, in which the SAN level was varied between 20 and 90 wt%, as shown in Table V. The blends with 30–50 wt% of SAN28 serve as a direct comparison with the SAN28/PEMA blends in Sec. III. B. 1. Blends with higher SAN content were tested based on the previous observation that lower levels of PEMA were advantageous toward increasing the cell density. Foaming results under standard conditions (T soak = 30 °C, P soak = 33 MPa, t soak = 10 h, PF at 60 °C for 3 min) are compiled in Table V.
Characteristics of nanofoams from SAN28/MMA-EA9 blends.

The initial observation is that the fine cell morphology previously seen for some of the SAN/PEMA blends is maintained in SAN28/MMA-EA9 blends for compositions ranging from 20 to 80 wt% of SAN28. All these foams have an average cell size  $\phi$ of around 100 ± 15 nm, cell densities up to 5 × 1015 cm−3 and narrow cell size distribution (
 $(\phi _v /\phi \approx {\rm{1}}{\rm{.2)}}$. All the blends show a single T g. Only the blend with 90 wt% of SAN28 shows signs of turbidity, which may indicate that the composition is not fully miscible. The corresponding nanofoam contains a small fraction of larger cells, which slightly increases
 $\phi _v /\phi$.
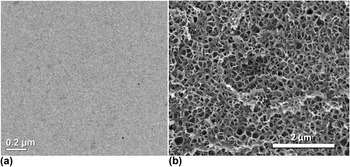
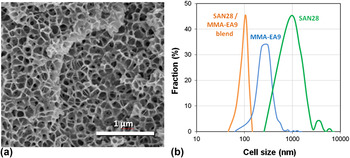
Figure 7(a) shows a TEM image of the SAN28/MMA-EA9 (50/50 wt%) blend, evidently miscible, and a SEM image of the homogeneous nanofoam produced from this blend [Fig. 7(b)]. It has a higher cell density than the foam made from the marginally miscible SAN28/PEMA (50/50 wt%) blend under the standard foaming conditions, despite the lower CO2 affinity of MMA-EA9 compared to PEMA. This points to the benefit of using more compatible blends to enhance cell nucleation. The same can be said for the SAN28/MMA-EA9 (90/10 wt%), which shows signs of immiscibility. An increase in cell size and a drop of cell density by an order of magnitude is observed compared to lower SAN loadings for which blends are homogeneous. Yet, the cell density of this 90/10 blend remains two orders of magnitude higher than the pure SAN28 foam (Table III) while maintaining the same porosity. It is remarkable that addition of a low level of miscible polymer affects cell nucleation density to this extent. The addition of 10 wt% of MMA-EA is not sufficient to drastically change rheology or CO2 solubility, so the explanation has to be found elsewhere: influence of the free volume affecting CO2 diffusion, change in T g of the highly plasticized blend/CO2 mixture, transition in the phase behavior of polymer/CO2, etc. This will be discussed in Sec. III. D.
SAN28/MMA-EA9 blend (50/50 wt%). (a) TEM image of the blend cross-section. (b) SEM of nanofoam produced from this blend under standard conditions (T soak = 30 °C, P soak = 33 MPa, t soak = 10 h, PF at 60 °C for 3 min).

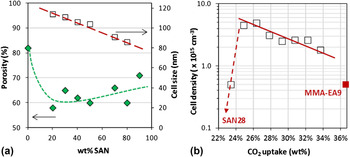
For the blends that are presumably miscible, the graph in Fig. 8(a) shows that the cell size decreases as the amount of SAN is increased. This behavior is opposite to previous results on acrylic polymers,Reference Costeux and Zhu15–Reference Costeux, Jeon, Bunker and Khan17 which consistently showed that under conditions where CO2 solubility is increased, it is possible to make smaller cells because the nucleation rate increases with CO2 uptake. Figure 8(b) shows the opposite trend for SAN-acrylic blends.
Effect of SAN28/MMA-EA9 blend composition on foam characteristics: (a) porosity and cell size; (b) relationship between CO2 uptake and cell density. Lines indicate trends.

Porosity values for the series are between 60 and 70%, which are lower than what was achieved in the previous work (up to 85% for foams made at 35 °C using nano-nucleatorsReference Costeux and Zhu14,Reference Costeux and Zhu15 or acrylic copolymersReference Costeux, Jeon, Bunker and Khan17). Here, porosities do not show a clear trend with SAN content of the blend, as shown in Fig. 8(a).
This unconventional behavior with respect to the CO2 affinity of the blend again indicates a more complex nucleation mechanism than for single acrylic polymer systems.
2. Blends of MMA-EA9 with various SAN resins
Several SAN resins with varying amounts of acrylonitrile between 8 and 28 wt% were blended into MMA-EA9 at a 50/50 (wt%) ratio, as shown in Table VI. The blends containing SAN with an intermediate AN level (12–28 wt% of AN) were transparent with a single T g, and thus were assumed to be miscible. The blend of MMA-EA9 with SAN8 had a translucent but slightly hazy appearance, which indicates that it may be on the verge of immiscibility prior to exposure to CO2. The DSC results showed a single T g, which could be due to the proximity of the glass transition temperatures of the individual polymer. A blend was also produced with 70 wt% of SAN40 (resin with 40 wt% of AN) to achieve a total acrylonitrile level in the blend equal to pure SAN28. This blend also has a single measurable T g but is turbid and thus immiscible. These observations are all in agreement with the phase diagram for SAN/PMMA in Fig. 1.
Characteristics of nanofoams from blends of MMA-EA9 with various SAN resins.

Upon foaming, the SAN8 blend achieves high cell density and very narrow cell size distribution, similar to the blends that are unambiguously miscible. On the contrary, the blend with SAN40 produces a lower porosity foam with lower cell density, and a broader cell size distribution, as evidenced by a high  $\phi _v /\phi$ value. Yet, this foam with a total AN level of 28 wt% has a much improved nanostructure compared to the pure SAN28 foam. The other miscible blends produced homogeneous foams with cell densities as high as 4.8 × 1015 cm−3. The general trend (with the exception of the SAN8 blend) is toward a decrease of cell density as the SAN becomes more CO2-philic.
3. Blends of SAN28 with various MMA-co-EA resins
The final set of experiments uses SAN28 with MMA-co-EA copolymers containing between 0.4 to 12 wt% of EA. Increased EA levels provide higher CO2 solubility. The structures of the foams from 50/50 (wt%) blends are listed in Table VII.
Characteristics of nanofoams from blends of SAN28 with various MMA-co-EA resins.

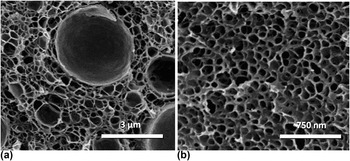
The blend made with MMA-EA1 produced very inhomogeneous foam, as shown in Fig. 9(a). A population of large cells reduced the cell density and led to a high  $\phi _v /\phi$ value. The EA level in this polymer is very low (∼0.4%). This may be insufficient to prevent partial depolymerization during processing, and affect foaming due to the presence of a residual monomer.
Once the EA content in SAN was increased to 5.6 wt%, nanofoams with small and very uniform cell sizes were produced [Fig. 9(b)]. Further increasing the EA content (i.e., the affinity of the blend for CO2) led once again to cell size enlargement and lower cell density.
SEM of foam from blends of SAN28/MMA-co-EA polymers. (a) SAN28/MMA-EA1 (50/50 wt%) blend (b) SAN28/MMA-EA6 (50/50 wt%) blend.

D. Interpretation of results
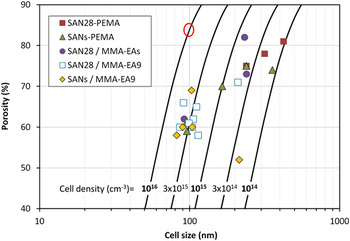
Figure 10 summarizes the foaming results for all the styrenic acrylic blends of this study. Some key lessons have been learned so far. First, it is possible to achieve very homogeneous nanofoams with SAN/acrylic (PEMA and copolymers) blends, with cell sizes of around 100 nm and cell densities up to 5 × 1015 cm−3. There is a synergistic effect since cell sizes can be much smaller and cell distributions much narrower than for either of the individual polymers. For instance the SAN16L/PEMA (50/50 wt%) blend (Table IV) shows a very fine homogeneous cell structure compared to foams made from either of the polymers. Another example is SAN28/MMA-EA9 (90/10 wt%) blend (Table V), for which addition of 10 wt% of acrylic polymer produced 100 times more cells that SAN28 alone at the same porosity.
Comparison of characteristics of nanofoams from all SAN/acrylic blends. O marks the properties of the best nanofoams previously made with nucleated acrylic polymers (Ref. Reference Costeux and Zhu14,Reference Costeux and Zhu15,Reference Costeux, Jeon, Bunker and Khan17 ).

Second, the compatibility of the two polymers influences the nanofoam morphology. For 50/50 wt% of blends, both SAN/PEMA and SAN/MMA-co-EA show a maximum in their cloud point temperature versus AN content (see Fig. 1), and thus the optimum compatibility during compounding corresponds to the AN content of the SAN around this maximum. Close to edge of the miscibility window (at low or high AN level), the blend morphology becomes metastable, and is likely to change when the blend is exposed to CO2. Examination of cell size polydispersity of blends with SAN polymers having various AN contents suggests that SAN with low AN levels could become more miscible with PMMA or PEMA when saturated with CO2, while high AN SAN could become less miscible (SAN40 with MMA-co-EA9 and SAN32 with PEMA). Best nanofoams are obtained for miscible blends, which contrasts with blending strategies found in the literature.Reference Ruckdäschel, Gutmann, Altstädt, Schmalz and Müller9,Reference Reglero Ruiz, Pedros, Tallon and Dumon11
Third, the initial assumption, based on previous work on acrylic nanofoams, that higher CO2 solubility is preferred to produce fine cell morphology by enhancing the production of nuclei is invalidated for SAN/acrylic blends. Results consistently show that for miscible blends, finer morphologies were produced when lowering the CO2 affinity of the blend. This was demonstrated by increasing the SAN content in the blends, replacing PEMA with less CO2-philic MMA-co-EA, or when decreasing the level of CO2-philic monomer (AN or EA) in one of the polymers. This suggests that nucleation mechanisms are different from the classical homogeneous nucleation theory.
Finally, in all cases porosities remain low, between 60 to 70 wt%. Increasing the porosity without increasing the cell size requires further enhancing of nucleation, which can be done with nucleating additives or with a different choice of foaming conditions. Indeed, standard conditions were initially chosen to maximize CO2 solubility, but this may not be the optimum approach for such blends, as mentioned before. An additional experiment was conducted to illustrate the benefit of adjusting foaming pressure and temperature. Nanofoams produced from the SAN28/MMA-EA9 50/50 (wt%) blend under standard conditions (T soak = 30 °C, P soak = 33 MPa, t soak = 10 h, PF at 60 °C for 3 min), characterized by φ = 104 nm, p = 60% and N = 2.5 × 1015 cm−3 are used as reference. The same blend was foamed under the following conditions of pressure and temperature: T soak = 35 °C, P soak = 30 MPa, t soak = 6 h, PF at 60 °C for 3 min. Both the decrease in pressure and increase in temperature reduce the CO2 uptake (a relative decrease of 10% for MMA-EA9 and 5% for SAN28). Changes are kept small to maintain a large pressure drop, and to avoid large changes in the viscosity of the polymer/CO2 system. The resulting nanofoam is shown in Fig. 11(a). It is characterized by φ = 92 nm, p = 71% and N = 4.7 × 1015 cm−3. The foam from the blend has a very narrow cell size distribution, as shown in Fig. 11(b), compared to the individual polymers foamed under the same conditions. Both the porosity and cell size were improved by the change of conditions.
SAN28/MMA-EA9 (50/50 wt%) foam produced at 35 °C/30 MPa/6 h, PF 60 °C/3 min (porosity 71%; Average Cell size: 92 nm). (a) SEM image (b) comparison of cell size distribution for the blend versus its individual components.

E. Potential mechanisms responsible for high nucleation densities
Two hypothesized mechanisms are considered to explain the foaming results observed with miscible blends, the first related to rheology of the blend with and without CO2, and the second to the phase behavior of the ternary system.
1. Role of rheology
The first hypothesis concerns the role of polymers' rheology on the synergistic foaming behavior of SAN/acrylic blends. It has been claimed in the literatureReference Dutriez, Satoh, Kamigaito and Yokoyama24,Reference Condo and Johnston25 that due to specific interactions between PMMA and SAN chains (responsible for their miscibility), there is an increase in the entanglement molecular weight in SAN/PMMA blends which translates into a lower viscosity than expected. Figure 12(a) shows the viscosity of MMA-EA9, SAN28 and their 50/50 (wt%) blend at 180 °C. The zero-shear viscosity of MMA-EA9 is 6 times as high as that of SAN28's. The viscosity of the blend predicted using the logarithmic mixing rule
 $$\log ({\rm{\eta }}_{{\rm{blend}}} ) = {\rm{\omega }}_{\rm{1}} \log ({\rm{\eta }}_{\rm{1}} ) + {\rm{\omega }}_{\rm{2}} \log ({\rm{\eta }}_{\rm{2}} )\quad,$$
where ωi are the weight fractions of the components, approximately close to experimental blend data. Thus there is no indication of the blend not behaving as a simple homogeneous mixture of its components in the melt.
Viscosity of MMA-EA9, SAN28 and their blend. (a) In the melt at 180 °C. (b) When saturated with CO2 at 30 MPa/35 °C.

Upon exposure to 30 MPa CO2, the situation becomes drastically different. Figure 12(b) shows the shear viscosity of the blend saturated with CO2 from HPSPRReference Park and Dealy21 data at 35 °C/30 MPa. Under these conditions, SAN28 becomes by far the more viscous of the two resins by about two orders of magnitude. The viscosity of the blend is intermediate.
While the difference in CO2 solubility can explain differences in viscosity shift factors for the two polymers, another reason for the high viscosity of the SAN/CO2 mixture at 30 °C could be the proximity of a glass transition for SAN/CO2. Indeed the T g of polystyrene (PS) exposed to high CO2 pressures decreases to about 30 °CReference Dutriez, Satoh, Kamigaito and Yokoyama24 due to the plasticization effect of CO2. In comparison, the T g of PMMA is either suppressedReference Condo and Johnston25 or decreased below 10 °CReference Dutriez, Satoh, Kamigaito and Yokoyama24 due to its high CO2 affinity as the temperature is decreased. SAN has a higher T g than PS in the absence of CO2, but will be slightly more plasticized due to a higher CO2 solubility. Thus it is likely that the T g of SAN under 30 MPa CO2 pressure will remain similar to that of PS.
The very high viscosity for the blend compared to MMA-EA9 supports the hypothesis that upon addition of higher levels of SAN, polymer elasticity restricts molecular motions responsible for the initial expansion of the nuclei. Without such a mechanism, bubbles would rapidly form and consume CO2. Instead, high elasticity favors the creation of a larger number of stable nuclei that are responsible for the fine cell morphology of these blends.
It should be noted that the previous mixing rule would not be able to predict the blend viscosity in the presence of CO2 shown in Fig. 12(b), because the viscosity of the 50/50 (wt%) blend is not half-way between those of the 2 polymers. It would be easy to conclude that the blend is not homogeneous; yet, one has to consider the possibility that, unlike MMA-EA9, SAN28 may not be completely in the rubbery regime under these conditions. A material on the verge of reaching the glassy state would have very high viscosity but would also likely slip on the surface of the rheometer plate due to its high elasticity, therefore showing a lower apparent viscosity for SAN28.
2. Role of phase behavior of the ternary system
The second hypothesis relates to the phase behavior of the polymer blend with CO2. As mentioned before, it is likely that close to the phase boundary of the blend (see Fig. 1), metastable states exist that could be made either stable or unstable by exposure to CO2. Yet, no direct observation was made of a miscible SAN/acrylic blend producing nanofoams in which the polymers are phase-separated, or vice versa. Based on the high blend viscosities at low temperature and high CO2 pressure, polymer blend morphology may be kinetically trapped over the timescale of the experiment.
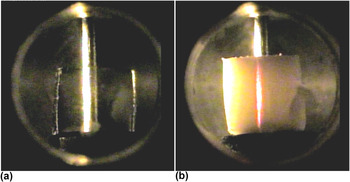
Visualization experiments in a pressurized cell at a CO2 pressure of 33 MPa were conducted to detect changes in the phase behavior. Observations showed that MMA-EA9 remained transparent over several hours in the temperature range of 35–50 °C [Fig. 13(a)]. In contrast, the SAN28/MMA-EA9 (50/50 wt%) blend remained transparent during CO2 sorption but started displaying signs of scattering over time. This effect was more pronounced at 50 °C, where the blend progressively became turbid and took a reddish hue, as shown in Fig. 13(b). This scattering phenomenon that predominantly scatters shorter wave lengths (Tyndall effect) can be caused by diffusing domains with size of the order of 100 nm. These domains would presumably be smaller at low temperature, resulting in less scattering, but with the ability to nucleate a large number of cells. Several hypotheses can be considered for the origin of these scattering domains.
Visualization experiments in a cell pressurized with CO2 at T = 50 °C and P = 33 MPa (a) pure MMA-EA9; (b) SAN28/MMA-EA9 (50/50 wt%) blend showing scattering.

A known mechanism for scattering in ternary systems involves pressure-induced crystallization, observed with PVDF in PMMA/PVDF/CO2 systems.Reference Walker, Melnichenko, Wignall, Lin and Spontak26 This mechanism is unlikely with SAN/acrylic blends, which do not readily crystallize, even at high pressure.
The alternative is a spontaneous phase separation of one of the polymers (likely SAN, which has less affinity for CO2), or of CO2 itself. To probe this hypothesis, a separate experiment was carried out, where a sample initially pressurized at 30 °C was maintained at this temperature for 4 h, and subsequently heated to 50 °C. A very similar scattering phenomenon, with the same reddish hue, appeared within a few minutes of the temperature increase. The timescale of this change gives a clear indication of the mechanism involved. This time is significantly shorter than the average relaxation time of the blend (over 1000 s based on the viscosity curve of the ternary system in Fig. 12). Thus we can discard polymer phase separation, which would have much kinetics. However, this timescale is consistent with a separate CO2 phase being formed due to the decrease of CO2 solubility as the temperature is increased to 50 °C. This suggests the possibility that even at temperatures as low as 30 °C, CO2 could form a separate phase or undergo spatial concentration fluctuations in the blend at sufficiently high pressures due to it being less compatible with one of the two blend components. This component is likely to be SAN, which has a lower CO2 solubility than the blend. Indeed, due to the molecular miscibility between the styrenic and acrylic polymers, SAN molecules are forced into an interaction with CO2 that carries a free energy penalty. This could result in fluctuations of CO2 concentration that seed nanoscale bubbles during depressurization, and thus contribute to producing homogeneous foams. This effect would be enhanced for miscible polymer systems that contain a higher fraction of SAN with poor CO2 affinity (low acrylonitrile content). In situ experiments are planned to further investigate the role of the phase behavior of the ternary system by characterizing the interaction parameters between the blend components and CO2.
IV. CONCLUSIONS
The addition of PEMA or MMA-co-EA to SAN copolymers led to the production of nano-cellular foams with very narrow cell size distributions and smaller cell sizes than those obtained with the pure polymers. This effect was particularly apparent for miscible blends, which is in contrast with previous research showing the benefit of micro-phase separation on cell nucleation.
Cell size averages below 100 nm are reported, with porosities in the range of 60–70%. MMA-co-EA polymers overall proved to be more effective than PEMA to achieve high nucleation densities of up to 5 × 1015 cm−3. The majority of the data suggests that maximizing CO2 solubility in these blends does not provide maximum nucleation density, but that on the contrary, using a less CO2-philic blend composition can produce a finer cell structure without loss of porosity.
It is hypothesized that at high pressure, under conditions where the two polymers are miscible, the equilibrium of the ternary system becomes precarious and a phase separation could occur. While experimental data to this day are insufficient to ascertain the exact mechanism, we suggest that CO2 concentration fluctuations could result from this phase transition, and promote the generation of very high cell density and homogeneous cell size distribution as the system is subsequently foamed by rapid depressurization. The high viscosity of the ternary system could contribute effectively to the stabilization of the cells.
ACKNOWLEDGMENTS
This material is based on the work supported by the U.S. Department of Energy under Grant No. DE-EE0003916. The Dow chemical Company is acknowledged for permission to publish this work. We thank the following Dow colleagues for analytical support: Diego Cristancho for MSB data, Cliff Todd for high resolution SEM imaging, Philip Lin for STXM measurements, and Anand Badami for TEM imaging. High pressure viscosity measurements were carried out by Dr. Hee-Eon Park at McGill University, Montreal (Canada). We are grateful to Prof. Zhen-Gang Wang (California Institute of Technology) and Prof. Nitash Balsara (University of California Berkeley) for many stimulating discussions on the complex behavior of polymer/CO2 systems.
Disclaimer: This report was prepared as an account of work sponsored by an agency of the United States Government. Neither the United States Government nor any agency thereof, nor any of their employees, makes any warranty, express or implied, or assumes any legal liability or responsibility for the accuracy, completeness, or usefulness of any information, apparatus, product, or process disclosed, or represents that its use would not infringe privately owned rights. Reference herein to any specific commercial product, process, or service by trade name, trademark, manufacturer, or otherwise does not necessarily constitute or imply its endorsement, recommendation, or favoring by the United States Government or any agency thereof. The views and opinions of the authors expressed herein do not necessarily state or reflect those of the United States Government or any agency thereof.