I. INTRODUCTION
Impact avalanche transit time (IMPATT) devices based on Silicon are well established to provide high power and high efficiency at millimeter-wave frequencies [Reference Midford and Bernick1–Reference Gray, Kikushima, Morentc and Wagner3]. In an IMPATT oscillator, the radio frequency (RF) power should be efficiently transferred from the active region of the device to the external load. This can be ensured by matching the real part of the device impedance to the real part of the load impedance by using a matching network with low loss at the resonant frequency at which the total reactance of the device–circuit combination is zero. However, the power loss taking place in the inactive region of the device cannot be compensated by the external circuitry. This loss should be minimized, otherwise it can severely degrade the overall performance of the oscillator. The undepleted portion of the device contributes to positive series resistance and RF power is dissipated there as heat. The parasitic series resistance originates from the unswept epitaxial layer, substrate layer, and contact layers of the device. Since the negative resistance of millimeter-wave IMPATTs is in the range of few ohms, the positive series resistance is to be kept to a minimum possible value by an appropriate design of the structural, doping, and bias current parameters of the device to obtain maximum RF power output from the device. The direct measurement of series resistance is difficult [Reference Ray and Gupta4, Reference Misawa5] due to network analyzer associated errors and the complexity of accurate device–circuit modeling. Adlerstein et al. [Reference Adlerstein, Holway and Chu6], in 1983, experimentally measured the series resistance of GaAs double-drift region (DDR) IMPATT devices in the 34–44 GHz frequency range by an indirect method. They determined the series resistance of the device used as a power source in an oscillator circuit by measuring the threshold current at resonant frequency. Some theoretical and experimental studies were later reported [Reference Mitra, Das, Kar and Roy7, Reference Pal8] on the electrical series resistance of X- and Ka-band IMPATT diodes. The series resistance of millimeter-wave Ka-band IMPATTs was calculated from small-signal simulation [Reference Pal8] and the same was compared with the experimental data. The small-signal analysis has the limitation of predicting accurately both the series resistance and the output power of mm-wave IMPATTs since practical situation demands large-signal simulation.
The authors in the present paper have proposed a novel method to estimate the parasitic series resistance of a 35 GHz Silicon Single-Drift Region (SDR) IMPATT device from the simulated large-signal electric field snapshots at different instants of time in a complete cycle of steady-state oscillation. A large-signal simulation technique based on non-sinusoidal voltage excitation was developed [Reference Acharyya, Banerjee and Banerjee9–Reference Acharyya, Banerjee and Banerjee11] and used by the authors for this purpose. The series resistance of the device is calculated first by noting the magnitudes of depletion width modulation at different instants of time from the electric field snapshots and then finding the time-dependent parasitic resistance due to unswept epitaxy. Finally, the time average of the series resistance over a full cycle of steady-state oscillation is obtained. The fixed values of series resistance due to an n +-substrate layer and different contact layers are calculated and added to the time average value to obtain the total parasitic positive series resistance responsible for power dissipation within the device. The value of series resistance of a 35 GHz Si SDR IMPATT diode obtained from the proposed method of analysis is compared with the experimentally reported value [Reference Pal8] and these are found to be in close agreement. The authors also calculated the series resistance of the device from the conventional method involving large-signal admittance characteristics at the resonant frequency and compared the same with that obtained from the proposed method as well as that reported experimentally.
II. LARGE-SIGNAL SIMULATION TO OBTAIN ELECTRIC FIELD SNAPSHOTS
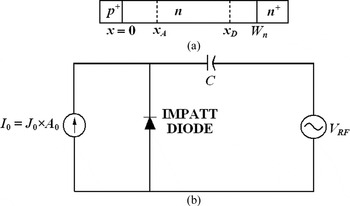
One-dimensional model of the reverse biased p +-n-n + structure shown in Fig. 1(a) is taken for the large-signal simulation of an SDR IMPATT device since the physical phenomena take place in the semiconductor bulk along the symmetry axis of the mesa structure of IMPATT devices. The fundamental time- and space-dependent device equations, i.e., Poisson's equation (equation (1)), continuity equations (equations (2) and (3)), and current density equations (equations (4) and (5)) involving mobile space charge in the depletion layer are simultaneously solved under a large-signal condition with appropriate boundary conditions by using a double-iterative field maximum computer method [Reference Acharyya, Banerjee and Banerjee9–Reference Acharyya, Banerjee and Banerjee11]. The fundamental device equations are given by
 $${d\xi \left(x\comma \; t \right)\over dx} = {q \over \varepsilon_s} \left(N_D - N_A + p \left(x\comma \; t \right)- n\left(x\comma \; t \right)\right)\comma \;$$
 $$\eqalign{{\partial p\left(x\comma \; t \right)\over \partial t} &= - {\partial J_p \left(x\comma \; t \right)\over \partial x} + q\left(n\left(x\comma \; t \right)\alpha_n \left(x\comma \; t \right)v_n \left(x\comma \; t \right)\right. \cr &\left. \quad + \,p\left(x\comma \; t \right)\alpha_p \left(x\comma \; t \right)v_p \left(x\comma \; t \right)\right)\comma \; }$$
 $$\eqalign{{\partial n\lpar x\comma \; t\rpar \over \partial t} &= {\partial J_n \lpar x\comma \; t\rpar \over \partial x} + q\left(n\left(x\comma \; t \right)\alpha_n \left(x\comma \; t \right)v_n \left(x\comma \; t \right)\right. \cr &\left. \quad +\, p\left(x\comma \; t \right)\alpha_p \left(x\comma \; t \right)v_p \left(x\comma \; t \right)\right)\comma \; }$$
 $$J_p \left(x\comma \; t \right)= qp \left(x\comma \; t \right)v_p \left(x\comma \; t \right)- qD_P \left({\partial p\left(x\comma \; t \right)\over \partial x} \right)\comma \;$$
 $$J_n \left(x\comma \; t \right)= qn \left(x\comma \; t \right)v_n \left(x\comma \; t \right)+ qD_n \left({\partial n\lpar x\comma \; t\rpar \over \partial x} \right)\comma \;$$
where N D and N A are the donor and acceptor concentrations, respectively, p(x, t) and n(x, t) are, respectively, the electron and hole concentrations at the space point x at the instant t, ξ(x,t) is the electric field at x at the instant t, J n(x,t) and J p(x,t) are, respectively, the electron and hole components of bias current density (J 0(t) = J n(x,t) + J p(x,t)) at x at the instant t, q is the electric charge of an electron (q = 1.6 × 10⁻¹⁹ C), and ɛ s is the permittivity of the semiconductor material. In the above-mentioned simulation method, the computation starts from the field maximum near the metallurgical junction. Boundary conditions at the contacts (at the p +–n and n +–n contacts) are obtained by setting up appropriate restrictions in equations (1)–(5). The boundary conditions for the electric field at the depletion layer edges are given by
 $$\xi \left(0\comma \; t \right)= 0 \quad {\rm and}\quad \xi \left(W_n\comma \; t \right)= 0.$$
(a) One-dimensional model of the SDR IMPATT device and (b) voltage driven IMPATT oscillator and associated circuit.

Similarly, the boundary conditions for normalized current density P(x,t) = (J p(x,t)−J n(x,t))/J 0(t) (where J 0(t) = J p(x,t) + J n(x,t)) at the depletion layer edges, i.e., at x = 0 and x = W n are given by
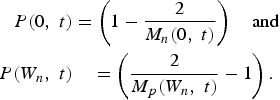 $$\eqalign{P \lpar 0\comma \; t \rpar &= \left( 1 - {2 \over {M_n \lpar 0\comma \; t\rpar}} \right) \quad {\rm and} \cr P \lpar W_n\comma \; t \rpar &\quad = \left({2 \over M_p \lpar W_n\comma \; t\rpar } - 1 \right).}$$
M n(0,t) and M p(W n,t) are the electron and hole multiplication factors at the depletion layer edges given by
 $$M_n \left({0\comma \; t} \right)= {J_0 \lpar t\rpar \over J_n \lpar 0\comma \; t\rpar } \quad {\rm and} \quad M_p \left(W_n\comma \; t \right)= {J_0 \lpar t\rpar \over J_p \lpar W_n\comma \; t\rpar }.$$
The diode voltage (V B(t)) and avalanche zone voltage drop (V A(t)) at any time instant are calculated by integrating the spatial electric field profile over the total depletion layer width (W n) and avalanche layer width (x A), respectively, at that particular instant of time, i.e.
 $$V_B \left(t \right)= \vint_0^{W_n} \xi \left(x\comma \; t \right)dx \quad {\rm and} \quad V_A \left(t \right)= \vint_0^{x_A} \xi \left(x\comma \; t \right)dx.$$
Direct current (DC) values of the peak electric field (ξ p), breakdown voltage (V B), and avalanche zone voltage (V A) drop can be evaluated by taking the time averages of time varying peak electric field (ξ p(t)), diode voltage (V B(t)), and avalanche zone voltage drop (V A(t)) over a complete time period of steady-state oscillation (T = 1/f, where f is the fundamental frequency of the steady-state oscillation). Thus, the DC values of the peak electric field (ξ p), breakdown voltage (V B), and avalanche zone voltage (V A) are given by
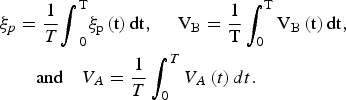 $$\eqalign{\xi_p &= {1 \over T} \vint_0^T \xi_p \left(t \right)dt\comma \; \quad V_B = {1 \over T} \vint_0^T V_B \left(t \right)dt\comma \; \cr &\quad {\rm and} \quad V_A = {1 \over T} \vint_0^T V_A \left(t \right)dt.}$$
In the present simulation method, the IMPATT device is considered as a non-sinusoidal voltage driven source as shown in Fig. 1(b). The input alternating current (AC) voltage is taken as
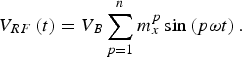 $$V_{RF} \left(t \right)= V_B \sum\limits_{p = 1}^n {m_x ^p} \sin \left(p\omega t \right).$$
The bias voltage is applied through a coupling capacitor (C) to study the performance of the device at a given fundamental frequency (f = ω/2π) with its n harmonics.
The snapshots of electric field and current density profiles in the depletion layer of IMPATT device are obtained from the simultaneous numerical solution of the basic device equations (equations (1)–(5)) subject to appropriate boundary conditions (equations (6) and (7)). The large-signal simulation is carried out by considering 500 space steps and 100–150 time steps with sufficient accuracy. The large-signal program is run until the limit of one complete cycle (i.e., 0 ≤ ωt ≤ 2π) is reached with a bias current density (J 0), RF voltage amplitude (V RF), and frequency (f). The waveforms associated with terminal current and voltage during a complete cycle of oscillation are analyzed to study the variation of device characteristics at various instants of time (ωt = 0, π/2, π, 3π/2, 2π) during one complete cycle of steady-state oscillation. The next cycles are repeated to study the oscillation stability. The fundamental device characteristics such as large-signal negative conductance (G(ω)), susceptance (B(ω)), negative resistance (Z R(ω)), reactance (Z X(ω)), and Q-factor (Q p = −B p/G p, where G p and B p are the large-signal peak negative conductance and corresponding susceptance, respectively, at optimum frequency (f p)) are investigated. Considering a circular cross-sectional area of the device, A 0= π (D 0/2)Reference Chang, Hellum, Paul and Weller2; where D 0 is the device effective p +-n junction diameter, the large-signal negative conductance (G(ω)), susceptance (B(ω)) normalized with respect to the device junction area A 0 are their respective effective values at the voltage generator fundamental frequency. These values are obtained by detailed Fourier analysis of the terminal current and voltage waveforms. The large-signal admittance of the device is Y D(ω) = [G(ω) + j B(ω)]A 0. Therefore, the large-signal impedance of the device is given by
 $$Z_D \left(\omega \right)= {1 \over Y_D \lpar \omega \rpar } = {1 \over \left[G\lpar \omega \rpar + jB\lpar \omega \rpar \right]A_0} = Z_R \left(\omega \right)+ jZ_X \left(\omega \right).$$
In the above equation, Z R(ω) and Z X(ω) are the large-signal negative resistance and reactance of the device, respectively. If R S is the series resistance associated with the device, then the effective device impedance becomes
 $$Z_{D_{eff} } \left(\omega \right)=\left({Z_R \left(\omega \right)+R_S } \right)+jZ_X \left(\omega \right).$$
The effective admittance of the device is given by
 $$Y_{D_{eff}} \left(\omega \right)= {1 \over Z_{D_{eff}} \lpar \omega\rpar } = \left[G_{eff} \left(\omega \right)+ jB_{eff} \left(\omega \right)\right]A_0.$$
The large-signal RF power output may be calculated as
 $$P_{RF} = {1 \over 2} V_{RF}^2 \left\vert \left(G_{eff} \right)_p \right\vert A_0\comma \;$$
where V RF is the RF voltage, |(G eff)p| is the magnitude of large-signal peak effective negative conductance normalized with respect to effective junction area (A 0). The large-signal DC to RF conversion efficiency (η L) of the device is obtained from
 $$\eta_L = {P_{RF} \over P_{DC}}\comma \;$$
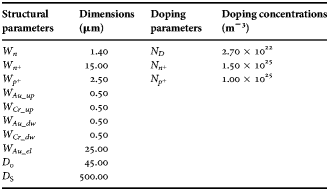
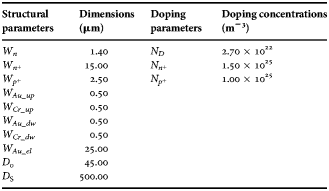
where P DC = J 0V BA 0 is the input DC power and J 0 is the DC bias current density. The width of the epitaxial n-layer (W n), background doping concentration (N D), and bias current density (J 0) are varied to optimize the large-signal power and efficiency of the device. Width of the epitaxial n-layer (W n), corresponding doping concentration (N D), and bias current density (J 0) are varied to optimize the large-signal power and efficiency of the device. The corresponding optimized structural and doping parameters [Reference Pal and Banerjee12] (widths of n +- and p +-layer (W n+ and W p+), widths of upper and lower metal (Au, Cr) contact layers (W Au_up, W Cr_up, W Au_dw, and W Cr_dw), width of the electroplated gold layer (W Au_el), diameter of the p +-n junction (D 0), diameter of the bottom surface of p +-layer (D S), n +- and p +-layer doping concentrations (N n+ and N p+)) are given in Table 1. The bandgap energy (E g), intrinsic carrier concentration (n i), effective density of states of conduction and valance bands (N c, N v), electron and hole diffusion coefficients (D n., D p), mobilities (μ n, μ p), diffusion lengths (L n, L p), permittivity (ɛ s), and the field dependence of ionization rates (α n, α p) and saturated drift velocities (v sn, v sp) of Si are taken from the recently published experimental reports [Reference Grant13–16]. The junction temperature (T j) under a practical continuous wave (CW) operating condition is taken to be 500 K.
Structural and doping parameters.
III. NUMERICAL CALCULATION OF SERIES RESISTANCE
A) The proposed novel method
The electric field snapshots of the IMPATT device is first obtained from large-signal simulation at different instants of time in a full cycle (time period, T = 1/f) of steady state oscillation. These snapshots show time varying depletion width modulation caused by time variation of the magnitude of peak electric field (ξ p(t)) at the junction plane (p +-n junction). Under a large-signal condition the depletion layer width thus becomes a time-dependent parameter (x D(t)). If the epitaxial n-layer width (W n) and doping concentration (N D) are chosen properly so that the electric field just punches through the n−n + interface of the device, then at any instant of positive half cycle of ξ p(t), the electric field at each space point (ξ(x, t)) remains either greater than or equal to the corresponding time average values (ξ(x) = ∫Tξ(x, t) dt). The device then operates in punch through mode and consequently the width of the undepleted epitaxial n-layer (W n−x D(t)) becomes zero at all instants of time during the positive half cycle of ξ p(t). However, during the negative half cycle of ξ p(t), the electric field at each space point (ξ(x, t)) decreases below the respective average value (ξ(x)) and the undepleted epitaxial n-layer width (W n−x D(t)) has some finite positive value at all instants of time of that half cycle, since (W n−x D(t)) > 0. Thus, the undepleted epitaxial n-layer gives rise to a time-varying component of parasitic series resistance (R n(t)) during the negative half cycle of ξ p(t), which is the major component of the total series resistance (R S(t)) of the device. Another component of R S(t) is the fixed value of electrical series resistance (R S0) arising from the n +-substrate layer and different contact layers of the device.
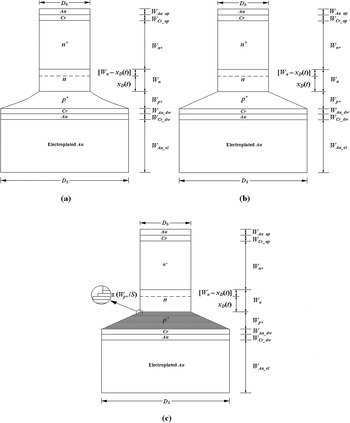
The ordinary mesa structure of Si SDR IMPATT device is shown in Fig. 2(a) [Reference Pal and Banerjee12]. The cross-sectional area of the device is assumed to be circular and the diameters and thicknesses of different layers are shown in Fig. 2. The mesa etched p +-layer is approximated to be a tapered conical-shaped structure (Fig. 2(b)). Again the tapered conical shaped p +-layer is considered to consist of a number of concentric cylindrical layers one below the other each having the same thickness (W p+/S, where S is the number of cylinders) with increasing diameter from D 0 to D S−1 (Fig. 2(c)). Now the time-varying series resistance due to an undepleted n-layer is given by
 $$R_n \left(t \right)= \left({1 \over qN_D \mu_n} \right)\left({W_n - x_D \left(t \right)\over A_0} \right)\comma \;$$
where x D(t) is the time-varying depletion layer width obtained from the large-signal simulation of the device. The p +-layer is considered to consist of a number of concentric cylindrical layers one below the other, each having the same thickness (W p+/S, where S is the number of cylinders) with increasing diameter from D 0 to D S−1 (Fig. 2(c)). The series resistance due to p +-layer can be obtained from the following relation:
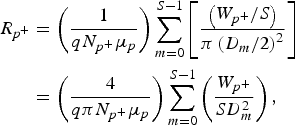 $$\eqalign{R_{p^+} &= \left({1 \over qN_{p^+} \mu_p} \right)\sum\limits_{m = 0}^{S - 1} \left[{\left(W_{p^+} /S \right)\over \pi \left(D_m /2 \right)^2} \right]\cr &= \left({4 \over q\pi N_{p^+} \mu_p} \right)\sum\limits_{m = 0}^{S - 1} \left({W_{p^+} \over SD_m^2} \right)\comma \; }$$
where (D m+1−D m) = (D S−1−D 0)/(S−1) for 0 ≤ m ≤ (S−2). The total fixed electrical series resistance due to upper side (W Au_up, W Au_up) and lower side (W Au_dw, W Au_dw) contact layers, the electroplated gold layer (W Au_el), a p +-contact layer, and the n +-substrate layer (W n+) is given by
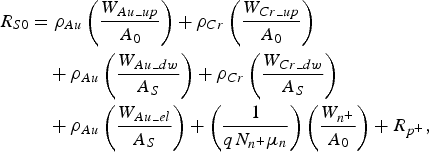 $$\eqalign{R_{S0} &=\rho _{Au} \left({W_{Au\_up} \over A_0} \right)+ \rho_{Cr} \left({W_{Cr\_up} \over A_0} \right)\cr &\quad+ \rho_{Au} \left({W_{Au\_dw} \over A_S} \right)+\rho_{Cr} \left({W_{Cr\_dw} \over A_S} \right)\cr &\quad + \rho_{Au} \left({W_{Au\_el} \over A_S} \right)+ \left({1 \over qN_{n^+} \mu_n} \right)\left({W_{n^+} \over A_0} \right)+ R_{p^+}\comma \; }$$
where the area of the device below the p +-layer is A S = π(D S/2)Reference Chang, Hellum, Paul and Weller2; D S is the diameter of the device below the p +-layer. The resistivity of gold (ρ Au) and chromium (ρ Cr) layers are taken from [17]. The dimensions (diameters and thicknesses as shown in Fig. 2) of different layers of the 35 GHz Si SDR IMPATT device operating in the CW mode are taken from recently published reports [Reference Pal8, Reference Pal and Banerjee12] and already given in Table 1. The total time varying electrical series resistance of the SDR IMPATT device is given by
 $$R_S \left(t \right)=R_{S0}+R_n \left(t \right).$$
(a) Ordinary mesa structure of SDR IMPATT diode, (b) the mesa etched p +-layer is approximated to be a tapered conical-shaped structure, and (c) the tapered conical shaped p +-layer is considered to consist of a number of concentric cylindrical layers one below the other each having the same thickness (W p+/S, where S is the number of cylinders) with increasing diameter from D 0 to D S−1.

The average value of series resistance (R S) is calculated by taking the time average of R S(t) over one complete cycle of steady-state oscillation. i.e.
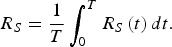 $$R_S = {1 \over T} \vint_0^T R_S \left(t \right)dt.$$
B) Conventional state of art
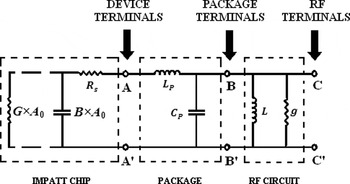
An equivalent circuit representation of packaged IMPATT source is shown in Fig. 3, where G and B are, respectively, the negative conductance and susceptance of the IMPATT device. The large-signal magnitudes of G and B (normalized by the p +-n junction area of the device (A 0)) at different frequencies are obtained from the large-signal simulation method described in the previous section. R S is the series resistance of the device, g is the load conductance, and L is the circuit inductance. C p and L p are the package capacitance and inductance, respectively.
Equivalent model of the packaged IMPATT source.

At the threshold condition, the magnitude of the device negative conductance (|G|) is much larger than the positive conductance of an RF circuit (g) and so the oscillation builds up. The oscillation is started by a random noise fluctuation which grows when the total conductance of the device–circuit system is negative. For stability of oscillation, it is necessary that the magnitude of the negative conductance of the active device will decrease with the growth of the amplitude of oscillation. The oscillation continues to build up for several cycles until the magnitude of the device negative conductance decreases to the value of positive conductance of the load and the oscillation then becomes stable (i.e., at steady-state |G| = |g|) [Reference Kurokawa18]. In the practical case, it is a good approximation to take g = 0 at the threshold of oscillation (i.e., when |G th| ≫ |g|) [Reference Adlerstein, Holway and Chu6–Reference Pal8]. Under this situation, expression for series resistance (R S) is given by [Reference Pal8] (considering the package inductance L P and package capacitance C P and the equivalent circuit of the IMPATT device shown in Fig. 3):
 $$R_S = {\left\vert G_{th} \times A_0 \right\vert \over \left[\left(G_{th} \times A_0 \right)^2 + \left(B_{th} \times A_0 - B_{par} \right)^2 \right]}$$
where G th is the large-signal conductance of the device at the threshold condition when the total conductance of the packaged device becomes just negative, B th is the large-signal susceptance of the device corresponding to the conductance G th and B par = 1/(ωL p−(1/ωC p)) is the effective susceptance caused by package parameters. Both G th and B th are normalized with respect to the p +-n junction area of the device (A 0). Thus, from the knowledge of negative conductance and positive susceptance of the device at oscillation threshold (i.e., G th and B th), effective device junction area (A 0), and effective susceptance caused by package parameters (B par), the value of the series resistance (R S) can be estimated from equation (22) [Reference Pal8].
IV. RESULTS AND DISCUSSION
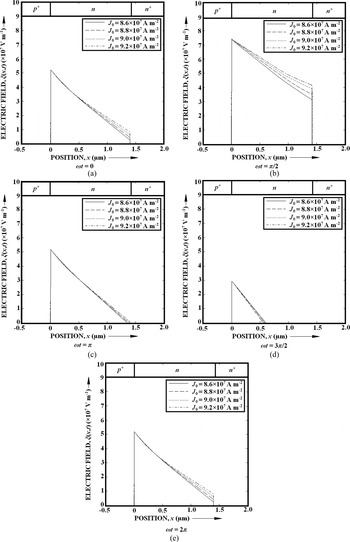
The large-signal electric field snapshots at quarter cycle intervals are shown in Fig. 4(a) through Fig. 4(e) for five different phase angles at different bias current levels, but at a fixed value of voltage modulation (55%). With increasing bias current density from 8.6 × 10⁷ to 9.2 × 10⁷ A m−2 and corresponding bias current from 136.8 to 146.3 mA, distortion and nonlinearity is observed in the snapshots at each phase angles (ωt = 0, π/2, π, 3π/2, 2π). This is due to the mobile space charge effect at higher current densities [Reference Sridharan and Roy19, Reference Sridharan and Roy20]. The electric field snapshots exhibit depletion width modulation at large-signal level for 55% voltage modulation (Fig. 4(a–e)). This modulation changes both with time and bias current density. Higher depletion width modulation suggests higher punch through factor (PTF) where PTF is defined as
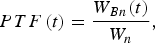 $$PTF \left(t \right)= {W_{Bn} \lpar t\rpar \over W_n}\comma \;$$
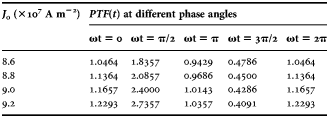
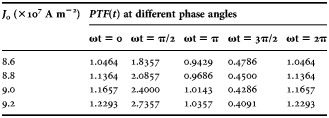
where W Bn(t) is the depletion layer width at time t required by the electric field to be just punched through and W n is the fixed designed value of n-epitaxial layer width. The PTFs (PTF(t)) for different bias current densities and phase angles, obtained from the large-signal electric field snapshots are given in Table 2. It is observed from Table 2 that the PTF is highest at ωt = π/2 when the peak electric field is also highest and lowest at ωt = 3π/2 when the peak electric field is lowest. This holds good for all bias current densities. However, at a particular phase angle, PTF(t) increases with increasing bias current density. This is due to the fact that the field distortion due to mobile space charges increases at higher bias current density.
Snapshots of electric field profile for each quarter of one complete cycle of steady-state oscillation for different bias current densities (at 55% voltage modulation).

PTFs for different bias current densities at different phase angles.
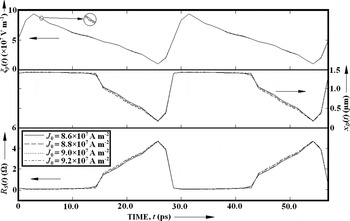
Time variations of peak electric field (ξ p(t)), depletion layer width (x D(t)), and series resistance (R S(t)) for consecutive cycles of steady-state oscillation obtained from the large-signal simulation of the device are shown in Fig. 5 for different bias current densities at 55% voltage modulation. The number of cylindrical segments of the mesa structure (S) is taken to be 100 in the calculation. As explained above, the width of the undepleted epitaxial n-layer (i.e., (W n−x D(t))) and the time-varying series resistance arising from the undepleted epitaxy (R n(t)) are both zero during the positive half cycles of the time varying peak field, ξ p(t) (Fig. 5). Consequently, the total time-varying series resistances (R S(t)) during this period is equal to the fixed series resistance (R S0) contributed from the n +-substrate layer and different contact layers (equation 4). However, during the negative half cycles of ξ p(t) the electric field at each space points (ξ(x, t)) decreases below the corresponding time average value (ξ(x)) for all bias current densities. As a result some portion of the epitaxial n-layer remains undepleted at all instants of time during the negative half cycles. Thus, the series resistance (R n(t)) arises only during the negative half cycles from the undepleted epitaxial n-layer for which (W n−x D(t)) > 0. It is observed from Fig. 5 that R S(t) increases to its maximum value at the instant of time during the negative half cycle of (ξ pt) when the magnitude of peak electric field is minimum and the undepleted epitaxial n-layer width (W n−x D(t)) is maximum. Thus, during the negative half cycle of (ξ pt), the series resistance arises mainly from the time-varying component of series resistance, R n(t) since R S0 ≪ R n(t).
Time variations of peak electric fields, depletion layer widths, and series resistances for two consecutive cycles of steady-state oscillation for different bias current densities (at 55% voltage modulation).

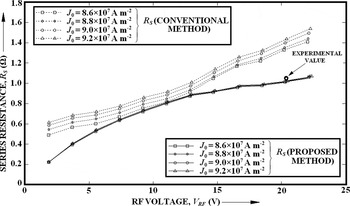
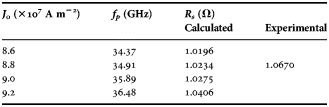
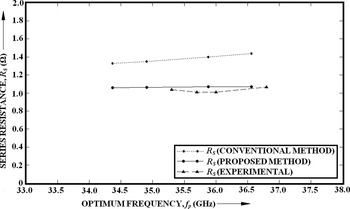
The total series resistance (R S) is thus obtained from the proposed method, described in detail in Section III(A). The series resistance (R S) is also calculated by following the conventional method, described in Section III(B). The variations of R S with RF voltage as well as bias current density are shown in Fig. 6. It is observed that the series resistance increases with the increase of voltage modulation factor (m x) at a fixed bias current or with the increase of bias current density (J 0) at a fixed voltage modulation factor (m x). This behavior can be explained as follows. At lower voltage modulation levels, the magnitude of swing of peak electric field (ξ p(t)) is small and it increases with the increase of voltage modulation factor (m x). Thus, higher the voltage modulation factor (m x), larger will be the width of the undepleted epitaxial n-layer ((W n−x D(t))) at any instant of time during the negative half cycle of ξ p(t). This leads to larger amplitude of R S(t) during the above-mentioned period. Thus, the average value of R S increases as the voltage modulation factor (m x) increases. The values of series resistance obtained from the proposed and conventional methods are given in Tables 3 and 4, respectively, for different bias current densities at a fixed voltage modulation of 55%. It is observed from Tables 3 and 4 and Fig. 6 that the series resistance obtained from the conventional method increases with bias current density (J 0); while the series resistance calculated from the proposed method is almost independent of bias current density (J 0). It is worthwhile to note from Fig. 6 that the values of series resistance obtained from the conventional method are much higher than those obtained from the proposed method for both lower and higher range of voltage modulation factor (m x) considered in the calculation. However, the values of series resistance obtained from both the proposed method and the conventional method are nearly same for the range of RF voltage from 7.35 to 12.86 V at the bias current density of 8.6 × 10⁷ A m−2. The values of series resistance obtained from the proposed depletion width modulation method and the conventional admittance method at different bias current densities can be compared with the experimentally reported value [Reference Pal8] from Tables 3 and 4, respectively.
Variations of series resistance with RF voltage for different bias current densities.

Series resistance calculated from depletion width modulation (the proposed method) for 55% voltage modulation.
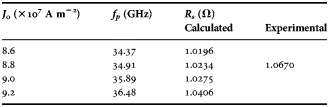
Series resistance calculated from admittance characteristics (the conventional method) for 55% voltage modulation.

The variations of series resistance with optimum frequency of Ka-band Si SDR IMPATT diode obtained from the conventional method, the proposed method, and experimental data [Reference Pal8] are shown in Fig. 7. It is observed from Fig. 7 that the series resistance obtained from the proposed method is in closer and better agreement with that reported experimentally as compared with that obtained from the conventional method. At 36.48 GHz, the theoretical value of series resistance obtained from the proposed method is in closest approach to the experimental one.
Series resistance calculated by using the conventional method, the proposed method, and series resistance obtained from experimental measurement [8] versus optimum frequency.

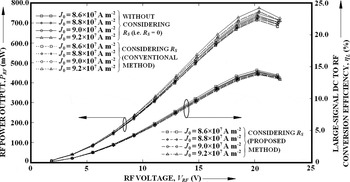
The variations of RF power output (P RF) and large-signal DC to RF conversion efficiency (η L) with RF voltage at different bias current densities are shown in Fig. 8. The p +-n junction area of the device (A 0) for CW operation is taken to be 1.5904 × 10⁻⁹ m−2 corresponding to the circular cross-section of the device (p +-n junction diameter, D 0 = 45 µm). It is interesting to observe from Fig. 8 that the RF power output increases sharply with the increase of voltage modulation (m x) upto 50%, after which it decreases slowly up to 55% voltage modulation. When the voltage modulation exceeds 55% the RF power output falls sharply with the increase in the voltage modulation. This sharp fall of RF power output is due to sharp decrease in the magnitude of G p for voltage modulation above 55%. The variation of large-signal efficiency (η L) with RF voltage for a particular bias current density follows a similar nature as that of P RF. Hence, the results indicate that the voltage modulation should be kept below 55% to prevent degradation of large-signal performance of the device. On the other hand, P RF increases as the bias current density increases for a particular voltage modulation factor (m x). However, the large signal DC to RF conversion efficiency (η L) decreases as the bias current density increases for a particular voltage modulation factor (m x).
Variations of RF power output and large-signal DC to RF conversion efficiency with RF voltage for different bias current densities.

V. CONCLUSIONS
A novel method is proposed in this paper to calculate the parasitic series resistance of millimeter-wave IMPATT devices from the time-dependent depletion width modulation obtained from the large-signal electric field profile snapshots. The results show that the series resistance calculated from the proposed method is in closer and better agreement with those reported experimentally as compared with that obtained from the conventional method.
ACKNOWLEDGMENTS
The authors are grateful to the associated editor of the journal Dr Dominique Schreurs and the anonymous reviewers for their constructive and valuable suggestions to improve the quality of the paper.
 Aritra Acharyya received his M.Tech. degree in Radio Physics and Electronics from Institute of Radio Physics and Electronics, University of Calcutta, Kolkata, West Bengal, India. He joined the Department of Electronics and Communication Engineering, Supreme Knowledge Foundation Group of Institutions, Sir J.C. Bose School of Engineering, Mankundu, Hooghly, West Bengal, India in 2010 as a lecturer. Presently, he has been working as an Assistant Professor in the same institution since 2011. He is the recipient of Pareshlal Dhar Bhowmik book award in the year 2010 for securing highest marks in M.Tech. (Radio Physics and Electronics) Examination 2010 from the University of Calcutta. His research interest is millimeter-wave and terahertz semiconductor devices, and their optical control. He is the principle co-author of more than 40 research papers in different national and international journals, and conference proceedings.
 Suranjana Banerjee received her B.Tech. and M.Tech. degree from the Institute of Radio Physics and Electronics, University of Calcutta, Kolkata, West Bengal, India. She topped the list of Electronics Honors graduates of Calcutta University in 2002. Presently, she is working as an Assistant Professor of Electronics and Communication Engineering Department in Academy of Technology, West Bengal University of Technology, Adisaptagram, Hooghly 712121, West Bengal, India. She has been carrying out research for Ph.D. degree in the area of millimeter-wave hetero-junction avalanche transit time (ATT) devices. She is the co-author of several research papers published in referred journals and Proceedings of International conferences.
 Professor (Dr.) J. P. Banerjee received the B.Sc. (Honours) and M.Sc. degrees in physics and Ph.D. degree in Radio Physics and Electronics all from the University of Calcutta (CU). He joined the Institute of Radio Physics and Electronics, CU in 1998 as a full Professor. He is the recipient of Indian National Science Academy Award and Griffith Memorial Prize for the best thesis in Science of the Calcutta University in 1996. He is the principal co-author of more than 170 research papers in International Journals in the fields of Semiconductor Science and Technology, Microwave and Millimeter-wave avalanche transit time devices and avalanche Photo Detectors. He is a Fellow of the Institute of Electronics and Communication Engineers (IETE), a life member of the society of EMI and EMC and Semiconductor Society, India. He is an expert committee member of All India Council of Technical Education and served as a referee for various technical journals.