




No CrossRef data available.
Article contents
Population biology of multispecies helminth infection: interspecific interactions and parasite distribution
Published online by Cambridge University Press: 23 May 2005
Abstract
Despite evidence for the existence of interspecific interactions between helminth species, there has been no theoretical exploration of their effect on the distribution of the parasite species in a host population. We use a deterministic model for the accumulation and loss of adult worms of 2 interacting helminth species to motivate an individual-based stochastic model. The mean worm burden and variance[ratio ]mean ratio (VMR) of each species, and the correlation between the two species are used to describe the distribution within different host age classes. We find that interspecific interactions can produce convex age-intensity profiles and will impact the level of aggregation (as measured by the VMR). In the absence of correlated exposure, the correlation in older age classes may be close to zero when either intra- or interspecific synergistic effects are strong. We therefore suggest examining the correlation between species in young hosts as a possible means of identifying interspecific interaction. The presence of correlation between the rates of exposure makes the interpretation of correlations between species more difficult. Finally we show that in the absence of interaction, strong positive correlations are generated by averaging across most age classes.
Information
- Type
- Research Article
- Information
- Copyright
- © 2005 Cambridge University Press
INTRODUCTION
Parasitic infections of humans have traditionally been investigated and controlled without consideration for the potential effects of multiple-species co-infection on either pathology or intervention outcomes. As a result of this isolationist approach, areas endemic for a mixture of bacterial, protozoan, and helminthic infections are receiving a combination of antibiotics, antimalarials, insecticide-treated bednets, and anthelminthics through essentially vertical programmes such as the Global Elimination of Trachoma (GET 2020) (Mariotti, Pararajasegaram and Resnikoff, 2003), the Roll Back Malaria partnership (Remme, Binka and Nabarro, 2001), the African Programme for Onchocerciasis Control (Sékétéli et al. 2002), the Global Programme for the Elimination of Lymphatic Filariasis (Molyneaux and Zagaria, 2002), and the Schistosomiasis Control Initiative (Fenwick et al. 2003). This approach persists despite and emerging body of evidence supporting the notion that polyparasitism may, in fact, shape experimental (Behnke et al. 2001; Cox, 2001), natural (Lello et al. 2004), epidemiological (Bundy, Sher and Michael, 2000) and clinical (Nacher et al. 2000; Harms and Feldeimer, 2002; Booth et al. 2004b) patterns, as well as the outcome of control interventions focused on particular species (Nacher, 2001; Booth et al. 2004a).
The role of factors such as density dependence, parasite-induced host mortality, host heterogeneity, and parasite clumping in shaping the distribution of helminth parasites among hosts has been discussed by a number of authors (Anderson and Gordon, 1982; Pacala and Dobson, 1988; Isham, 1995; Duerr, Dietz and Eichner, 2003). However, with the exception of several papers on interspecific competition and the coexistence of parasite species (Dobson, 1985; Roberts and Dobson, 1995; Gatto and De Leo, 1998), work has focused on single-species models. To our knowledge, there has been no theoretical investigation of the effect of interspecific interactions on the distribution of helminths among hosts. This is surprising given the high prevalence of multispecies coinfection both in human and animal populations (Petney and Ross, 1998) and the mounting evidence for the existence of interactions between helminth species (Christensen et al. 1987; Behnke et al. 2001; Cox, 2001).
We begin by deriving a simple deterministic model for the accumulation and loss of 2 interacting helminth species in a single, ageing host. This individual-based model is used to motivate a stochastic model that describes the distribution of the 2 helminth species in a population of hosts. We use this model to look at the effects of different types of interaction on mean worm burden and aggregation for each parasite species, and the correlation between these species. This is done through an analytical exploration of a linearized version of the stochastic model and by simulation, with results presented as functions of host age. Since ecological data on animal hosts are often not age-specific, we briefly explore the effects of combining measures of parasite aggregation and association across host age classes.
We will adopt the terminology of Behnke et al. (2001) and categorize the interactions as antagonistic or synergistic. Furthermore, we restrict ourselves to the analysis of pairs of helminth species. The mode of interaction is through the density of adult, established worms affecting the rates of establishment of incoming, larval stages of their own (homologous) species or the other (heterologous) species. These interactions may arise as the result of direct effects (e.g. exploitation competition) or may be immunologically-mediated, although at this stage we do not model the immune response explicitly. In this paper, we frequently focus on mutually antagonistic and mutually synergistic interactions. We define mutually antagonistic interactions as those in which parasites of each species reduce the establishment of parasites of the other species. Thus, these interactions induce host-protection from heterologous infection. Mutually synergistic interactions are defined as those in which parasites of each species enhance the establishment of the other species. These interactions result in increased host susceptibility to heterologous infection.
MODELS AND RESULTS
Deterministic formulation
A model for 2 interacting helminth species in a single ageing host, can be constructed by modifying the simple immigration-death framework (Tallis and Leyton, 1966; Anderson and May, 1991; Duerr et al. 2003).
The model includes larval (l1, l2) and adult (x1, x2) stages. At age a=0, there are no larvae or adults of either species: li(0)=xi(0)=0 (i=1, 2). For a>0, the rate of change with respect to host age a of the numbers of larvae and adults of each parasite species can be modelled as follows,

In this model, λi represents the net rate at which larval stages of species i (i=1, 2) invade the host. Incoming larvae either die or become established and reach the adult stage. Larvae of species i become adults at a per capita rate σi, and in the absence of any adult worms (of either species) die with a per capita death rate ηi. When adult worms are present, ηi is modulated by a factor of eγji for each adult worm of species j (j=1, 2). Thus adult worms of species j increase the larval death rate of species i if γji>0 and decrease it if γji<0. Note that the modulation is due to homologous adult worms when j=i and heterologous adult worms when j≠i. The per capita death rate, μi, of adult worms of species i is unaffected by the worm burden of either species (it is density independent). The notation, definition and units of the parameters for this model are summarized in Table 1.

The model can be simplified by making the assumption that the larval stage in each species is short-lived, relative to the adult lifespan (σi[Gt ]μi i=1, 2). Under this assumption, the dynamics of adult worm numbers are well described by a model in which larval numbers are at equilibrium

; Eqn. 1 then becomes

We will refer to this model as D (for deterministic). The differential equations in the system of Eqn. 2 can be solved numerically to give numbers of worms of species 1 and species 2 as functions of host age. It is worth stressing that xi(a) has been defined as the species i worm burden in a single host. Alternatively, xi(a) may be viewed as the mean worm burden of species i in an ageing cohort of hosts (Woolhouse, 1992a). This interpretation is advantageous in that it allows comparisons to be made with data from a population of hosts. However, the interpretation of the inter- and intraspecific interaction parameters (the γ coefficients) is now less obvious since the model is no longer individual-based.
For mutually antagonistic interactions, our simulations frequently show that the intensity of infection of one of the species is convex, i.e. it peaks, while that of the other species increases monotonically to approach an equilibrium. This is illustrated by the bottom two curves (the dashed lines) in Fig. 1. Since processes explaining ‘convex’ age-infection patterns are of interest in parasitology, we explore this phenomenon further in the section ‘Linearization’.

Fig. 1. Solutions to the deterministic model (D) giving worm burden as a function of host age. Three scenarios are illustrated: (a) no interaction (γ21=γ12=0), (b) mutually antagonistic interaction (γ21=0·01 γ12=0·07), (c) mutually synergistic interaction (γ21=0·01 γ12=−0.005). For each scenario, the thick line represents species 1 and the thin line species 2. Other parameter values: λi=1·5 month−1, σi=1 month−1, μi=1/72 month−1, ηi=0·5 month−1 (i=1, 2), γ11=0·03, γ22=0·01.
In the next section we develop a stochastic formulation of model D. The model will be used to give insight into the effects of interactions on the joint distribution of the two species in a population of hosts. In particular, this will allow us to explore the effects of interactions on the mean worm burden and dispersion for each species and also on the correlation between species; the latter two quantities can only be investigated with a stochastic model. Furthermore, since the stochastic model is individual-based, the interpretation of the interaction parameters is straightforward.
Stochastic formulation
In the stochastic model, we consider the changes of state in a small time period of length δ. By making δ arbitrarily small, possible changes of state are limited to (1) a worm of species i is acquired and (2) a worm of species i dies. The stochastic model can be specified by the rates of transition from one state to another for a host of age a with X1a worms of species 1 and X2a worms of species 2. Formally, we assume a Markov model for the bivariate process {X1a, X2a; a[ges ]0}; a process is Markovian if given the current state, the probability of being in a particular state in the future is independent of past states. The possible transitions for species 1 and the corresponding rates are as follows,

where

; and

where d1(x1, x2)=μ1x1.
Similar rates can be defined for species 2, i.e. for the transitions (X1a, X2a)→(X1a, X2a+1) and (X1a, X2a)→(X1a, X2a−1). This model will be referred to as model S (for stochastic). Model S is analysed by simulating species 1 and species 2 worm burdens in a number of ageing hosts using two properties of Markov processes. First, given that a host has x1 species 1 worms and x2 species 2 worms, the amount of time for which a host is in state (x1, x2) is determined by sampling from an exponential distribution with rate b1+b2+d1+d2 (note that the arguments of b1, etc. have been dropped for notational convenience). Secondly, on leaving state (x1, x2), the host enters state (x1+1, x2) with probability

, state (x1−1, x2) with probability

, etc. This can be simulated by generating a uniform random number, U, in [0, 1]. If

, the host enters state (x1+1, x2), if

it enters (x1−1, x2) and so on.
The non-linearity of the functions b1 and b2 makes analysis of model S difficult. However, some insight can be gained by approximating b1 and b2 by linear functions, as we now discuss.
Linearization
Provided that γ11x1+γ21x2[Lt ]1 and γ22x2+γ12x1[Lt ]1, the functions bi(x1, x2) (i=1, 2) may be approximated by the first terms of Taylor series expansions. The resulting approximations are linearly dependent on x1 and x2,

where

,

. These new ‘composite’ parameters can be thought of as follows: i represents the rate of parasite establishment of species i in the absence of adult worms, and

ji (i, j=1, 2) represents the extent to which each adult worm of species j affects the rate of establishment of species i. The effect is homologous (intraspecific) for j=i and heterologous (interspecific) for j≠i.
Using this linearization, we define a linear model (L). In this model, the rates at which adult worms are acquired are given by the linearized form of b1(x1, x2) and b2(x1, x2) provided that these functions are non-negative. For those values of x1 and x2 where the functions are negative, the rates are set to zero. Formally, the rate at which adult worms of species 1 are acquired by a host is

An equivalent function, ~2, is used for species 2, and the rates at which adult worms are lost from the host are as in model S. Model L approximates model S when γ11x1+γ21x2[Lt ]1 and γ22x2+γ12x1[Lt ]1, but it is also a well-defined model in its own right, that has the advantage of being analytically tractable.
Convex age-intensity profiles.
Assumptions outlined in Appendix A allow us to derive a set of differential equations to approximate the mean worm burdens of species 1 and species 2 at age a, under model L:

where E[Xia] is the expected (or mean) worm burden of species i at age a.
From the solution to these equations (Appendix A), model L predicts that when intra- and interspecific effects are antagonistic (γ's positive and non-zero), the age-intensity profile of species 1 peaks if the following condition is satisfied

Age-intensity profiles that peak and subsequently decline, rather than increasing monotonically, are referred to as ‘convex’ (Anderson and May, 1985a,b). Eqn. 5 therefore gives a criterion for convexity of age-specific worm burdens in species 1. If the only difference between the 2 parasite species arises because of differences in the intra- and interspecific interaction terms (all parameters except the γ's are the same for both species) then Eqn. 5 becomes
11+
21>
22+
12. From the definition of the
ji (i, j=1, 2), this latter criterion for convexity can be given in terms of the original parameters as

A biological interpretation of this criterion is clear: if intra- and interspecific reductions in the rate of establishment acting on species 1 are greater than those acting on species 2, then species 1 will exhibit a convex age-intensity profile (Fig. 2A).

Fig. 2. Mean worm burden as a function of age (from Eqn. 4). In (A–C) intra- and interspecific interactions are antagonistic; 1 of the 2 species has a convex age-intensity profile when the parameter values for the 2 species are not the same. (A) Mean worm burden as a function of age peaks in species 1 and increases monotonically in species 2 due to differences in the intra and inter-specific terms. Parameter values: 1=2=1 month−1, μ1=μ2=1/72 month−1, 11=0·01, 22=0·03, 21=0·04, 12=0·001. (B) When all the interaction parameters are equal, then the species with the shorter life-expectancy (species 1) will exhibit the peak. Parameter values 1=2=1 month−1, μ1=1/24 month−1, μ2=1/120 month−1, 11=22=21=12=0·02. (C) The peak may be imperceptible so that both species appear to increase monotonically. Parameter values: 1=2=1 month−1, μ1=μ2=1/36 month−1, 22=12=21=0·01,11=0·005. (D) The interspecific terms have opposite signs and age-intensity curves for both species are convex. Parameter values: 1=2=1 month−1, μ1=μ2=1/72 month−1, 11=22=21=0·01, 12=−0·1.
From Eqn. 5 it is apparent that if species 1 has a shorter life-expectancy than species 2, then this will increase the likelihood that species 1 exhibits a convex infection-age-profile. In particular, if all interaction parameters are the same (γ11=γ21=γ22=γ12), the shorter lived species will peak while the longer-lived species reaches a plateau. This is illustrated in Fig. 2B where one species has a life-expectancy of 2 years, e.g. Trichuris trichiura (Anderson and May, 1991), and the other has a life-expectancy of 10 years, e.g. Onchocerca volvulus (Plaisier et al. 1991).
For species 2 to peak the condition (by symmetry) is,

Clearly, the mean worm burdens of either species 1 or species 2 must peak, but they cannot both do so. (Fig. 2A,B). Often, however, it appears as if neither species exhibits a peak intensity; this happens when the age at which the maximum (peak) occurs is large and therefore indistinguishable from the equilibrium (Fig. 2C).
These results only apply if intra- and interspecific interactions are antagonistic (all γ terms are positive). It is apparent from the solution of Eqn. 4 (Eqn. A-6 in Appendix A) that if one interspecific term is positive (antagonistic) and the other negative (synergistic), then the means for both species may oscillate before reaching equilibrium. In this case, the mean worm burdens of both species can ‘peak’ (Fig. 2D). This may be understood intuitively as follows: species 1 and species 2 increase initially; since species 2 is facilitated by species 1 the worm burden of species 2 grows rapidly; however, species 2 limits species 1 so that there is a decline in species 1, this decline subsequently reduces the degree of facilitation by species 2 which therefore also declines.
Dispersion and correlation.
As for the means (first moments), the second moments can be approximated using differential equations (see Appendix A). These can be used to obtain approximate equilibrium values for the variance and covariance, and therefore for the index of dispersion (variance[ratio ]mean ratio) and correlation.
The condition that both γ11>|γ12| and γ22>|γ21| (|ċ| denotes absolute value) guarantees the existence of equilibrium values for the approximations to the first two moments of L. Further, under this condition, it can be shown that the following are true for these approximations; the details are given in Appendix B. (1) Mutually antagonistic and mutually synergistic interactions increase the equilibrium variance[ratio ]mean ratio (VMR) for both species relative to the case where there is no interspecific interaction. (2) The equilibrium VMR for species i is always less than unity if the interaction is mutually synergistic. If it is mutually antagonistic, it seems that VMR is less than one when the intraspecific effect acting on species i is greater than the interspecific effect (γii>γji for i=1, 2 with i≠j). However, this has only been formally demonstrated for the symmetric case where the parameters are the same for both species. In the reverse situation, where the interspecific effect acting on species i is greater than the intraspecific effect, species i may be overdispersed at equilibrium. (3) Mutually antagonistic interactions result in negative equilibrium correlation between the species while mutually synergistic interactions produce a positive correlation.
It may seem curious that for much of the parameter space explored in the linear model the VMR is less than unity, when field studies have shown that for most species VMR>1. The reason for this is that we have not included in this model any of the factors known to generate overdispersion, such as host heterogeneity or clumping of infective stages. Host heterogeneity will be incorporated in model SRE, and the combined effect of host heterogeneity and interspecific interaction will be analysed there. We emphasize that these results have only been demonstrated for model L in those regions of parameter space where the condition γii>|γij| (i, j=1, 2; i≠j) holds. By imposing such a restriction we are excluding areas of parameter space that are relevant for a number of species, in particular those where the intraspecific term is synergistic, e.g. Heligmosomoides polygyrus (see also Christensen et al. 1987; Behnke et al. 2001 for other examples). Nonetheless, there are many pairs of species that meet the condition explored here. For example, Geiger et al. (1996) showed that in rodents there is both homologous and heterologous protection against establishment of the filarial species Acanthocheilonema viteae and Monanema martini. Furthermore, the effect that each of these species has on its own rate of establishment is greater than the effect it has on the heterologous species. Cross-protective effects have also been proposed to shape human onchocerciasis epidemiological patterns in areas of high Onchocerca ochengi transmission (Wahl et al. 1998).
Simulation results
The effect of interspecific interactions on dispersion and correlation have been investigated for model L for regions of parameter space where intraspecific terms are antagonistic and larger in magnitude than the interspecific terms, i.e. where γii>|γij| (i, j=1, 2; i≠j). We now present results from the simulation of model S (the stochastic version of the nonlinear model). These simulations focus on regions of parameter space that were not explored in model L. In particular, model S is used to investigate the effect on dispersion and correlation of synergistic intraspecific terms (γii<0) (i=1, 2), and interspecific terms that are larger in magnitude than the intraspecific terms (|γij|>|γii| (i, j=1, 2; i≠j)).
The conclusions drawn from the linear model regarding equilibrium correlation and VMR were only dependent on the signs and relative magnitudes of the intra- and interspecific effects. Similarly, we expect the qualitative behaviour of equilibrium correlation of VMRs of model S to be governed by the signs and relative magnitudes of the intra- and interspecific effects. Nonetheless we use parameter values for the simulations that are consistent with the life-cycles of a number of human and non-human helminth species; some examples are given in Table 2. For simplicity it is assumed that all parameters (demographic and interaction) are the same for both species.

We choose a helminth life-expectancy, μi, of 20 months and a maturation time, σi, of 1 month. The larval life-expectancy in the absence of immunity, ηi, is taken to be 1 month. This implies that 50% of larvae become established as adult worms

which is consistent with establishment in some experiments (Leathwick et al. 1999). The level of exposure (λi=5 larvae per month) was chosen to give worm burdens in the region of 0–100 (Hall and Holland, 2000). The γ's range between 0 and 0·1. That is to say, we allow each adult worm to increase or decrease the death rate of incoming larvae by an amount between 0 and 10%.
The findings are summarized in Table 3. For the simulations undertaken, equilibrium was reached after about 5 years (or roughly 2 parasite life-times). In general, it can be seen that the magnitude of the interspecific terms (γji) relative to the size of the intraspecific terms (γii) and the signs of intra- and interspecific terms are critical in determining the equilibrium index of dispersion and the sign of the equilibrium correlation.

Dispersion.
From the analysis of the linear model, it was shown that the equilibrium distribution is not overdispersed (VMR>1) when the interspecific effect acting on a species is smaller in magnitude than the intraspecific effect. In contrast, from the simulation of model S, overdispersion can occur if the relative magnitudes of the inter- and intraspecific terms are reversed so that interspecific terms are positive and larger in magnitude than the intraspecific terms. This is true both when γii>0 (Fig. 3A) and when γii<0 (Fig. 4A).

Fig. 3. Equilibrium dispersion index, and correlation as a function of age from 100000 realizations of model S, when the intraspecific terms are antagonistic (γii>0 i=1, 2). (A) Equilibrium dispersion index (VMR) for different strengths of interspecific interaction (γji). Both mutually antagonistic (γji>0) and synergistic (γji<0) interspecific interactions increase the equilibrium VMR (relative to the value for γji=0), but for mutually synergistic interactions the index of dispersion appears not to exceed unity. Mutually antagonistic interactions for which the interspecific terms are greater in magnitude than the intraspecific terms can yield highly overdispersed equilibrium distributions. (B) Correlation between species 1 and 2 as a function of host age. We explore values of the interspecific terms, γji (i, j=1, 2; j≠i), that range from absence of interspecific interaction (γji=0), to a strong mutually antagonistic effect (γji=0·10) or a strong mutually synergistic effect (γji=−0·10). γji=0·01 illustrates case (a) of Table 3; γji=0·06 and γji=0·1 case (c); γji=−0·01 case (b); γji=−0·06 and γji=−0·1 case (d). Mutually antagonistic interspecific interactions (γji>0) yield negative correlations and mutually synergistic interactions (γji<0) yield positive correlations, for all host ages. However, when the interspecific terms are negative and much larger than the intraspecific terms (|γji|[Gt ]γii), then the equilibrium correlation approaches zero for large values of host age but is positive and convex for small values. Parameter values are: λi=5 month−1, σi=1 month−1, μi=0·05 month−1, ηi=1 month−1, γii=0·01 i=1, 2.

Fig. 4. Equilibrium dispersion index and correlation as a function of age from 100000 realizations of model S, when the intraspecific effects are synergistic (γii<0 i=1, 2). (A) Equilibrium dispersion index (VMR) for varying γji. When γji<0, VMR≈1. When γji>0, increasing the size of the interspecific terms rapidly leads to overdispersion of parasites amongst the host population (VMR>1). (B) Correlation between the worm burdens of species 1 and 2 as a function of host age; γji=0·01 illustrates case (e) of Table 3; γji=0·06 case (g); γji=−0·01 case (f), and γji=−0·06 case (h). Parameter values: γii=−0·05 i=1, 2, others as in Fig. 3.
For the situation in which interspecific effects are much larger than intraspecific effects (γii[Gt ]|γii|), each species has a bimodal equilibrium distribution in which hosts have either no (or very few) worms or very many (Fig. 5). The joint distribution of the two species reveals that under these conditions those hosts with no (or very few) worms of one species tend to have a large number of worms of the other species. The bimodal marginal distribution of each species can be interpreted in light of this: hosts tend to have either a high or a very low worm burden of one species at equilibrium, depending on the abundance of the other species.

Fig. 5. The joint equilibrium distribution (A) and single species distributions (B) of species 1 and species 2 worm burdens (100000 realizations of model S) for a mutually antagonistic interaction in which the interspecific effects are much stronger than the antagonistic intraspecific effects (γji[Gt ]γii>0). Hosts tend to have a large worm burden for one species and a very small or zero worm burden for the other species. Parameter values: λi=5 month−1, σi=ηi=1 month−1, μi=0·05 month−1, γii=0·01, γji=0·1, i=1, 2; j≠i.
When interactions are mutually synergistic they have less impact on dispersion than they do when they are mutually antagonistic. From Figs 3A and 4A, it appears that the index of dispersion is bounded by one, no matter how large a mutually synergistic interaction becomes and irrespective of whether each species regulates (γii>0) or enhances (γii<0) itself.
Correlation.
In keeping with the results of the linearized model, in all age classes mutually antagonistic interspecific terms yield negative correlations (cases (a) and (c) in Table 3), and mutually synergistic interspecific interactions yield positive correlations (Fig. 3B). However, for mutually synergistic interactions that are large in magnitude relative to the intraspecific terms (γji<0, |γji|[Gt ]γii>0) the correlation peaks in the younger age classes, and then approaches zero at equilibrium.
Although this is an interesting result, it seems unlikely that a helminth species would operate to decrease its own rate of establishment (γii>0) whilst facilitating the establishment of the larvae of another species (γji<0). It is more plausible that a helminth species facilitates the establishment of larvae of its own species and as a byproduct also enhances the establishment of another species. This situation (γii<0) is explored in Fig. 4B where it is apparent that the equilibrium correlation is close to zero for both small and large mutually synergistic interactions. Interestingly, the equilibrium correlation is also close to zero for small mutually antagonistic interactions (0<γji<|γii|).
These results suggest that inspection of the equilibrium correlation is not a good predictor for the existence of an interaction between helminth species when adult worms of each species facilitate the establishment of their own species. Furthermore, even when intraspecific interactions are antagonistic, the equilibrium correlation may still be zero for a mutually synergistic interaction if the interspecific terms are greater in magnitude than the intraspecific terms.
Incorporating heterogeneity
Model S can be modified by treating the rates of exposure as a pair of correlated random variables (Λ1, Λ2); this model will be referred to as SRE (where RE stands for random exposure). This adds biological realism because (1) there is heterogeneity among hosts in their exposures/susceptibility to the infective stages which can be modelled by the variability of Λ1 and Λ2; (2) pairs of helminth species with similar biologies often share similar routes of transmission implying a positive correlation between the rates of exposure (e.g. soil-transmitted helminths such as Ascaris and Trichuris) and (3) susceptibility to one species may be linked with susceptibility to many species through, for example, genetic predisposition (Quinnell, 2003). Although Λ1, Λ2 will be referred to as ‘exposure’ random variables, they may incorporate heterogeneity and correlation due to susceptibility because, for the purposes of this model, exposure and susceptibility are essentially indistinguishable.
The random exposure model, SRE, is analysed by simulation. For each realization, the rates of exposure (λ1, λ2) are sampled from a bivariate normal distribution, truncated so that λ1>0, λ2>0. We use the bivariate normal distribution because it provides a straightforward way of introducing correlation between the exposure rates (one of the parameters of the bivariate normal is the correlation coefficient); while truncation is necessary to ensure non-negative exposure rates. The normal distribution is parameterized to have mean vector (ζ1, ζ2) and covariance matrix

where νi2 (i=1, 2) is the variance in exposure for species i and ρ is the correlation between exposures for the two worm species. In practice, the truncation is achieved by sampling from the full bivariate normal distribution and excluding samples where either λ1<0 or λ2<0. Here we present results from simulations where ζi=5, νi=2, ρ=0·5; i=1, 2. The means, standard deviations and correlation of Λ1 and Λ2 can be computed by numerical integration. For the parameter values used, they are 5·049, 1·949 and 0·485 respectively.
Dispersion.
The effects of both mutually antagonistic and synergistic interspecific interactions on the equilibrium index of dispersion differ qualitatively in models S (homogeneous exposure) and SRE (random exposure). For mutually antagonistic interactions, the equilibrium VMR in model SRE is crucially dependent on the size of the interaction. When the interspecific interaction is small (0<γji[Lt ]γii), the equilibrium VMR is smaller than it would be in the absence of interaction, while for large mutually antagonistic interspecific interactions (γji[Gt ]γii>0), it is substantially greater (Fig. 6A). This is in marked contrast to the results of model S described earlier, where mutually antagonistic interactions increase the equilibrium index of dispersion (as compared with the no interaction case) irrespective of their magnitude (Fig. 3A).

Fig. 6. Index of dispersion at equilibrium and correlation as a function of age from 100000 realizations of model SRE, where exposure to species 1 (Λ1) and exposure to species 2 (Λ2) are positively correlated random variables. (A) Mutually synergistic interspecific interactions increase the index of dispersion at equilibrium relative to γji=0 and can cause overdispersion (compare with Fig. 3A). Large mutually antagonistic interactions (γji[Gt ]γii) cause overdispersion at equilibrium, whereas smaller ones reduce the VMR relative to that for γjj=0. (B) Since host exposures to the 2 species are positively correlated, mutually antagonistic interspecific interactions (γji>0) do not necessarily result in negative correlation between worm burdens. However, for small mutually antagonistic interactions (γji=0·01) there is a decline in correlation with increasing age which is not observed in the absence of interaction (γji=0). The distribution of (Λ1, Λ2) has parameter values: ζi=5, νi=2, ρ=0·5; i=1, 2. All other parameters are as in Fig. 3.
In the homogeneous exposure model, S, mutually synergistic interactions increase the equilibrium index of dispersion when, in the absence of interaction, the distribution is underdispersed, but appear not to be able to induce overdispersion. However, in the random exposure model, SRE, mutually synergistic interactions can greatly increase the extent to which equilibrium worm burdens are overdispersed.
Correlation.
If exposures to the 2 helminth species are positively correlated, worm burdens will also tend to be positively correlated. In Fig. 6B it can be seen that for small mutually antagonistic interactions the correlation between exposures dominates and the equilibrium worm burdens are positively correlated, but when the interactions are large the correlation between exposures is countered by the strong interaction and the equilibrium correlation becomes negative.
Averaging across age classes
The results for the models presented have assumed knowledge of host age. That is to say, they describe the joint distribution of the 2 worm species for a given age. In contrast, in field studies of non-human parasites, host age is not usually determined; the distribution that is sampled and described is therefore averaged across all age groups in the population. Here we briefly discuss the effect that this has on the index of dispersion and correlation.
Consider model S in the absence of inter- and intraspecific effects. The worm burdens X1a and X2a for the two species at age a are then independent Poisson variables with means
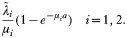
The mean worm burden across all ages can be computed by weighting the mean worm burden at age a by the probability of a host being in age class (a, a+δ) and summing over all age classes. For simplicity it is assumed that the distribution of ages in the host population is exponential with parameter μH; then the mean worm burden of species i in the population of hosts is

The variance in species i worm burden for the population of hosts is the sum of two components: the average variance within age classes and the variance of the mean between age classes. Specifically it is

where the first term corresponds to the ‘within’ component and the second to the ‘between’ component. From Eqn. 8 and Eqn. 9 it is apparent that the variance[ratio ]mean ratio (VMR) is greater than unity. The covariance between the two species can similarly be decomposed into the weighted sum of the average covariance within age classes and the covariance of the mean worm burdens between age classes. For a given host age, the worm burdens of species 1 and species 2 are independent, thus within age classes the covariance is zero; between age classes it is given by
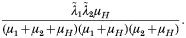
The worm species will therefore be positively correlated when the host population is not stratified by age even in the absence of interaction. Furthermore, this positive correlation can be large. For example, using the parameter values of Fig. 3 (

i=2·5 month−1, μi=1/20 month−1; i=1, 2) and setting μH=1/48 month−1, gives a correlation of 0·86 (from Eqn. 9 and Eqn. 10).
DISCUSSION
The models presented in this paper describe the process by which 2 interacting helminth species are acquired and lost in an ageing host. We have used these models to explore the effects of interspecific interactions on the means and variance[ratio ]mean ratios (VMR's) of each species, and the correlation between parasite species at different host ages. A number of the results are for equilibrium values of these quantities. These results refer to hosts that are beyond a certain age (approximately 5 years for the parameters we have used) where the distribution of worm burden is effectively constant. In the following, we discuss the likelihood that observed epidemiological patterns have been generated by interspecific interactions, as well as some of the difficulties associated with making such inferences.
While there is often a lack of age-specific data on the distribution of worm burdens in non-human hosts, in humans such age-specific data are frequently available. A common feature of these data is that the mean worm burden peaks and then drops to a lower equilibrium value (e.g. schistosome parasites in humans). Patterns of mean worm burden that exhibit this feature are said to be ‘convex’ (note that the meaning of convex here is opposite to its definition in mathematics). Based on mathematical models (Anderson and May, 1985b; Woolhouse, 1992a; Woolhouse et al. 1994) 2 explanations for this phenomenon have been proposed (1) host exposure or susceptibility decreases with age and, (2) hosts build up protective acquired-immunity to the helminths. Whilst these proposals are undoubtedly the most likely explanations for ‘convex’ age-intensity patterns, it is tempting to speculate that in some situations convexity may be the result of mutually antagonistic interactions between 2 species. The analysis of model L demonstrated that a mutually antagonistic interaction must always result in 1 of the 2 species having a convex age-intensity pattern. However, 2 features (both illustrated in Fig. 2) of the age-intensity pattern of L suggest that such an interpretation of an observed age-intensity profile should be employed with caution. First, even though in theory 1 of the 2 species must have a convex age-intensity profile when there is a mutually antagonistic interspecific interaction, the degree of convexity may be negligible and therefore practically irrelevant. Secondly, it would appear that often the peak worm burden occurs at younger ages in model L than is observed in data sets of human helminth infection (Anderson and May, 1985a).
Aggregation is a key feature of virtually all parasitic helminth distributions. In this paper we follow the example of Isham (1995), Fulford et al. (1992) and others and define it in terms of the VMR (aggregation⇒VMR>1). When the variance is greater than the mean, the distribution is said to be overdispersed relative to the Poisson distribution; when it is less than the mean it is underdispersed. Mathematical models have been used to investigate the effects of various processes on the VMR, e.g. parasite-induced host mortality (Herbert and Isham, 2000); clumping of infective stages (Isham, 1995); heterogeneity in host susceptibility (Tallis and Leyton, 1969), and host immunity (Anderson and Gordon, 1982; Pacala and Dobson, 1988). To our knowledge, the impact of interspecific interactions on dispersion has not been examined. In fact it is an implicit assumption in most ecological models of competition between helminth species that interspecific interactions have no effect on the level of aggregation (Dobson, 1985; Roberts and Dobson, 1995; Gatto and De Leo, 1998). We find that mutually antagonistic interactions can give rise to an aggregated equilibrium distribution (VMR>1) when the interspecific effect acting on a species is greater than the intraspecific effect. When there is symmetry so that the two species have the same interaction parameter values, both species are aggregated because hosts are infected with large amounts of one or other of the species, but not both. Therefore, when each species is considered individually, the distribution is aggregated because individuals have either a very high or very low worm burden of the species in question. Such distributions are likely to be rare since both interspecific terms must be much larger than the intraspecific terms. Nonetheless, occasionaly such distributions have been identified and interspecific interaction suggested as an explanation. For example, Kennedy (1975) tentatively explained the observation that Haematoloechus sp. and Rhabdias bufonis seldom occur together in lungs of frogs in this way. A more plausible scenario for the generation of aggregation by interspecific interaction is that one species, species 1 say, has both a large interspecific effect as well as intraspecific effect, while the species it interacts with, species 2, has smaller intra- and interspecific effects. If the difference is sufficiently large then species 1 will cause the equilibrium distribution of species 2 to be overdispersed.
When interspecific terms are smaller in magnitude than the intraspecific terms, the effect of a mutually antagonistic interaction on the equilibrium VMR depends on the degree of heterogeneity in host exposure. In the absence of heterogeneity, the interaction causes an increase in equilibrium VMR relative to no interaction. When there is heterogeneity, depending on the size of interspecific terms, there may be a reduction in the equilibrium VMR. This is of interest because it demonstrates that while it is often useful to explore different factors independently and assume that they combine linearly to determine the degree of aggregation (Anderson and Gordon, 1982), on occasion factors may combine in a nonlinear way. A similar phenomenon has been shown to occur with parasite-induced host mortality (Herbert and Isham, 2000): when there is heterogeneity in host exposure/susceptibility, parasite-induced host mortality will reduce the VMR, but in the absence of this heterogeneity it has no effect.
In the absence of extraneous factors, the correlations at equilibrium between species associated with different types of interaction are in agreement with intuition. Mutually antagonistic interactions yield negative correlations; mutually synergistic interactions yield positive correlations, and when there is a mixed interaction (one interspecific term positive, the other negative) then the correlation can be positive or negative. Therefore, if the correlation at equilibrium between 2 species is negative this implies that at least one of the interspecific terms is positive (antagonistic), and conversely if it is positive then one term must be negative (synergistic). This intuition has been used to identify potential interactions between species from matrices of correlations for data on intensity of infection (Hayward, Perera and Rohde, 1998; Byrne et al. 2003) or contingency tables for presence/absence data (Kuris and Lafferty, 1994; Jackson, Tinsley and Hinkel, 1998). We discuss some of the difficulties of inferring the existence of interactions in light of the current models.
In the section of Averaging across age classes it is shown that in the absence of interaction and correlation between exposures, the species will be positively correlated if correlation is measured in the population of hosts as a whole, i.e. across all age classes. Indeed this correlation may be very strong. Intuitively, the reason for this is that young hosts tend to have fewer worms of both species than older hosts. Unfortunately, most studies of helminth communities in non-human hosts are not age-specific. It is therefore not surprising that in many of these studies there is an excess of positive associations between species (Bush and Holmes, 1986; Lotz and Font, 1994; Hayward et al. 1998). Recently, a number of studies have controlled for the effects of age statistically by fitting regression models that include age and then examining the correlation between species in the residuals from these models (Tchuem Tchuenté et al. 2003; Behnke et al. 2005; Faulkner et al. 2005). It is interesting that an analogous situation has been addressed in the context of immunity to a single parasite species. Here, sampling across age groups similarly leads to positive associations between antibodies such as IgG and IgA and worm burden. This suggests that antibody-mediated immunity is ineffective at reducing worm burdens. However, these positive correlations are weakened or reversed after controlling for age (Woolhouse, 1992b).
An important feature of strong synergistic intra- and interspecific effects is that they frequently lead to an equilibrium correlation between species that approaches zero. Beyond a certain degree of strength, mutually synergistic interactions produce a zero equilibrium correlation between the 2 species. This is not true of mutually antagonistic interactions. However, if the intraspecific terms act synergistically then a weak mutually antagonistic interaction may be hidden by a zero correlation. These effects occur because the rate at which worms become established has an upper bound. If either intra- or interspecific effects are sufficiently synergistic so that the worm burden for each species and thus the rates of establishment are maintained at an ‘upper limit’, then the rate of establishment for each species is effectively independent of worm numbers producing a zero correlation between species. This phenomenon will make it difficult to detect interactions in older age groups. In ecological studies, it is therefore important to sample the young hosts. Mutually synergistic interactions, for example, will be manifest in younger age classes as a positive correlation between species even though the correlation may disappear in older age classes.
The identification of interspecific interactions is complicated by heterogeneity in host exposure (or susceptibility) if there is correlation between the exposure rates for the 2 species as in model SRE (Kuris and Lafferty, 1994). This heterogeneity may be due to (1) differences between hosts due to factors such as host sex (Wilson et al. 2002; Behnke et al. 2005), host genetics (Quinnell, 2003) and host behaviour (Wong, Bundy and Golden, 1988), (2) the spatial distribution of infective stages and (3) the distribution of infective stages amongst any intermediate hosts. To a certain extent, these complexities can be eliminated; either by controlling statistically for the effect of area, sex, etc. (Haukisalmi and Henttonen, 1998; Behnke et al. 2005), or by sampling appropriately. On other occasions, stratification alone will not deal with the problem, as in the case when two helminth species share an intermediate host. In this situation, it might be worthwhile exploring how correlation changes with host age. Model SRE suggests that there is often a decline in correlation in older age groups for a mutually antagonistic interaction; such a decline does not occur when there is no interaction.
The models analysed in this paper have been restricted to 2 interacting species. In reality, many species of parasite may occupy a single host. Under these circumstances, the interpretation of correlations between species becomes even more complicated because interspecific interactions can cause associations between species that do not interact (Moore and Simberloff, 1990; Haukisalmi and Henttonen, 1998). For example, a mutually antagonistic interaction between species 1 and species 2; and between species 2 and species 3 will result in a positive correlation between species 1 and species 3 in the absence of any interaction between these latter species. Species 2 is in effect a ‘confounding factor’ of the relationship between species 1 and species 3. One way of dealing with this is to use partial correlations (Kleinbaum et al. 1998); this provides the correlation between species 1 and species 3 having controlled for species 2. Such an approach has been used by Thomas (1964) to explore associations between helminth species in brown trout. However, it assumes that the joint distribution of the numbers of each parasite species is multivariate normal, which may often not be a reasonable assumption to make.
There has been a continued debate over the extent to which the joint distribution of parasite species found within a population of hosts is shaped by interspecific interaction (Kennedy, 1975; Price, 1980; Simberloff, 1990; Poulin, 1998). Yet, surprisingly, there has been no theoretical investigation of the possible effects of interactions on the joint distribution; rather investigators have relied heavily on intuition. This paper has tried to put some of this intuition into a more formal context. We have shown that interspecific interactions can produce convex age intensity profiles, and will impact the degree to which species are aggregated. We highlight the importance of obtaining age-specific data, and demonstrate that it may be difficult to identify interspecific interactions from data on older hosts.
The authors would like to thank both anonymous referees for constructive comments. They are grateful to Dr M. Booth and Professor J. M. Behnke for valuable discussions and contributions to the Introduction and Discussion. C.B. and M.G.B. acknowledge financial support from the MRC through, respectively, a research studentship and a career establishment grant.
APPENDIX A
Let the random variable X1a and X2a represent, respectively, the numbers of worms of species 1 and species 2 in a host of age a. We define a linear model (L) in which the transition rates are:
(X1a, X2a)→(X1a+1, X2a) at rate

1(X1a, X2a)

and (X1a, X2a)→(X1a−1, X2a) at rate d1(X19, X29) μ1X1a. The rates of species 2 d1(X19, X29) (X1a, X2a)→(X1a, X2a+1) and (X1a, X2a)→(X1a, X2a−1) are similarly defined.
Assuming that the probability

for all a (i=1, 2; j≠i), we derive a set of differential equations to approximate the first two moments of model L as follows:
After a small time period δ the expected number of worms of species 1, given X1a and X2a is

By taking the expected value of both sides, the unconditional mean is obtained,

Subtracting E[X1a] from both sides, dividing by δ and taking the limit δ→0 gives the differential equation

where pa(x1, x2)=P(X1a=x1, X2a=x2),

and the summation for Σ1 is over the set

.
Similarly,

where Σ2 is equivalently defined. Therefore if pa(x1, x2) is negligible in the sets over which the summation in Σ1 and Σ2 takes place, then E[X1a] and E[X2a] can be approximated by the solution to the set of differential equations obtained by setting Σ1=0 in Eqn. A-1 and Σ2=0 in Eqn. A-2.
Under the same assumptions, and given E[X1a] and E[X2a], the derivatives of the second moments are approximated by the following set of differential equations


Assuming that at age a=0 the worm burden for each species is zero (X1a=X2a=0), the solution to Eqn. A-1 and Eqn. A-2 is as follows:

where the asterisk indicates equilibrium and

The accuracy of the approximation to the moments of model L
The approximation is known to be good if

(i=1, 2; j≠i) for all host ages, a. Unfortunately, the parameter values under which this probability is small are unknown; some insight can nonetheless be obtained by examining the parameter values for which the condition holds according to the approximation. Clearly, this is a necessary condition for the approximation to hold: if

, and the approximation is good, then this probability must also be small according to the approximation. Therefore for a satisfactory approximation, it is necessary that equilibrium values exist, i.e. γii[ges ]|γij| (i=1, 2; j≠i), and that

. In practice, it seems that the solution to the differential equations A-1 to A-5 approximate the moments of model L well when

(Fig. A1).

Fig. A1. Means, variances and correlations obtained through (A) simulation of model L (100000 realizations) and (B) using the set of differential equations that approximate the moments of L. Parameter values as in Fig. 2B.
APPENDIX B
In the following, it is assumed that γ11[ges ]|γ12| and γ22[ges ]|γ21|. These conditions are sufficient to guarantee the existence of a stable equilibrium for Eqns. A-1 to A-5 of Appendix A. From these equations it is possible to derive an approximate expression for the equilibrium covariance,

where

It is apparent from Eqn. B-1 that the covariance between the 2 species is negative if

and

are both positive, and positive if they are both negative. Thus mutually antagonistic interactions induce a negative equilibrium correlation between helminth species whereas mutually synergistic interactions induce a positive equilibrium correlation.
Using this result it can easily be shown that both mutually antagonistic and mutually synergistic interactions increase the equilibrium VMR relative to the case where there are no interspecific interactions. From Eqn. A-3 of Appendix A, the equilibrium VMR of species 1 can be written as

In the absence of interaction Eqn. B-2 simplifies to

. Therefore an interspecific interaction will increase the VMR if the following condition is met

This condition may be re-expressed as

From Eqn. A-1 it can be seen that λ1−β1E[X1]*−λ1γ21E[X2]*=0, therefore an interspecific interaction increases the VMR if

This condition is satisfied when the interspecific interaction is mutually antagonistic or mutually synergistic.
We now derive a condition for overdispersion in species 1. The equilibrium VMR for species 1 is greater than 1 if Var[X1]*>E[X1]*. This can be written in terms of the equilibrium values of the first two moments

or, in terms of Cov[X1, X2]*,

Since

at equilibrium, Eqn. B-5 becomes

Substituting in the equilibrium values for E[X1]* and Cov[X1, X2]* gives the following condition

It is immediately apparent that Eqn. B-7 is not satisfied when

and

. Thus the equilibrium variance[ratio ]mean ratio is not greater than unity for mutually synergistic interspecific interactions. By contrast the distribution may be overdispersed when the interspecific terms are positive. This can be seen, for example, by setting

, which implies

since it is assumed that

.
However, it seems that equilibrium overdispersion is not possible when the interspecific effect acting on a species is smaller than the intraspecific effect

. This is demonstrated for the symmetric case (parameters for the 2 species are identical). Under these assumptions, Eqn. B-7 can be written as

Eqn. B-8 does not hold when 0[les ]
21[les ]
11. Thus VMR[les ]1 for a symmetric mutually antagonistic interactions when
21[les ]
11.
References
REFERENCES
Anderson, R. M. and
Gordon, D. M. (
1982).
Processes influencing the distribution of parasite numbers within host populations with special emphasis on parasite-induced host mortalities.
Parasitology
85,
373–398.CrossRefGoogle Scholar
Anderson, R. M. and
May, R. M. (
1985 a).
Helminth infections of humans: mathematical models, population dynamics, and control.
Advances in Parasitology
24,
1–101.Google Scholar
Anderson, R. M. and
May, R. M. (
1985 b).
Herd immunity to helminth infection and implications for parasite control.
Nature
315,
493–496.Google Scholar
Anderson, R. M. and
May, R. M. (
1991).
Infectious Diseases of Humans: Dynamics and Control.
Oxford University Press,
Oxford.
Behnke, J. M.,
Bajer, A.,
Sinski, E. and
Wakelin, D. (
2001).
Interactions involving intestinal nematodes of rodents: experimental and field studies.
Parasitology
122 (Suppl.),
S39–S49.CrossRefGoogle Scholar
Behnke, J. M.,
Gilbert, F.,
Abu-Madi, M. and
Lewis, J. (
2005).
Do helminth parasites of wood mice interact?
Journal of Animal Ecology (in the Press).Google Scholar
Booth, M.,
Vennervald, B. J.,
Butterworth, A. E.,
Kariuki, H. C.,
Amaganga, C.,
Kimani, G.,
Mwatha, J. K.,
Otedo, A.,
Ouma, J. H. and
Dunne, D. W. (
2004 a).
Exposure to malaria affects the regression of hepatosplenomegaly after treatment for Schistosoma mansoni infection in Kenyan children.
BMC Medicine
2,
36.Google Scholar
Booth, M.,
Vennervald, B. J.,
Kenty, L.,
Butterworth, A. E.,
Kariuki, H. C.,
Kadzo, H.,
Ireri, E.,
Amaganga, C.,
Kimani, G.,
Mwatha, J. K.,
Otedo, A.,
Ouma, J. H.,
Muchiri, E. and
Dunne, D. W. (
2004 b).
Micro-geographical variation in exposure to Schistosoma mansoni and malaria, and exacerbation of splenomegaly in Kenyan school-aged children.
BMC Infectious Diseases
4,
13.Google Scholar
Bundy, D.,
Sher, A. and
Michael, E. (
2000).
Good worms or bad worms: do worm infections affect the epidemiological patterns of other diseases?
Parasitology Today
16,
273–274.Google Scholar
Bush, A. O. and
Holmes, J. C. (
1986).
Intestinal helminths of lesser scaup ducks: patterns of association.
Canadian Journal of Zoology
64,
132–141.CrossRefGoogle Scholar
Byrne, C. J.,
Holland, C. V.,
Kennedy, C. R. and
Poole, W. R. (
2003).
Interspecific interactions between acanthocephala in the intestine of brown trout: are they more frequent in Ireland?
Parasitology
127,
399–409.Google Scholar
Christensen, N. O.,
Nansen, P.,
Fagbemi, B. O. and
Monrad, J. (
1987).
Heterologous antagonistic and synergistic interactions between helminths and between helminths and protozoans in concurrent experimental infection of mammalian hosts.
Parasitology Research
73,
387–410.CrossRefGoogle Scholar
Cox, F. E. G. (
2001).
Concomitant infections, parasites and immune responses.
Parasitology
122 (Suppl.),
S23–S38.CrossRefGoogle Scholar
Dobson, A. P. (
1985).
The population dynamics of competition between parasites.
Parasitology
91,
317–347.CrossRefGoogle Scholar
Duerr, H. P.,
Dietz, K. and
Eichner, M. (
2003).
On the interpretation of age-intensity profiles and dispersion patterns in parasitological surveys.
Parasitology
126,
87–101.CrossRefGoogle Scholar
Esch, G. and
Fernandez, J. (
1993).
A Functional Biology of Parasitism: Ecological and Evolutionary Implications.
Chapman and Hall,
London.CrossRef
Faulkner, H.,
Turner, J.,
Behnke, J.,
Kamgno, J.,
Rowlinson, M.-C.,
Bradley, J. and
Boussinesq, M. (
2005).
Associations between filarial and gastrointestinal nematodes.
Transactions of the Royal Society of Tropical Medicine and Hygiene
99,
301–312.CrossRefGoogle Scholar
Fenwick, A.,
Savioli, L.,
Engels, D.,
Bergquist, N. R. and
Todd, M. H. (
2003).
Drugs for the control of parasitic diseases: current status and development in schistosomiasis.
Trends in Parasitology
19,
509–515.CrossRefGoogle Scholar
Fulford, A. J.,
Butterworth, A. E.,
Sturrock, R. F. and
Ouma, J. H. (
1992).
On the use of age-intensity data to detect immunity to parasitic infections, with special reference of Schistosoma mansoni in Kenya.
Parasitology
105,
219–227.CrossRefGoogle Scholar
Gatto, M. and
De Leo, G. A. (
1998).
Interspecific competition among macroparasites in a density-dependent host population.
Journal of Mathematical Biology
37,
467–490.CrossRefGoogle Scholar
Geiger, S.,
Hoffmann, W.,
Rapp, J.,
Schulz-Key, H. and
Eisenbeiss, W. (
1996).
Filariidae: cross-protection in filarial infections.
Experimental Parasitology
83,
352–356.CrossRefGoogle Scholar
Gems, D. (
2000).
Longevity and ageing in parasitic and free-living nematodes.
Biogerontology
1,
289–307.CrossRefGoogle Scholar
Hall, A. and
Holland, C. (
2000).
Geographical variation in Ascaris lumbricoides fecundity and its implications for helminth control.
Parasitology Today
16,
540–544.CrossRefGoogle Scholar
Harms, G. and
Feldmeier, H. (
2002).
HIV infection and tropical diseases-deleterious interactions in both directions?
Tropical Medicine and International Health
7,
479–488.Google Scholar
Haukisalmi, V. and
Henttonen, H. (
1998).
Analyzing interspecific associations in parasites: alternative methods and effects of sampling heterogeneity.
Oecologia
116,
565–574.CrossRefGoogle Scholar
Hayward, C. J.,
Perera, K. M. and
Rohde, K. (
1998).
Assemblages of ectoparasites of a pelagic fish, slimy mackerel (Scomber australasicus), from south-eastern Australia.
International Journal for Parasitology
28,
263–273.CrossRefGoogle Scholar
Herbert, J. and
Isham, V. (
2000).
Stochastic host-parasite interaction models.
Journal of Mathematical Biology
40,
343–371.CrossRefGoogle Scholar
Isham, V. (
1995).
Stochastic models of host-macroparasite interaction.
The Annals of Applied Probability
5,
720–740.CrossRefGoogle Scholar
Jackson, J. A.,
Tinsley, R. C. and
Hinkel, H. H. (
1998).
Mutual exclusion of congeneric monogenean species in a space-limited habitat.
Parasitology
117,
563–569.CrossRefGoogle Scholar
Kennedy, C. (
1975).
Ecological Animal Parasitology.
Blackwell Scientific Publications,
Oxford.
Kleinbaum, D. G.,
Kupper, L. L.,
Muller, K. E. and
Nizam, A. (
1998).
Applied Regression Analysis and other Multivariable Methods, 3rd Edn.
Duxbury Press,
Pacific Grove,
USA.
Kuris, A. M. and
Lafferty, K. D. (
1994).
Community structure: larval trematodes in snail hosts.
Annual Review of Ecology and Systematics
25,
189–217.CrossRefGoogle Scholar
Leathwick, D.,
Miller, C.,
Brown, A. and
Sutherland, I. (
1999).
The establishment rate of Ostertagia circumcincta and Trichostrongylus colubriformis in lactating Romney ewes.
International Journal for Parasitology
29,
315–320.CrossRefGoogle Scholar
Lello, J.,
Boag, B.,
Fenton, A.,
Stevenson, I. R. and
Hudson, P. J. (
2004).
Competition and mutualism among the gut helminths of a mammalian host.
Nature
428,
840–844.CrossRefGoogle Scholar
Lotz, J. M. and
Font, W. F. (
1994).
Excess positive associations in communities of intestinal helminths of bats: a refined null hypothesis and a test of the facilitation hypothesis.
Journal of Parasitology
80,
398–413.CrossRefGoogle Scholar
Mariotti, S. P.,
Pararajasegaram, R. and
Resnikoff, S. (
2003).
Trachoma: looking forward to global elimination of trachoma by 2020 (GET 2020).
American Journal of Tropical Medicine and Hygiene
69,
33–35.CrossRefGoogle Scholar
Molyneux, D. H. and
Zagaria, N. (
2002).
Lymphatic filariasis elimination: progress in global programme development.
Annals of Tropical Medicine and Parasitology
96 (Suppl. 2),
S15–S40.CrossRefGoogle Scholar
Moore, J. and
Simberloff, D. (
1990).
Gastrointestinal helminth communities of bobwhite quail.
Ecology
71,
344–359.CrossRefGoogle Scholar
Nacher, M. (
2001).
Malaria vaccine trials in a wormy world.
Trends in Parasitology
17,
563–565.CrossRefGoogle Scholar
Nacher, M.,
Gay, F.,
Singhasivanon, P.,
Krudsood, S.,
Treeprasertsuk, S.,
Mazier, D.,
Vouldoukis, I. and
Looareesuwan, S. (
2000).
Ascaris lumbricoides infection is associated with protection from cerebral malaria.
Parasite Immunology
22,
107–113.CrossRefGoogle Scholar
Pacala, S. W. and
Dobson, A. P. (
1988).
The relation between the number of parasites/host and host age: population dynamic causes and maximum likelihood estimation.
Parasitology
96,
197–210.CrossRefGoogle Scholar
Petney, T. N. and
Ross, A. H. (
1998).
Multiparasite communities in animals and humans: frequency, structure and pathogenic significance.
International Journal for Parasitology
28,
377–393.CrossRefGoogle Scholar
Plaisier, A. P.,
van Oortmarssen, G. J.,
Remme, J. and
Habbema, J. D. (
1991).
The reproductive lifespan of Onchocerca volvulus in West African savanna.
Acta Tropica
48,
271–284.CrossRefGoogle Scholar
Poulin, R. (
1998).
Evolutionary Ecology of Parasites.
Chapman and Hall,
London.
Price, P. W. (
1980).
Evolutionary Biology of Parasites.
Princeton University Press,
Princeton.
Quinnell, R. J. (
2003).
Genetics of susceptibility to human helminth infection.
International Journal of Parasitology
33,
1219–1231.CrossRefGoogle Scholar
Remme, J. H. F.,
Binka, F. and
Nabarro, D. (
2001).
Toward a framework and indicators for monitoring roll back malaria.
American Journal of Tropical Medicine and Hygiene
64,
76–84.CrossRefGoogle Scholar
Roberts, M. G. and
Dobson, A. P. (
1995).
The population dynamics of communities of parasitic helminths.
Mathematical Biosciences
126,
191–214.CrossRefGoogle Scholar
Sékétéli, A.,
Adeoye, G.,
Eyamba, A.,
Nnoruka, E.,
Drameh, P.,
Amazigo, U. V.,
Noma, M.,
Agboton, F.,
Aholou, Y.,
Kale, O. O. and
Dadzie, K. Y. (
2002).
The achievements and challenges of the African Programme for Onchocerciasis Control (APOC).
Annals of Tropical Medicine and Parasitology
96 (Suppl. 1),
S15–S28.CrossRefGoogle Scholar
Sharma, D. K.,
Chauhan, P. P. and
Agrawal, R. D. (
2000).
Interaction between Trypanosoma evansi and Haemonchus contortus infection in goats.
Veterinary Parasitology
92,
261–267.CrossRefGoogle Scholar
Simberloff, D. (
1990).
Free-living communities and alimentary tract helminths: hypotheses and pattern analyses. In
Parasite Communities: Patterns and Processes
(ed. Esch, G. W., Bush, A. O. and Aho, J. M.), pp.
289–319.
Chapman and Hall,
London.CrossRef
Tallis, G. M. and
Leyton, M. (
1966).
A stochastic approach to the study of parasite populations.
Journal of Theoretical Biology
13,
251–260.CrossRefGoogle Scholar
Tallis, G. M. and
Leyton, M. (
1969).
Stochastic models of populations of helminthic parasites in the definitive host. I.
Mathematical Biosciences
4,
39–48.CrossRefGoogle Scholar
Tchuem Tchuenté, L. A.,
Behnke, J. M.,
Gilbert, F. S.,
Southgate, V. R. and
Vercruysse, J. (
2003).
Polyparasitism with Schistosoma haematobium and soil-transmitted helminth infections among school children in Loum, Cameroon.
Tropical Medicine and International Health
8,
975–986.CrossRefGoogle Scholar
Thomas, J. D. (
1964).
Studies on populations of helminth parasites in brown trout (Salmo trutta L.).
Journal of Animal Ecology
33,
83–95.CrossRefGoogle Scholar
Wahl, G.,
Enyong, P.,
Ngosso, A.,
Schibel, J. M.,
Moyou, R.,
Tubbesing, H.,
Ekale, D. and
Renz, A. (
1998).
Onchocerca ochengi: epidemiological evidence of cross-protection against Onchocerca volvulus in man.
Parasitology
116,
349–362.CrossRefGoogle Scholar
Wilson, K.,
Bjørnstad, O. N.,
Dobson, A. P.,
Merler, S.,
Poglayen, G.,
Randolph, S. E.,
Read, A. F. and
Skorping, A. (
2002).
Heterogeneities in macroparasite infections: patterns and processes. In
Ecology of Wildlife Diseases
(ed. Hudson, P. J., Rizzoli, A., Grenfell, B. T., Heesterbeek, H. and Dobson, A. P.), chapter 2.
Oxford University Press,
Oxford.
Wong, M. S.,
Bundy, D. A. and
Golden, M. H. (
1988).
Quantitative assessment of geophagus behaviour as a potential source of exposure to geohelminth infection.
Transactions of the Royal Society of Tropical Medicine and Hygiene
82,
621–625.CrossRefGoogle Scholar
Woolhouse, M. E. J. (
1992 a).
A theoretical framework for the immunoepidemiology of helminth infection.
Parasite Immunology
14,
563–578.Google Scholar
Woolhouse, M. E. J. (
1992 b).
Immunoepidemiology of intestinal helminths: pattern and process.
Parasitology Today
8,
111.Google Scholar
Woolhouse, M. E. J.,
Ndamba, J. and
Bradley, D. (
1994).
The interpretation of intensity and aggregation data for infections of Schistosoma haematobium.
Transactions of the Royal Society of Tropical Medicine and Hygiene
88,
520–526.CrossRefGoogle Scholar

Table 1. Parameter definitions for the deterministic model (model D)

Fig. 1. Solutions to the deterministic model (D) giving worm burden as a function of host age. Three scenarios are illustrated: (a) no interaction (γ21=γ12=0), (b) mutually antagonistic interaction (γ21=0·01 γ12=0·07), (c) mutually synergistic interaction (γ21=0·01 γ12=−0.005). For each scenario, the thick line represents species 1 and the thin line species 2. Other parameter values: λi=1·5 month−1, σi=1 month−1, μi=1/72 month−1, ηi=0·5 month−1 (i=1, 2), γ11=0·03, γ22=0·01.

Fig. 2. Mean worm burden as a function of age (from Eqn. 4). In (A–C) intra- and interspecific interactions are antagonistic; 1 of the 2 species has a convex age-intensity profile when the parameter values for the 2 species are not the same. (A) Mean worm burden as a function of age peaks in species 1 and increases monotonically in species 2 due to differences in the intra and inter-specific terms. Parameter values: 1=2=1 month−1, μ1=μ2=1/72 month−1, 11=0·01, 22=0·03, 21=0·04, 12=0·001. (B) When all the interaction parameters are equal, then the species with the shorter life-expectancy (species 1) will exhibit the peak. Parameter values 1=2=1 month−1, μ1=1/24 month−1, μ2=1/120 month−1, 11=22=21=12=0·02. (C) The peak may be imperceptible so that both species appear to increase monotonically. Parameter values: 1=2=1 month−1, μ1=μ2=1/36 month−1, 22=12=21=0·01,11=0·005. (D) The interspecific terms have opposite signs and age-intensity curves for both species are convex. Parameter values: 1=2=1 month−1, μ1=μ2=1/72 month−1, 11=22=21=0·01, 12=−0·1.

Table 2. Some examples of helminth demographic parameter values
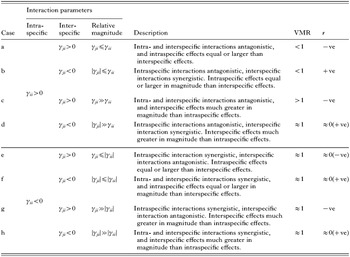
Table 3. Equilibrium index of dispersion (variance to mean ratio, VMR) for each helminth species, and sign of the correlation (r) between species at equilibrium for stochastic model S

Fig. 3. Equilibrium dispersion index, and correlation as a function of age from 100000 realizations of model S, when the intraspecific terms are antagonistic (γii>0 i=1, 2). (A) Equilibrium dispersion index (VMR) for different strengths of interspecific interaction (γji). Both mutually antagonistic (γji>0) and synergistic (γji<0) interspecific interactions increase the equilibrium VMR (relative to the value for γji=0), but for mutually synergistic interactions the index of dispersion appears not to exceed unity. Mutually antagonistic interactions for which the interspecific terms are greater in magnitude than the intraspecific terms can yield highly overdispersed equilibrium distributions. (B) Correlation between species 1 and 2 as a function of host age. We explore values of the interspecific terms, γji (i, j=1, 2; j≠i), that range from absence of interspecific interaction (γji=0), to a strong mutually antagonistic effect (γji=0·10) or a strong mutually synergistic effect (γji=−0·10). γji=0·01 illustrates case (a) of Table 3; γji=0·06 and γji=0·1 case (c); γji=−0·01 case (b); γji=−0·06 and γji=−0·1 case (d). Mutually antagonistic interspecific interactions (γji>0) yield negative correlations and mutually synergistic interactions (γji<0) yield positive correlations, for all host ages. However, when the interspecific terms are negative and much larger than the intraspecific terms (|γji|[Gt ]γii), then the equilibrium correlation approaches zero for large values of host age but is positive and convex for small values. Parameter values are: λi=5 month−1, σi=1 month−1, μi=0·05 month−1, ηi=1 month−1, γii=0·01 i=1, 2.

Fig. 4. Equilibrium dispersion index and correlation as a function of age from 100000 realizations of model S, when the intraspecific effects are synergistic (γii<0 i=1, 2). (A) Equilibrium dispersion index (VMR) for varying γji. When γji<0, VMR≈1. When γji>0, increasing the size of the interspecific terms rapidly leads to overdispersion of parasites amongst the host population (VMR>1). (B) Correlation between the worm burdens of species 1 and 2 as a function of host age; γji=0·01 illustrates case (e) of Table 3; γji=0·06 case (g); γji=−0·01 case (f), and γji=−0·06 case (h). Parameter values: γii=−0·05 i=1, 2, others as in Fig. 3.

Fig. 5. The joint equilibrium distribution (A) and single species distributions (B) of species 1 and species 2 worm burdens (100000 realizations of model S) for a mutually antagonistic interaction in which the interspecific effects are much stronger than the antagonistic intraspecific effects (γji[Gt ]γii>0). Hosts tend to have a large worm burden for one species and a very small or zero worm burden for the other species. Parameter values: λi=5 month−1, σi=ηi=1 month−1, μi=0·05 month−1, γii=0·01, γji=0·1, i=1, 2; j≠i.

Fig. 6. Index of dispersion at equilibrium and correlation as a function of age from 100000 realizations of model SRE, where exposure to species 1 (Λ1) and exposure to species 2 (Λ2) are positively correlated random variables. (A) Mutually synergistic interspecific interactions increase the index of dispersion at equilibrium relative to γji=0 and can cause overdispersion (compare with Fig. 3A). Large mutually antagonistic interactions (γji[Gt ]γii) cause overdispersion at equilibrium, whereas smaller ones reduce the VMR relative to that for γjj=0. (B) Since host exposures to the 2 species are positively correlated, mutually antagonistic interspecific interactions (γji>0) do not necessarily result in negative correlation between worm burdens. However, for small mutually antagonistic interactions (γji=0·01) there is a decline in correlation with increasing age which is not observed in the absence of interaction (γji=0). The distribution of (Λ1, Λ2) has parameter values: ζi=5, νi=2, ρ=0·5; i=1, 2. All other parameters are as in Fig. 3.
 You have
Access
- 26
- Cited by