Implications
Bull fertility and feed efficiency are important determinants of profitability of beef cattle production. There may be an inverse relationship between these traits. Our findings illustrated that bulls with higher feed efficiency have lower sperm motility, increased percentage of sperm abnormalities, lower testis echogenicity, larger seminiferous tubules with decreased cellularity and lower temperature variation at the top of the scrotum compared with less feed efficient bulls. Altogether, these indicate delayed sexual maturity in yearling bulls with superior feed efficiency. There is a need to ensure that evaluating young beef bulls will lead to enhanced feed efficiency and desirable fertility traits.
Introduction
The improvement of feed efficiency will provide economic (Herd et al., Reference Herd, Archer and Arthur2003) and environmental (Food and Agriculture Organization of the United Nations, 2013) benefits to the beef industry. Beef cattle breeding programs have emphasized genetic selection for improved feed efficiency through residual feed intake (RFI) (Berry and Crowley, Reference Berry and Crowley2013). Evidence suggests undesirable associations between selection for improved productivity and reproduction across a diversity of livestock species, as reviewed by Rauw et al. (Reference Rauw, Kanis, Noordhuizen-Stassen and Grommers1998). Recent research has indicated an inverse relationship between fertility-related measures and improved feed efficiency in young beef bulls. Wang et al. (Reference Wang, Colazo, Basarab, Goonewardene, Ambrose, Marques, Plastow, Miller and Moore2012) suggested that a greater proportion of young bulls failing the sperm motility assessment were classified as having superior feed efficiency. This evidence was supported by Awda et al. (Reference Awda, Miller, Montanholi, Vander Voort, Caldwell, Buhr and Swanson2013), who observed better motility and progressive motility in less feed efficient young bulls. Furthermore, Hafla et al. (Reference Hafla, Lancaster, Carstens, Forrest, Fox, Forbes, Davis, Randel and Hollaway2012) observed a negative association between feed efficiency and semen quality based on sperm morphology evaluation, an observation also reinforced by Awda et al. (Reference Awda, Miller, Montanholi, Vander Voort, Caldwell, Buhr and Swanson2013).
Assessment of sexual maturity and fertility in bulls is achieved by the measurement of scrotal circumference, and other biometrics are highly associated with daily sperm production and semen quality (Barth and Ominski, Reference Barth and Ominski2000), such as sperm motility (Walker et al., Reference Walker, Winet and Freund1982), sperm morphology (Martig and Alquimist, Reference Martig and Alquimist1969) and testicular histological parameters (Abdel-Raouf, Reference Abdel-Raouf1961). Non-invasive imaging technologies are also applied in the reproductive assessment of bulls. For example, IR thermography is used to evaluate thermal patterns of the scrotum that are related to bull fertility (Coulter, Reference Coulter1988); recent studies suggest semen production and quality are influenced by scrotal temperature (Kastelic, Reference Kastelic2014). Testicular ultrasonography is used to assess testicular echogenicity and respective image pixel intensity (Ahmad et al., Reference Ahmad, Ahmad, Naseer, Aleem, Khan, Ashiq and Younis2011), which is directly associated with sexual maturity (Evans et al., Reference Evans, Pierson, Garcia, McDougall, Hudrka and Rawlings1996).
Cattle with divergent feed efficiency display metabolic differences fundamentally related to energy partition (Kolath et al., Reference Kolath, Kerley, Golden and Keisler2006). Metabolic differences also influence the timing of sexual maturity (Pruitt et al., Reference Pruitt, Corah, Stevenson and Kiracofe1986). These differences are known to influence body composition (Birkett and de Lange, Reference Birkett and de Lange2001) and should be taken into consideration when modeling feed intake throughout performance assessments (Montanholi et al., Reference Montanholi, Swanson, Schenkel, McBride, Caldwell and Miller2009). Feed efficiency (Owens et al., Reference Owens, Dubeski and Hanson1993) and fertility (Coe, Reference Coe1999) vary with age, so young bulls evaluated for performance while still in the period of sexual development could display differences in feed efficiency and reproductive parameters such as organ biometry, semen quality, scrotum IR thermography, testicular ultrasonography and histomorphometry. The objectives of this study were to evaluate the associations between sexual maturity and fertility-related parameters with feed efficiency, which was calculated either solely accounting for BW parameters or by also accounting for body composition parameters, and to evaluate the relationship among fertility-related measures.
Material and methods
Animals and experimental design
This study was conducted at the Elora Beef Research Center (University of Guelph, Canada). All procedures were approved by the University of Guelph Animal Care Committee following the Canadian Council on Animal Care guidelines. The study used 34 bull calves (242±33.4 days of age, 310±54 kg of BW at the start of the trial, mean±SD), with an average breed composition of 60.4% Angus, 24.3% Simmental, 4.3% Limousin, 11% other Bos taurus breeds, which was determined by averaging the individual bulls’ breed composition calculated using the pedigree records. Bulls were housed and managed under the same conditions in an indoor pen (36×28 m) with 2/3 of the area bedded with wood shavings added at least once weekly. The pen was equipped with eight automated feeding stations (Insentec, B.B., Marknesse, The Netherlands), which allowed for the assessment of individual feed intake. Bulls were fed a corn-based diet for ad libitum consumption, first between 0830 h and 0930 h daily and from day 29 onwards bulls were also fed between 1530 h and 1630 h. The dry matter ingredient composition was as follows: 53.00% high-moisture corn, 39.84% alfalfa silage, 5.61% corn gluten meal, 0.60% limestone and 1.31% mineral premix, as described in detail by Montanholi et al. (Reference Montanholi, Swanson, Schenkel, McBride, Caldwell and Miller2009). The chemical composition of the diet was the following: 53.43% dry matter, 17.42% CP, 20.31% NDF, 13.32% ADF and 83.73% total digestible nutrients.
The experiment consisted of 112 days of feed intake and performance assessment. The bulls were weighed and ultrasound scanned for body composition every 28 days. The bulls were then kept in the same facilities for another 12±6.9 days for a complete breeding soundness evaluation (Society for Theriogenology, Montgomery, AL, USA; Chenoweth et al., Reference Chenoweth, Spitzer and Hopkins1992) and complementary measures of reproductive function. Bulls were slaughtered at an average of 389±34.0 days of age and 511±98.0 kg of BW. At slaughter, each testis and epididymis was dissected and measurements of mean testis and epididymis weight were obtained; additionally mean testis volume via water displacement was measured.
Body composition determinations: ultrasound and rib dissection
An indirect assessment of body composition in live bulls was performed by ultrasound (Aloka SSD-500, Tokyo, Japan) equipped with a linear long probe (model 5044, 172 mm, 3.5 MHz; Corometrics Medical System, Wallingford, CT, USA). The measurements performed were subcutaneous fat depth over the longissimus muscle in the fourth quadrant distal to the spine (back fat thickness (BKFT), mm), the longissimus muscle area (rib eye area (RBEA), cm2) and fatness at the juncture of the gluteus medius and superficial gluteus medius muscles (rump fat (RUMP), mm). Images were interpreted with the AUSKey program (Animal Ultrasound Services, Ithaca, NY, USA). Longitudinal scans across the 11th, 12th and 13th ribs were collected and marbling (MARB, score 1–11) was estimated using CPEC software (Cattle Performance Enhancement Company, Oakley, KS, USA).
Bulls were slaughtered at a federally inspected abattoir operated by the University of Guelph. As described by Mader et al. (Reference Mader, Montanholi, Wang, Miller, Mandell, McBride and Swanson2009), the carcass weight was recorded; next the 21-cm rib section (corresponding to the 10th, 11th, 12th ribs) was separated into subcutaneous fat, intermuscular fat, body cavity fat, lean tissue and bone, each of which were weighed and expressed as a percentage of the total of the 10th, 11th and 12th-rib section weight. Rib fat thickness was also measured (mm).
Feed efficiency assessment
The feed events recorded by the automated feeding system were first summarized by bull on a daily basis. These daily records were first filtered for known dates during which any individual animal was identified as sick and also for obvious outliers. This was followed by the definition of upper and lower limits for feed intake on an individual basis, to ensure inclusion of only daily feed intake with >98% probability of belonging to the normal distribution. The filtered feed daily feed intakes where then averaged on an individual basis and converted into a dry matter basis.
Average BW and mid-test body composition parameters were determined by a linear regression of each performance test on days on test, with five observations per bull at intervals of 28 days. Each bull had his own intercept in this approach and the mid-test values were calculated by computing the animals’ intercept plus the slope for each trait times 56 days (mid-test).
RFI was chosen as the criteria for feed efficiency and two RFI values were calculated for this study. The first (RFIKoch) was based on the model described by Koch et al. (Reference Koch, Swiger, Chamber and Gregory1963) and the second was based on the RFI models studied by Montanholi et al. (Reference Montanholi, Swanson, Schenkel, McBride, Caldwell and Miller2009), which include ultrasound traits (RFIus). The RFIKoch was calculated as follows:
 $${\rm DMI}=\beta _{0} {\plus}{\rm }\beta _{{\rm 1}} ({\rm ADG}){\plus}\beta _{{\rm 2}} ({\rm aBW}){\plus}{\rm RFI}_{{{\rm koch}}} $$
where β 0 (0.561) is the regression intercept, β 1 (0.930) and β 2 (0.016) the coefficients of the multiple linear regression of daily intake on average daily gain (ADG, kg/day) and average BW (aBW, kg), respectively, RFIKoch (kg/day) the residue of this regression. The coefficient of determination for RFIKoch was 0.88 and the Bayesian information criterion was 105. The RFIus was calculated as follows:
 $$\eqalignno{ {\rm DMI}= & \beta _{0} {\plus}\beta _{{\rm 1}} ({\rm ADG}){\plus}\beta _{{\rm 2}} ({\rm aBW}){\plus}\beta _{{\rm 3}} ({\rm BKFT}){\plus}\beta _{{\rm 4}} ({\rm MARB}) \cr & {\plus}\beta _{{\rm 5}} ({\rm RBEA}){\plus}\beta _{{\rm 6}} ({\rm RUMP}){\plus}{\rm RFI}_{{{\rm us}}} $$
where β 0 (−4.061) is the regression intercept and β 1 (0.844), β 2 (0.016), β 3 (0.470), β 4 (0.679), β 5 (−0.016) and β 6 (−0.118) the coefficients of the multiple linear regression of daily intake on ADG, aBW and mid-trial BKFT, MARB, RBEA and RUMP, respectively; RFIus (kg/day) the residue of this regression. The coefficient of determination for RFIus was 0.93 and the Bayesian information criterion was 114.
Scrotum IR thermography and scrotal circumference
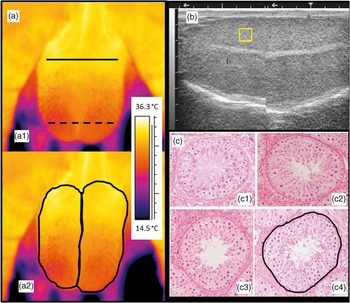
IR thermography was carried out with a portable camera (ThermaCamTM SC2000, FLIR Systems Inc., Wilsonville, OR, USA) equipped with a 24° lens and calibrated with an emissivity value of 0.98. Thermographs were taken at the start of the reproductive assessment at 0.8 m from the scrotum, while the animal was restrained in a squeeze chute. The images were used to assess the average and standard deviation of temperature (°C) patterns on the right and left sides of the scrotum, as well as the average and standard deviation temperature patterns across the base (neck region) of the scrotum over the proximal poles of the testes and across the apex of the scrotum over the distal poles of the testes (bottom portion). All images were interpreted using the ThermaCamTM Researcher 2001 software (FLIR Systems AB, Danderyd, Sweden) by drawing a line on the areas of interest (Figure 1a). Scrotal circumference was measured on all bulls using a scrotal measuring tape (Lane Manufacturing Inc., Denver, CO, USA). The tape was placed around the point of greatest diameter of the testes, and pulled snugly until firmly in contact with the entire circumference, as described by Barth (Reference Barth2000).
Imaging assessments of fertility-related measures in young beef bulls. (a) IR image of the bull scrotum, caudal plane. Note the top line (continuous black line for measuring the average and standard deviation temperatures (ºC) on the upper region of the scrotum) and the bottom line (dashed black line for measuring the average and standard deviation temperatures (ºC) on the lower part of the scrotum) (a1), and the black lines delimiting right and left side for measuring average and standard deviation temperatures (a2); (b) testicular ultrasonography, showing the square drawn to determine the minimum and maximum pixel intensity (pixels); (c) cross-section view of seminiferous tubules (400× magnification) at different maturity stages: immature maturity stages 1 and 2 and mature, as shown by (c1), (c2), (c3) and (c4). These were measured to determine diameter (mm²) for each developmental stage by drawing a contour line (c4).

Ultrasound assessment of testes
Ultrasonography of the testes was carried out with the same ultrasound scanner described above and connected to a 5 MHz linear array transducer (Ahmad et al., Reference Ahmad, Ahmad, Naseer, Aleem, Khan, Ashiq and Younis2011; Brito et al., Reference Brito, Barth, Wilde and Kastelic2012). Standardized ultrasound settings (focus of 1 and 2; overall gains of 90; near gain of 25; far gain of 2.1) were used for all animals. Each testis was examined by placing the transducer vertically (parallel to the long axis of the testis) on the caudal side of the scrotum. The visualization of the mediastinum testis was used as a landmark for capturing images. The ultrasound images were analyzed using the imaging software ImageJ® (US National Institutes of Health, Bethesda, MD, USA). A square was calculated proportional to the volume of the testicle obtained at slaughter, and then drawn above the mediastinum testis (Figure 1b); the minimum and maximum pixel intensities within the square were recorded.
Semen quality assessments
Semen was collected using an electro-ejaculator (Pulsator IV electro-ejaculator, Lane Manufacturing Inc., Denver, CO, USA). Semen samples were extended with Tris-buffered saline (Sigma-Alderich Co., St. Louis, MO, USA) with 20% egg yolk, (1 : 1 dilution) for further automated motility analysis (Sperm Vision® CASA, Minitüb, Tiefenbach, Germany) using a light microscope (Olympus BX41®, Tokyo, Japan). The motility measures obtained were motility (%) and progressive motility (%). For analysis of semen concentration, 1 ml of extended semen was diluted in 10 ml of formalin, and 0.1 µl was loaded into a Neubauer hemocytometer (Celeromics®, Grenoble, France) and examined in a microscope with phase contrast (Nikon Eclipse 50i, Nikon, Tokyo, Japan). Evaluation of sperm morphology was performed using nigrosin–eosin-stained slides at 1000× magnification (Nikon Eclipse 50i, Nikon, Tokyo, Japan) under immersion oil. A total of 100 sperm/animal were counted and analyzed, as described by Barth and Oko (Reference Barth and Oko1989). Results were grouped as percentages of normal and pathological sperm, similarly to Brito et al. (Reference Brito, Barth, Wilde and Kastelic2012); pathologies included loose heads, head defects, proximal and distal droplets, midpiece abnormalities and tail pathologies.
Histological classification and histomorphometry of seminiferous tubules
Both testes were cut along the sagittal plane to expose the mediastinum. Samples (1 cm thick) were collected from four different quadrants, two from each side of the mediastinum, on both right and left testis, within 58±14 min of slaughter. Samples were fixed in Bouin’s fluid for 24 h, and immersed in 70% ethanol until processing. Samples were processed routinely in a tissue processor (Renaissance TP™, Ventana Medical Systems Inc., Tucson, AZ, USA), embedded in paraffin, sectioned at 5 µm thickness using a microtome (Leica 2255®, Leica Biosystems, Wetzlar, Germany), mounted on glass slides, dried overnight on a hot surface (36°C) and stained with hematoxylin and eosin.
A light microscope (Nikon Eclipse 80i, Nikon, Tokyo, Japan) and imaging software were used for qualitative assessment of testes histology (Nikon ACT-1, Nikon, Tokyo, Japan). Under 400× magnification, seminiferous tubules were classified as one of the following: immature (Sertoli cells only), maturity stage one (Sertoli cells and spermatocytes), maturity stage two (Sertoli cells, spermatocytes and spermatids) or fully mature (Sertoli cells, spermatocytes, spermatids and spermatozoa), as described by Ahmed and Rooij (Reference Ahmed and de Rooij2009) (Figure 1c). Histomorphometric analysis was performed using the imaging software ImageJ® (US National Institutes of Health, Bethesda, MD, USA). Area (mm2) of cross-sections of tubules was calculated using images in an oblique orientation. The total number of seminiferous tubules analyzed per bull was 50±13.5 combining the two testes.
Statistical analysis
Data were analyzed using the SAS software. Descriptive statistics were determined using the univariate procedure. Preliminary regression analysis using the GLM procedure, similarly described by Montanholi et al. (Reference Montanholi, Swanson, Schenkel, McBride, Caldwell and Miller2009), indicated an absence of significant breed effects (P>0.10); therefore, breed effect was not included in the analyses detailed below. A categorical analysis was carried out in order to compare the bulls according to RFI values within each RFI determination model (RFIKoch and RFIus). Bulls were first classified into positive or negative RFI groups, resulting in two subgroupings of 17 bulls (Halves), which is a common classification criterion in RFI studies (e.g. Wang et al., Reference Wang, Colazo, Basarab, Goonewardene, Ambrose, Marques, Plastow, Miller and Moore2012). In addition, the extremes of the population (20.6%, or seven of the most and least feed-efficient bulls) were used to define the Tails classification. This approach is particularly relevant in the case of young bulls, given that in commercial settings only a small percentage of bulls tested will become breeding bulls owing to the intense selection on sires; such an approach has also been used by other authors (i.e. Awda et al., Reference Awda, Miller, Montanholi, Vander Voort, Caldwell, Buhr and Swanson2013). Means of the two feed efficiency groups, (high and low RFI) in each of the two RFI determination models and grouping sizes (Tails=7; Halves=17) were tested using the GLM procedure and compared using t-tests, according to the following model: Y ij =µ+Efficiency j +β(Age ij −Age..)+ε ij , where Y ij is the dependent variable measured on the kth bull, belonging to the jth feed efficiency group, µ the overall mean effect for the measure, Efficiency j the fixed effect of jth feed efficiency group. β(Age ijk −Age..) indicates the inclusion of age as a covariate at reproductive tract assessment and ε ij the residual random effect associated with the assessment on the kth bull. A similar model (without age as a covariate) was used to compare age at semen collection and age at slaughter between the RFI subgroupings. The relationships among fertility-related parameters were measured through Pearson’s correlation using the correlation procedure and including the whole data set. Correlations were tested for false discovery (controlled at 5%), as detailed by Benjamin and Hochberg (Reference Benjamin and Hochberg1995); only correlations within the acceptance range of this test were reported. For all analyses, data were considered statistically significant when P⩽0.05 and were considered a trend toward significance when 0.10⩾P>0.05.
Results
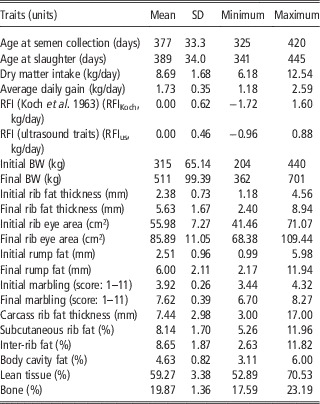
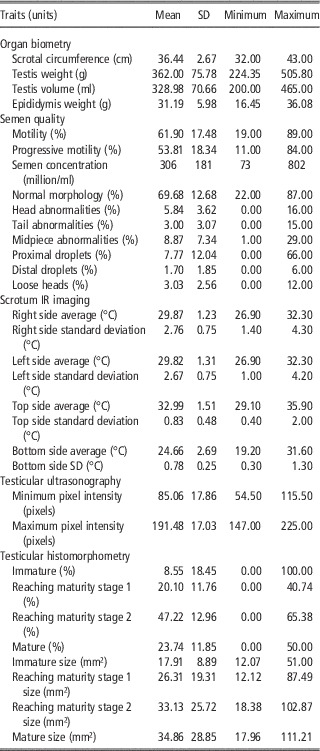
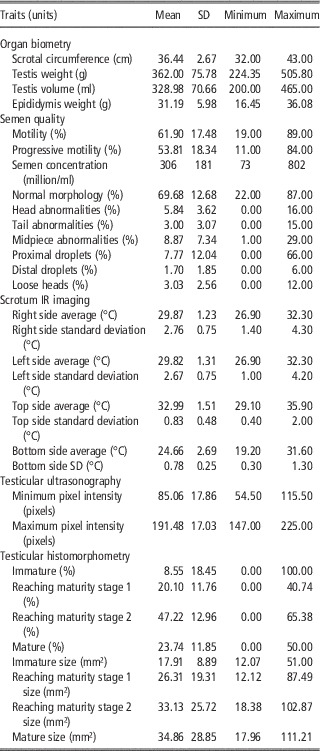
Based on the breeding soundness evaluation and complementary reproductive assessments, all the bulls reached a satisfactory status according to the beef industry standards for testing young bulls (Society for Theriogenology, Montgomery, AL, USA; Chenoweth et al., Reference Chenoweth, Spitzer and Hopkins1992). The descriptive statistics of all traits related to productive performance are presented in Table 1. Table 2 reports the descriptive statistics of all reproductive measures, which include organ biometry, scrotal circumference, semen quality, scrotum IR imaging, testicular ultrasonography and testicular histomorphometry, age at semen collection and age at slaughter.
Descriptive statistics of age and productive performance traits of young beef bulls

RFI=residual feed intake.
Descriptive statistics of reproductive traits assessed in young beef bulls
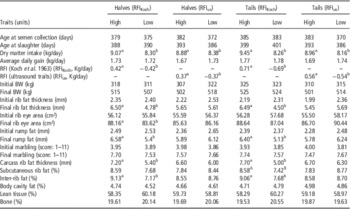
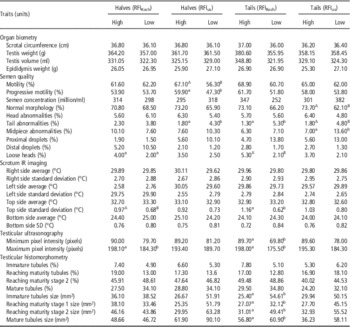
Tables 3 and 4 describe the least square means for productive performance, including age (Table 3) and reproductive traits (Table 4) by RFI model (RFIKoch and RFIUS) and by grouping size (Halves, n=17 and Tails, n=7). The RFIKoch and RFIus within the two classifications (Halves and Tails) were different between the high- and low-RFI groups (Table 3). This represents a difference in daily dry matter intake of up to 1.40 kg between inefficient (high RFI) and efficient bulls (low RFI), as reported for the Tails classification of the RFIKoch model (Table 3). The RFIKoch model suggested differences between the RFI groups (high and low RFI); in particular the final rib fat thickness and final rump fat appeared to be lower for the low-RFI animals among the Halves and Tails subpopulations. The RFIKoch model also indicated that low-RFI bulls had 25% (Halves) and 35% (Tails) less fat (carcass rib fat thickness) than the high-RFI bulls. Reproductive organ biometry measures did not differ between high- and low-RFI groups across the two RFI determination models and subpopulation sizes (Table 4).
Least square means of age, productive performance traits, measured in young beef bulls, by high- and low-RFI groups according to the two RFI determination models (RFIKoch and RFIus) and two population sizes per grouping (Halves=17 and Tails=7)

RFI=residual feed intake.
a,bIn the same row and within the same RFI classification are different (P<0.05).
A,BIn the same row and within the same RFI classification are trend toward significance (0.05<P⩽0.10).
Least square means of reproductive traits, measured in young beef bulls, by high- and low-RFI groups according to two RFI determination models (RFIKoch and RFIus) and two population sizes per grouping (Halves=17 and Tails=7)

RFI=residual feed intake.
a,bIn the same row and within the same RFI classification are different (P<0.05).
A,BIn the same row and within the same RFI classification are trend toward significance (0.05<P⩽0.10).
Indications of decreased semen quality were observed in low-RFI bulls. The RFIus model revealed a lower progressive motility and increased tail abnormalities in the Halves grouping, and suggested a decreased percentage of normal morphology (P<0.10) along with increased incidence of midpiece abnormalities in the Tails classification (Table 4). The abundance of immature, reaching maturity and mature seminiferous tubules did not differ between RFI models or grouping sizes (Table 4). Interestingly, the RFIKoch classification indicated that low-RFI bulls of the Tails grouping had seminiferous tubules of larger diameter than those of the high-RFI bulls within all different stages of maturity (Table 4).
The scrotum and testis imaging analysis performed on live animals revealed that, in the RFIKoch model (high-RFI animals of the Tails) had larger temperature standard deviation measured at the insertion of the scrotum in the abdomen compared with the low-RFI bulls (this finding appeared as a trend for the Halves (P<0.10) (Table 4). Conversely, means of the scrotum IR imaging traits did not differ between RFI models and grouping sizes (Table 4). The RFIKoch model and grouping sizes also demonstrated greater testis echogenicity for high-RFI bulls in both Halves and Tails population sizes (Table 4).
The evaluation of the relationships among fertility-related parameters indicated the following correlations (P<0.01) with age at semen collection: scrotal circumference, r=0.72; testis weight, r=0.67; testis volume, r=0.66 and epididymis weight, r=0.79. A strong negative correlation was observed between scrotal circumference and the percentage of immature seminiferous tubules (r=−0.58; P<0.01). The occurrence of sperm with distal droplets was negatively correlated with a smaller scrotal circumference (r=−0.33; P<0.10) and positively correlated with the percentage of immature seminiferous tubules (r=0.59; P<0.01). The average temperature at the top of the scrotum was negatively correlated with sperm head abnormalities (r=−0.48; P<0.01) and the standard deviation of this same location was positively correlated (P<0.05) with motility (r=0.37) and progressive motility (r=0.38). The temperature variation at the lower part of the scrotum was associated with lower occurrence of sperm with loose heads (r=−0.43; P<0.01). Minimum testis pixel intensity had a negative association with age at semen collection (r=−0.59; P⩽0.01).
Discussion
Improvement of feed efficiency along with reproductive performance is important to ensure the profitability of beef production systems. The difference in feed efficiency between the divergent subpopulations observed for the Tails comparison of the RFIKoch model represented up to 511 kg less dry matter intake on a yearly basis for each feed-efficient bull when compared with the inefficient bulls. In addition, bulls classified under different feed efficiency subpopulations had the same body composition, as reported in the RFIus comparisons (Table 3); this highlights the benefit of including ultrasound parameters in the determination of RFI, as was reported elsewhere (Montanholi et al., Reference Montanholi, Swanson, Schenkel, McBride, Caldwell and Miller2009; Awda et al., Reference Awda, Miller, Montanholi, Vander Voort, Caldwell, Buhr and Swanson2013). As RFI is heritable, bulls selected for improved feed efficiency bring economic benefits to the herd through genetic improvement (Herd et al., Reference Herd, Archer and Arthur2003). As the improvement in efficiency appears to be negatively associated with fertility-related parameters in bulls (Hafla et al., Reference Hafla, Lancaster, Carstens, Forrest, Fox, Forbes, Davis, Randel and Hollaway2012; Wang et al., Reference Wang, Colazo, Basarab, Goonewardene, Ambrose, Marques, Plastow, Miller and Moore2012; Awda et al., Reference Awda, Miller, Montanholi, Vander Voort, Caldwell, Buhr and Swanson2013), the present study further investigated the association between reproduction and feed efficiency and the association among parameters related to sexual development and fertility in young bulls.
The ultrasound traits included in the RFI determination model (RFIus) eliminated differences in body composition, as shown by final rib fat thickness and final rump fat, along with fat deposition on the ribs (carcass rib fat thickness) and inter-rib fat of both high- and low-RFI bulls for the two grouping sizes evaluated (Halves and Tails). Considering that the partitioning of the energy intake is influenced by energy retained for lipid and protein deposition in growing animals (Owens et al., Reference Owens, Dubeski and Hanson1993), this addition minimizes differences owing to chemical composition of gain (Montanholi et al., Reference Montanholi, Swanson, Schenkel, McBride, Caldwell and Miller2009).
In general, the different population sizes (Halves and Tails) indicated, as expected, more extreme means for the Tails comparisons. From the practical point of view, studies on young bulls should consider the extremes of the total population as only a small fraction of bulls are normally selected as breeding stock. The RFIus appeared to be more sensitive in discriminating differences in sexual maturity and fertility-related assessments than the RFIKoch. This suggests that assessment of feed efficiency accounting for body composition is appropriate for evaluating fertility measures, in agreement with Awda et al. (Reference Awda, Miller, Montanholi, Vander Voort, Caldwell, Buhr and Swanson2013). Further, relevance of body composition measures in the calculation of feed efficiency and production traits is related to the fact that the degree of body fatness and actual body composition play a critical role for the onset of puberty in cattle (Nelsen et al., Reference Nelsen, Long and Cartwright1982), this is particularly important in the case of yearling beef bulls still growing and developing reproductive capabilities.
Organ biometry traits were not associated with RFI. Similarly, Hafla et al. (Reference Hafla, Lancaster, Carstens, Forrest, Fox, Forbes, Davis, Randel and Hollaway2012) when studying a larger population, found no associations between scrotal circumference and RFI. In contrast, Awda et al. (Reference Awda, Miller, Montanholi, Vander Voort, Caldwell, Buhr and Swanson2013) when studying an intermediate-sized population, observed that less feed efficient bulls had a 7.8% larger scrotal circumference. Despite the fact that scrotal circumference is related to the sperm-producing ability and seminal quality of an animal (Willet and Ohms, Reference Willet and Ohms1957) and is a proven measurement to assess the reproductive capacity of a potential breeder (Barth and Ominski, Reference Barth and Ominski2000), it is an indirect and non-invasive measure, and as such is not as accurate as other parameters considered here for the comparison of feed efficiency, where differences of a lower magnitude appear to underlie the distinction between the feed efficiency subpopulations (Table 4).
In addition to counting the number of spermatozoa, assessment of semen quality (i.e. sperm motility and sperm morphology) is one of the most commonly used measures in the routine evaluation of bull fertility. The present findings suggest that more feed-efficient bulls (RFIus, Halves) had decreased progressive motility, confirming the findings of Awda et al. (Reference Awda, Miller, Montanholi, Vander Voort, Caldwell, Buhr and Swanson2013). Spermatozoa morphology also appeared to be affected by improved feed efficiency, as demonstrated by a higher incidence of sperm tail and sperm midpiece abnormalities, and decreased normal sperm morphology among the more efficient Tails and Halves populations of the RFIus determination model. This was also noted by Hafla et al. (Reference Hafla, Lancaster, Carstens, Forrest, Fox, Forbes, Davis, Randel and Hollaway2012). Wang et al. (Reference Wang, Colazo, Basarab, Goonewardene, Ambrose, Marques, Plastow, Miller and Moore2012) found a reduction in sperm motility and no differences in normal sperm morphology percentage of the feed-efficient sires. These authors (Wang et al., Reference Wang, Colazo, Basarab, Goonewardene, Ambrose, Marques, Plastow, Miller and Moore2012) also observed that even though motility was reduced, the number of progeny of the more efficient sires was suggested to be higher. Altogether, these results indicate that selection for feed efficiency could result in lower bull fertility owing to interactions with sperm motility and morphology. The present study showed phenotypic associations between fertility and efficiency traits. An extensive study is required to determine the genetic relationship between these traits, which would underpin the decline in fertility with selection for feed efficiency. An approach to select for fertility along with efficiency is likely to be successful, as these fertility traits are heritable (Cammack et al., Reference Cammack, Thomas and Enns2009).
We found no difference between scrotum surface temperatures among right or left sides between RFI groups, but there was a larger temperature standard deviation at the base of the scrotum in less-feed-efficient bulls. This suggests differences in scrotal thermoregulation, which influences semen quality (Kastelic, Reference Kastelic2014). When investigating the temperature patterns of the scrotum, Coulter (Reference Coulter1988) found variations at the top and bottom of the scrotum within 1°C–2°C that were associated with fewer primary sperm defects when compared with variations below 1°C, which supports the findings of the present study.
Testicular ultrasonography indicated that high-RFI bulls display higher testis echogenicity than low-RFI bulls (i.e. maximum pixel intensity for Halves comparison in both RFI determinations). Testes with advanced sexual maturity are more echogenic (Brito et al., Reference Brito, Barth, Wilde and Kastelic2012) and echogenicity is higher when there is a higher cellularity of the testis (Evans et al., Reference Evans, Pierson, Garcia, McDougall, Hudrka and Rawlings1996). In addition, low-RFI bulls appear to have seminiferous tubules with larger diameter. Curtis and Amann (Reference Curtis and Amann1981) observed increasing values for seminiferous tubule diameter as sexual maturity progressed. This assessment may not be related to lumen formation (Bressler and Lustbader, Reference Bressler and Lustbader1978), and instead could be an explanation for the lower testis echogenicity of the low-RFI bulls.
As expected, the age at collection was positively associated with all the organ biometry traits (scrotal circumference, testis weight and volume, epididymis weight), findings which are supported by another study (Barth and Ominski, Reference Barth and Ominski2000). Interestingly, the minimum pixel intensity found here was also correlated with age at collection, indicating that older bulls, likely closer to the onset of puberty or sexual maturity, have higher pixel intensity values, which is also shown elsewhere (Ahmad et al., Reference Ahmad, Ahmad, Naseer, Aleem, Khan, Ashiq and Younis2011; Brito et al., Reference Brito, Barth, Wilde and Kastelic2012). In addition, a larger scrotal circumference was associated with a lower occurrence of immature seminiferous tubules and a lower incidence of distal droplets in sperm. Altogether, these results reinforce the premise that a larger scrotal circumference is desirable in younger animals owing to the direct association with sexual maturity and semen quality. However, it is important to reiterate that in this study scrotum circumference was not correlated with feed efficiency.
Interestingly, temperature variation in the upper region of the scrotum was negatively correlated with motility measures of sperm. Similarly, a larger temperature variation in the lower area of the scrotum also appeared to be associated with decreased sperm possession of a loose head abnormality, illustrating the crucial role of the well-characterized scrotum thermoregulatory function, which functions to ensure seminal quality and subsequent bull fertility (Coulter, Reference Coulter1988). Similarly, the negative correlation between the average temperature at the scrotum neck and the occurrence of sperm defects indicates that bulls with improved thermoregulatory capacity have a lower occurrence of sperm abnormalities (Cook et al., Reference Cook, Coulter and Kastelic1994).
Bull fertility is a major factor influencing the profitability of the beef industry. However, a comprehensive and objective assessment of the reproductive performance of a bull is not a common routine in many commercial beef cattle operations. Feed-efficient bulls (low RFI) showed features of decreased fertility when compared with less-feed-efficient bulls (high RFI), which together can be interpreted as delayed sexual maturity. The associations between sexual maturity and fertility-related measures also provide evidence of the intricate biological association among the parameters assessed, which may have relevance in commercial applications to refine sexual assessment in bulls. Even though all bulls achieved the minimum requirements for approval in a routine breeding soundness evaluation (Society for Theriogenology, Montgomery, AL, USA; Chenoweth et al., Reference Chenoweth, Spitzer and Hopkins1992), deeper investigation argues that reproductive parameters should be part of breeding programs when deciding which bull to use for the improvement of feed efficiency, in order to prevent inadvertent selection against reproduction.
Conclusions
Seminal quality, scrotum IR imaging, testicular ultrasonography and histomorphometry are potential measures of sexual maturity and fertility-related measures in the context of feed efficiency. Based on this study, a more feed-efficient (low RFI) bull would have lower semen motility and progressive motility, more sperm defects, lower capacity of scrotal thermoregulation, lower pixel intensity and larger seminiferous tubules. These findings also suggest that alternative technologies can be used to assess sexual development in young bulls differing in feed efficiency. The adjustment for body composition while determining feed efficiency enabled additional biological inferences about reproductive function when compared with the non-adjusted model. In essence, both RFI models and the correlation analysis supported the hypothesis that feed-efficient bulls display features of delayed sexual maturity. Assessment of fertility-related measurements is important to avoid the improvement of feed efficiency at the expense of reproductive function in young beef bulls.
Acknowledgments
The authors would like to thank Benjamin Potvin, Kevin Colliver, Madison Kozak, Silvio Menegassi, Tim Caldwell and Vanessa Peripolli for the assistance with sample collection and data editing. The financial support from Beef Cattle Research Council, Agriculture and Agri-Food Canada, Canadian Simmental Association, Beef Farmers of Ontario and Ontario Ministry of Agriculture, Food and Rural Affairs is gratefully acknowledged.