1 Introduction
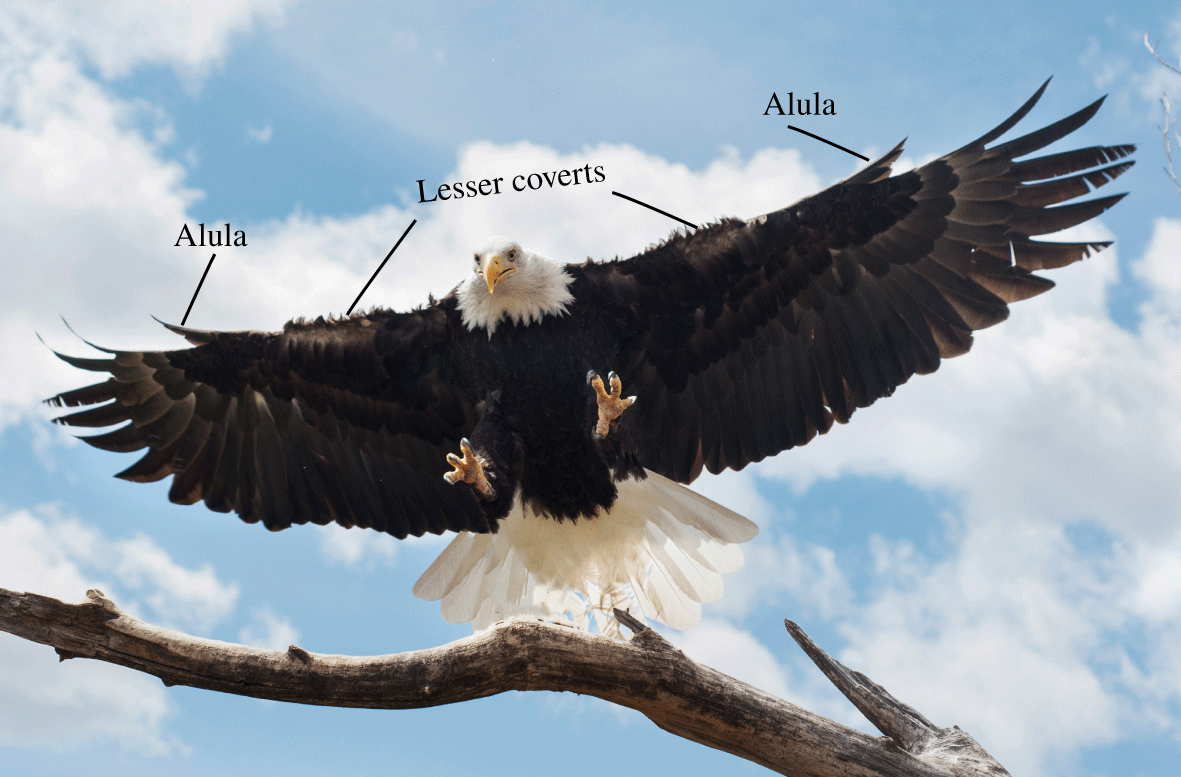
The expedient landing ability of birds stems from a delicate maintenance of separated flows across their wings. In a glide-assisted landing, birds tilt their wings to high angles of attack to produce the necessary drag forces required to airbrake to safe touchdown speeds (Videler Reference Videler2005; Carruthers, Thomas & Taylor Reference Carruthers, Thomas and Taylor2007). Despite the leading-edge flow being separated, as evinced by the deflection of the lesser covert feathers (figure 1), birds sustain the ability to control attitude by maintaining flow reattachment over their outer wing through use of their alular feathers (Lee et al. Reference Lee, Kim, Park, Jabloński and Choi2015). However, precisely how the alular feathers accomplish this remains unclear and has been veiled in part by a lack of three-dimensional flow measurements of the alula in the literature. Here, we use stereoscopic-digital particle image velocimetry (S-DPIV) to resolve the global, time-averaged, vortex flow over a canonical wing with model bird alulae and explain the mechanisms behind the alula’s stall prevention ability. The following portion of the introduction reviews the literature relevant to this work and concludes with an outline of the current approach.
Eagle landing on a branch. Deflected alular feathers (or alula) and lesser covert feathers as marked. Image courtesy of Kathleen Sue Sullivan.

The aerodynamics of the alula. A bird’s alula consists of a cohort of feathers, approximately 15 % the length of the bird’s wing (Alvarez et al. Reference Alvarez, Meseguer, Perez and Meseguer2001), that stem from the bird’s primary digit, or thumb (Videler Reference Videler2005). It was first observed on primitive birds living  $115+$ million years ago (Sanz et al. Reference Sanz, Chiappe, Pérez-Moreno, Buscalioni, Moratalla, Ortega and Poyato-Ariza1996; Zhang & Zhou Reference Zhang and Zhou2000; Foth, Tischlinger & Rauhut Reference Foth, Tischlinger and Rauhut2014) and is currently found on all modern bird species (minus hummingbirds) (Videler Reference Videler2005).
The alula’s function is largely aerodynamic, although research has indicated a possible sensory role (Brown & Fedde Reference Brown and Fedde1993). During slow flight or flight requiring the bird’s wing to be tilted at high angles, the alula increases wing lift by preventing stall (Alvarez et al. Reference Alvarez, Meseguer, Perez and Meseguer2001; Videler Reference Videler2005; Austin & Anderson Reference Austin and Anderson2007; Carruthers et al. Reference Carruthers, Thomas and Taylor2007; Lee et al. Reference Lee, Kim, Park, Jabloński and Choi2015) enabling birds to perform steeper descents with greater changes in body orientation when landing (Lee et al. Reference Lee, Kim, Park, Jabloński and Choi2015).
Despite consensus regarding the alula’s stall-prevention ability, details of the underlying mechanisms remain unresolved. Aeroelastic observations of alula deflections during gliding portions of a bird’s perching sequence show that the alula passively peels, then is actively protracted, from the plane of the wing (Carruthers et al. Reference Carruthers, Thomas and Taylor2007). The resulting gap formed between the alula and the top surface of the wing, as depicted in figure 1, has resulted in early comparisons of the alula to flow control devices on aircraft such as leading-edge slots or slats that work by energizing the boundary layer to subvert its detachment and sustain wing lift (Alvarez et al. Reference Alvarez, Meseguer, Perez and Meseguer2001; Meseguer et al. Reference Meseguer, Franchini, Prez-Grande and Sanz2005; Austin & Anderson Reference Austin and Anderson2007). However, this explanation does not account for the three-dimensionality of the alula, which, in its deflected state, mimics a miniature, outboard canted flap positioned at the leading edge of the bird’s wing.
The discovery of conical leading-edge vortices (LEVs) over the thin hand wings of real (Lentink et al. Reference Lentink, Müller, Stamhuis, de Kat, van Gestel, Veldhuis, Henningsson, Hedenström, Videler and van Leeuwen2007) and model (Videler, Stamhuis & Povel Reference Videler, Stamhuis and Povel2004) swift wings has prompted a revaluation of the aerodynamics of the alula. Videler et al. (Reference Videler, Stamhuis and Povel2004) argued that the arm wing and hand wing of birds have differing lift-generating mechanisms; the thick-profiled arm wing abides by conventional ‘attached-flow’ aerodynamic principles and the thin hand wings induce separated LEV flow. Videler (Reference Videler2005) suggests that the alula, which overhangs the thin hand wing of birds, likely prevents stall via maintenance of separated edge flow rather than preventing flow separation from occurring in the first place.
Two updated interpretations of the aerodynamic function of the alula have been put forth (Videler Reference Videler2005; Carruthers et al. Reference Carruthers, Thomas and Taylor2007). First, that the alula operates like a boundary-layer fence by producing a small vortex that separates the attached-flow system on the arm wing and the separated LEV on the hand wing (Videler Reference Videler2005). A second proposed function of the alula is that it promotes LEV formation over the swept-back hand wing of birds in flight scenarios when the arm wing is completely stalled (Videler Reference Videler2005; Carruthers et al. Reference Carruthers, Thomas and Taylor2007). Carruthers et al. (Reference Carruthers, Thomas and Taylor2007) observed the steppe eagle Aquila nipalensis to morph its wings into a distinct M-shape during the pitch-up phase of its perching sequence. They hypothesized the alula in this scenario to operate like a strake on a delta-winged aircraft, producing a vortex that promotes LEV formation on the swept-back hand wing.
Several recent experimental investigations have provided evidence in support these claims (Lee et al. Reference Lee, Kim, Park, Jabloński and Choi2015; Mandadzhiev et al. Reference Mandadzhiev, Lynch, Chamorro and Wissa2017; Ito, Duan & Wissa Reference Ito, Duan and Wissa2019). Lee et al. (Reference Lee, Kim, Park, Jabloński and Choi2015) conducted force measurements on severed magpie wings in a wind tunnel and performed PIV to resolve the flow in the vicinity of the alula. Wings were dried so that the alula was abducted (or swept forward) from the wing’s leading edge. There was no mention of the alula’s cant angle in these experiments. Load measurements conducted at a wide range of angles of attack found the lift enhancement effect of the alula to be as high as 12.7 %. PIV measurements were taken with the wing at an angle of attack of  $24^{\circ }$. At this incidence, the alula increased the lift of the wing by 6.7 %. Flow measurements in streamwise planes showed that the alula reduces the separation region (relative to the wing without the alula) at spanwise stations outboard of the alula’s root, where this effect was most pronounced outboard of the alula’s tip. Flow measurements in cross-stream planes revealed the emergence of a strong streamwise vortex near the tip of the alula at chordwise stations immediately aft of it. With downstream distance, this vortex lifted off the wing plane and vortices of opposite rotation to the alula tip vortex appear adjacent to the alula tip vortex of comparable strength. These results led the authors to conclude that the alula functions like a vortex generator producing a streamwise vortex whose rotation induces downwash to prevent boundary-layer separation in the vicinity of the alula. Furthermore, they indicate that near-surface root-to-tip spanwise flow associated with the streamwise vortex is the cause of suppressed flow separation outboard of the alula’s tip. However, the PIV measurements only show root-to-tip spanwise flow inboard of the alula’s tip, which does not explain the reduced separation region lying outboard. In the current work, we will provide evidence that suggests the observed reduced separation region outboard of the alula is likely associated with a three-dimensional alula-induced LEV which sweeps across the outer edges of the wing.
In another experimental study, Ito et al. (Reference Ito, Duan and Wissa2019) used hot-wire anemometry to investigate the aerodynamic performance of an alula-inspired leading-edge device (LEAD) affixed to an  $A=2.75$ cantilevered wing with a S1223 airfoil. The LEAD was tested at non-zero cant angles and the abduction angle was kept at zero. The spanwise location of the LEAD and its incidence angle were also investigated. They distinguished the aerodynamic function of the LEAD at partial-stall and deep-stall conditions. Under partial-stall conditions the LEAD enhanced wing lift like a traditional slat by reducing the wake deficit in the vicinity of the LEAD. However, under deep-stall conditions, the wake deficit was found to be also reduced at spanwise stations outboard of the LEAD’s tip. Each of these findings are consistent with the PIV results of Lee et al. (Reference Lee, Kim, Park, Jabloński and Choi2015). Ito et al. also compared the aerodynamic benefit of the LEAD on a three-dimensional (3-D) wing to the LEAD on a 2-D airfoil. They found the post-stall lift enhancement of the LEAD is larger when affixed to the 3-D wing which led them to hypothesize that there exist interactions of LEAD vortices and the wing tip vortex which bolster the performance of the LEAD. In this work, we provide evidence that it is more likely the LEV–tip vortex interaction (as opposed to the alula vortex–tip vortex interaction) that drives the post-stall lift benefit of the LEAD on the 3-D wing.
In a recent computational study, Sander (Reference Sander2018) analysed three-dimensional vortex flows over a simplified wing–alula model simulating both gliding and flapping flight. The wing had a cambered airfoil whose thickness reduced as the tip was approached. Moreover, the outer half of the wing geometry had a leading edge that was swept back  $30^{\circ }$. The alula considered was uncanted and several sweep angles of the alula were investigated. For gliding simulations, an alula tip vortex was observed most prominently at pre-stall angles of attack, where the length and stability of this vortex was observed to diminish at post-stall angles due to its interaction with the separated wing boundary layer. This observation led Sander to remark that the streamwise vortex measured by Lee et al. (Reference Lee, Kim, Park, Jabloński and Choi2015) may not be an alula tip vortex after all but rather the separated boundary layer of the alula. Sander also noted an alula leading-edge vortex to be formed at post-stall angles of attack specifically when the alula was swept forward (or abducted) from the inner wing’s leading edge. He notes that at angles of attack greater than
 $25^{\circ }$ this vortex interacts with the free-shear layer formed behind the leading edge of the wing inducing a region of low pressure thus increasing both lift and drag in this post-stall regime. However, during gliding simulations an LEV was not observed on the wing with, or without, the alula. Only for flapping simulations was an LEV observed which existed both in runs with, and without, the alula. Here, Sander observed the alula tip vortex to be sucked into the stronger LEV and found negligible changes in the flow topology and pressure distribution between test cases. Sander concluded that for the test cases considered in the study, the model alula granted negligible aerodynamic benefit for flapping flight. While these results appear to refute the hypothesis that the alula promotes LEV formation over the hand wing of birds, a key parameter of the alula was not modelled in the study: the alula’s cant angle. We will show this to be a necessary parameter of the alula both in terms of LEV formation and stability. Furthermore, we will show that wing sweep is not necessary to maintain an attached LEV via a model alula.
Post-stall flows over finite wings at high incidences. The leading-edge vortex (LEV) is a flow pattern leveraged by natural and man-made fliers to achieve high-lift generation during flight involving separated flow (Ellington et al. Reference Ellington, van den Berg, Willmott and Thomas1996; Dickinson, Lehmann & Sane Reference Dickinson, Lehmann and Sane1999; Thomas Reference Thomas2002; Videler et al. Reference Videler, Stamhuis and Povel2004; Lentink et al. Reference Lentink, Müller, Stamhuis, de Kat, van Gestel, Veldhuis, Henningsson, Hedenström, Videler and van Leeuwen2007; Muijres et al. Reference Muijres, Johansson, Barfield, Wolf, Spedding and Hedenstrom2008; Warrick, Tobalske & Powers Reference Warrick, Tobalske and Powers2009; Hubel & Tropea Reference Hubel and Tropea2010; Bomphrey et al. Reference Bomphrey, Nakata, Phillips and Walker2017). Many interpretations of lift enhancement via LEV flow exist. The stationary vortex model of Saffman & Sheffield (Reference Saffman and Sheffield1977) showed theoretically that a free vortex attached to the wing increases wing lift by inducing a stronger bound circulation around the wing. Xia & Mohseni (Reference Xia and Mohseni2013) showed lift enhancement of the stabilized LEV to be the combined effect of both LEV and TEV motion where an attached LEV, moving with the airfoil, decreases the negative lift contribution associated with the downstream motion of the LEV. Physically, the presence of a recirculatory LEV above the wing accelerates fluid on the wing’s top surface which enhances lift via suction. In each interpretation, the key to harnessing LEV lift is prolonging its residence near the wing surface for the time scales relevant to the flight objective. Flapping fliers such as insects (Ellington et al. Reference Ellington, van den Berg, Willmott and Thomas1996; Dickinson et al. Reference Dickinson, Lehmann and Sane1999; Thomas Reference Thomas2002; Bomphrey et al. Reference Bomphrey, Nakata, Phillips and Walker2017) depend on rotational accelerations, wing kinematics and planform geometry to stabilize the LEV. Mechanisms such as Coriolis tilting (Lentink & Dickinson Reference Lentink and Dickinson2009; Jardin Reference Jardin2017), vorticity annihilation (Wojcik & Buchholz Reference Wojcik and Buchholz2014) and spanwise vorticity convection and vortex stretching (Jardin & David Reference Jardin and David2014; Wong & Rival Reference Wong and Rival2015) have been linked to LEV stability. Readers are referred to Eldredge & Jones (Reference Eldredge and Jones2019) for a detailed review of LEV mechanics on manoeuvring aerofoils and wings. However, as this manuscript attempts to resolve the LEV-stabilizing ability of the alula in a glide-assisted landing scenario, the following review focuses on steadily translating wings operated at post-stall incidence angles.
The fluid dynamics and associated loading of a finite wing at post-stall incidences are dominated by the growth, development and interaction of the vortices stemming from the edges of the wing. The transient motion of the wing involves the roll-up of leading-, trailing- and side-edge shear layers into a leading-edge vortex, trailing-edge vortex and tip vortices, respectively, that collectively form an apparent vortex loop (Freymuth, Finaish & Bank Reference Freymuth, Finaish and Bank1986; Taira & Colonius Reference Taira and Colonius2009). Taira & Colonius (Reference Taira and Colonius2009) showed via computations at a chord-based Reynolds number of  $Re_{c}=O(100)$ that with increasing time the trailing-edge vortex is displaced further into the wake and the tip vortices form columnar structures. The LEV continues to accumulate spanwise vorticity, subsequently growing in length and eventually sheds, likely when the length of the LEV approaches or exceeds that of the chord (Rival et al. Reference Rival, Kriegseis, Schuab, Widmann and Tropea2014). Hair-pin-type leading-edge vortices are continually shed which disrupt the coherency of the columnar tip vortices. Around this time, the lift of the wing peaks and settles to a lower nominal value. At Reynolds numbers in the range
 $Re_{c}=O(10^{4}{-}10^{5})$ the LEV and its shedding is transitional and is characterized by a Kelvin–Helmholtz instability in the leading-edge shear layer (Morse & Liburdy Reference Morse and Liburdy2009; Okamoto & Azuma Reference Okamoto and Azuma2011).
Regulating LEV growth and/or shedding is thus key to sustained lift generation during steady flight at post-stall incidences. Certain modifications to the geometry of the wing are known to achieve this. Wings of sufficiently low aspect ratio produce downward-induced velocity via tip vortex downwash that pin the LEV close to the wing plane (Taira & Colonius Reference Taira and Colonius2009). This downwash forces LEV vorticity to recirculate above the wing restricting large-scale vortex shedding (Linehan & Mohseni Reference Linehan and Mohseni2017). DeVoria & Mohseni (Reference DeVoria and Mohseni2017) explains that tip vortex downwash limits the chord-wise growth of the LEV as indicated by its aft saddle point lying on the wing surface as opposed to in the wake. The existence of the saddle point upstream of the trailing edge results in a smooth merging of flow at the trailing edge, reduced trailing-edge vorticity generation and, in consequence, sustained wing lift.
In addition to tip vortex downwash, LEV shedding can be delayed or curtailed at high incidences by encouraging the spanwise transport, or release, of vorticity toward the wing tip through use of curved or swept leading edges (Taira & Colonius Reference Taira and Colonius2009). On rectangular wings, the LEV and tip vortices remain separate structures due to the sharp corners of the wing, however, for the elliptical-type and semicircular test cases considered by Taira & Colonius (Reference Taira and Colonius2009) there are no discontinuities in the vortex sheet that emanates from the leading edge and wing tips. Moreover, the elimination of wing tips altogether through use of a delta-wing planform is readily understood to form two separate but stable LEVs on the left and right wings.
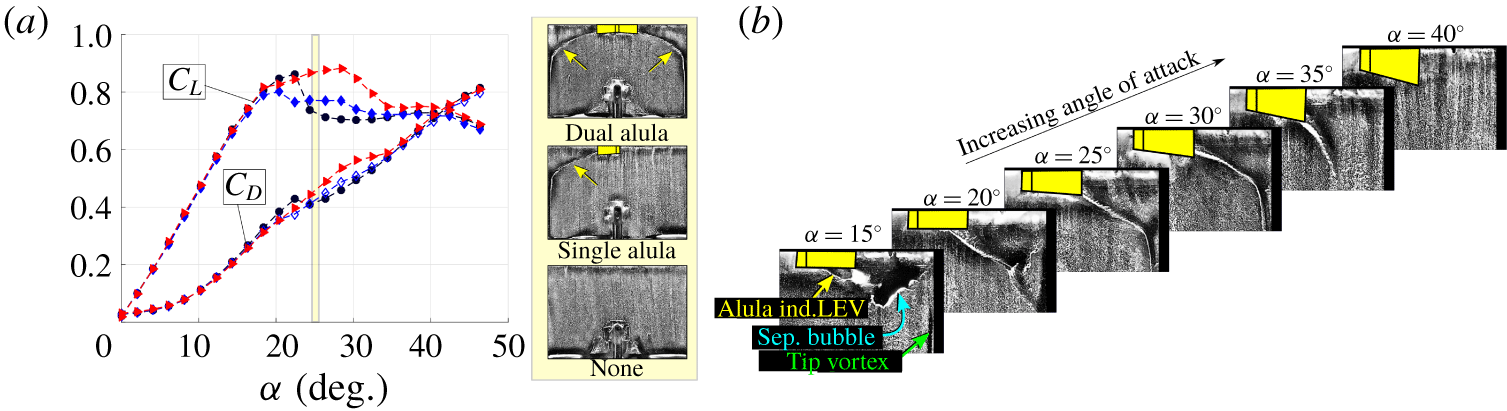
The apparent alula-induced leading-edge vortex and its effect on post-stall lift generation. (a) Lift and drag coefficient as a function of angle of attack for an  $A=1.5$ wing with no alula (circles), a single alula (diamond) and dual-opposing alulae (triangles). Surface-oil visualizations conducted at
 $\unicode[STIX]{x1D6FC}=25^{\circ }$. Separation line associated with an apparent alula-induced LEV indicated by yellow arrows. Alula indicated by boxes. (b) Effect of angle of attack on separation lines observed outboard of the alula. Adapted from Linehan & Mohseni (Reference Linehan and Mohseni2019).

Prior work and current approach. The above insights into the effects of planform geometry on LEV stability for wings in steady translation may lead one to investigate wing morphing as a possible means to stabilize the LEV across operating points. However, force measurements of Lentink et al. (Reference Lentink, Müller, Stamhuis, de Kat, van Gestel, Veldhuis, Henningsson, Hedenström, Videler and van Leeuwen2007) on real swift wings showed that wing morphing via sweep back always generated less lift than extended (or spread) wings because the extra lift from LEVs (stabilized via wing sweep) does not compensate for lift lost due to the simultaneous drop in wing area and aspect ratio. The authors of the current work have been investigating the possibility that a bird’s alula can induce and stabilize a LEV on a wing without requiring the wing to be swept back. This feature would enable the bird to maintain a spread-wing gliding posture to maximize aerodynamic forces during landing or manoeuvring while subsequently utilizing LEV lift to stay aloft and adjust attitude.
In Linehan & Mohseni (Reference Linehan and Mohseni2019), force measurements alongside surface-oil visualizations were performed on a canonical wing–alula configuration. The wing and alula were modelled as thin, rectangular flat plates with relative dimensions consistent with bird measurements where the alula itself was represented by an outboard canted flap whose area was 1 % that of the wing. The lift benefit of the alula was found to be isolated to post-stall incidences in the range  $22^{\circ }{-}38^{\circ }$ (figure 2). Surface-oil visualizations performed in this angle of attack range revealed the surface footprint of an apparent vortex which stemmed from the root of the model alula and swept across the outer edges of the wing; features not observed on the baseline (plain) wing. The addition of a second alula resulted in two vortex systems on the left and right wings, respectively. Post-stall lift enhancement was found to be as high as 13 % and 25 % for certain single and dual alula configurations. The authors hypothesized this vortex to be a leading-edge vortex formed from the interaction of the wing’s leading-edge shear layer with the bottom surface of the canted alula. Linehan & Mohseni (Reference Linehan and Mohseni2020) corroborated the existence of the so-called ‘alula-induced LEV’ flow pattern and, in comparing wind tunnel predictions to measurements of the alula on spread-wing bird specimens, showed that most landbirds have their alula stationed at or near the spanwise location that maximizes alula-induced LEV lift. Despite this work, the mechanisms underlying the formation and stability of the alula-induced LEV remain unclear. In the current work, we use detailed S-DPIV flow measurements to help explain the alula’s maintenance of the LEV and its connection to post-stall lift enhancement.
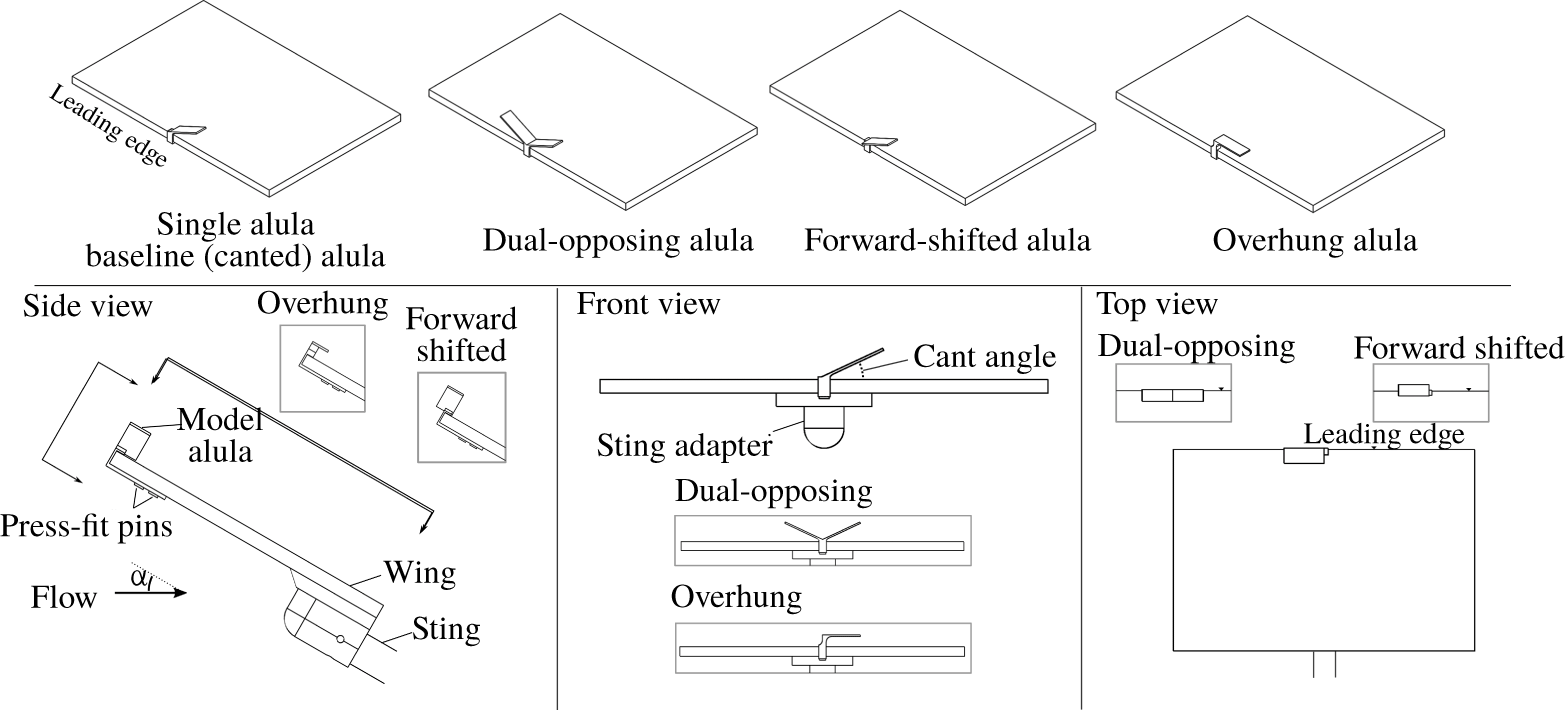
Computer aided design (CAD) models of alula test cases. Labelled views show wing affixed with the single canted alula.

The paper is organized as follows. The experimental set-up is described in § 2. The global flow structure over the wing with and without alula(e) is described in § 3. The creation and stabilization mechanisms associated with the observed attached vortex system are investigated in § 4 through analysis of LEV formation (§ 4.1), vortex tilting and outboard vorticity flux (§ 4.2), and spanwise flow generation (§ 4.3). We also consider the reduced effectiveness of the alula at high angles of attack (§ 4.4). Concluding remarks are then given in § 5.
2 Experimental set-up and methodology
This study focuses on the fluid dynamics of the wing–alula interaction under deep-stall conditions. At this operating point, the flow over the wing and alula is massively separated with boundary-layer separation occurring at the edges of each structure. Therefore, properties of the wing and alula profiles, such as airfoil, edge shape and camber, were considered secondary to parameters such as the relative size of these structures and the shape of the wing. In this rudimentary emulation of the wing–alula geometry we hoped to isolate the key physics at this operating point which may have been veiled if the more complex features of the alula and wing were included, but not properly modelled.
Figure 3 depicts the wing–alula geometries considered in this study. The wing is an acrylic rectangular flat plate with a chord of 9.53 cm and a span of 14.29 cm ( $A=1.5$). The rectangular wing planform was selected to isolate the potential vortex stabilizing mechanisms of the model alula from that associated with leading-edge (planform) curvature of the wing. The thickness of the wing was
 $0.047c$ where
 $c$ is the wing chord. All edges were left square. We note that the square leading-edge profile of this wing differs from the 5 : 1 elliptical leading-edge profile of the wing used in the force measurements of figure 2. Model alulae were mounted to the wing via 3D printed, low-profile, press-fit pins. The alula is represented as a rigid flat plate with a fixed geometry and orientation with its root positioned at the midspan of the wing. It has a rectangular planform with a thickness of
 $0.008c$, a span of
 $0.15b$ and an area of
 $0.01S$, where
 $b$ is the wing length and
 $S$ is the wing area. The relative span length of the alula is consistent with measurements of the alula on birds (Alvarez et al. Reference Alvarez, Meseguer, Perez and Meseguer2001). Unless otherwise noted, the leading edge of the alula is offset
 $0.007c$ in front of the leading edge of the wing.
The orientation of the alula relative to the wing is defined by three angles: (i) The incidence angle, or the angle of the alula’s chord relative to the wing chord. (ii) The deflection angle or cant angle, defined by the rotation of the alula from the plane of the wing about a longitudinal axis aligned with the alula’s root. (iii) The pronation angle, or the sweep angle of the alula (in the plane of the wing) relative to the wing’s leading edge. We found in our previous study (Linehan & Mohseni Reference Linehan and Mohseni2019) that the alula’s cant angle influenced the post-stall lift benefit of the alula, where maximum lift enhancement occurred when the alula was canted off the plane of the wing at an angle of  $25^{\circ }$. Moreover, it was found that the alula’s incidence angle had no measurable influence on the aerodynamic benefit of the alula. One should note that these results are in conflict with Ito et al. (Reference Ito, Duan and Wissa2019) who did show an aerodynamic influence of their LEAD’s incidence angle. We attribute this disagreement to differences in the wing profiles (thin flat plate versus thick airfoil) and the size of the LEAD which had a relative span length that was double that of the current model alula. The effects of the alula’s sweep angle was noted by Sander (Reference Sander2018), where the forward-swept alula was found to induce an alula leading-edge vortex (similar to the leading-edge vortex produced by a delta wing) whose interaction with the separated wing’s boundary-layer influenced wing loads. However, at the operating point under consideration we hypothesized the key physics to stem from the interaction of the wing’s leading-edge shear layer with the bottom surface of the alula. Therefore, we elected not to model alula sweep in an attempt to isolate these physics.
From the above arguments, the ‘baseline’ model alula was designed with a cant angle of  $25^{\circ }$ with an incidence angle and pronation angle of
 $0^{\circ }$. Two modified alulae were also tested: a ‘forward-shifted’ alula, and an ‘overhung alula’. The forward-shifted alula had identical properties as the baseline alula (described above), however, it was shifted forward on the wing such that its mid chord was approximately coincident with the wing’s leading edge (offset distance of
 $0.044c$). The overhung alula maintained the same chordwise location on the wing as the baseline alula but had its root vertically offset from the wing plane and possessed no cant angle. The gap between the overhung alula and the wing’s top surface was set so that its frontal area was approximately equal to that of the baseline (canted) alula. Moreover, the span of the overhung alula was kept the same as the projected span of the canted alula.
Each alula was printed using a 3D Systems Projet 2500 multijet printer. The printer has a net build volume (XYZ) of  $294\times 211\times 144~\text{mm}$ with a
 $800\times 900\times 790~\text{DPI}$ resolution with
 $32~\unicode[STIX]{x03BC}\text{m}$ layers. Resolution before post processing is
 $\pm 0.025{-}0.05~\text{mm}$ per 25.4 mm of part dimension. The material was VisiJet M2 RWT.
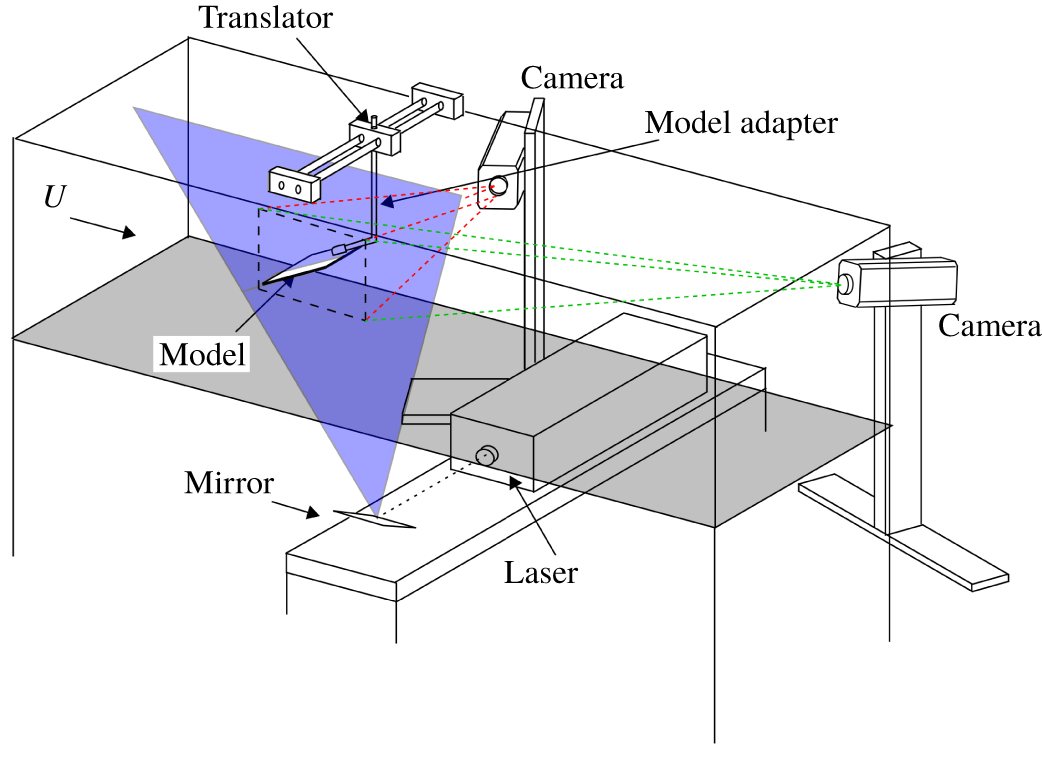
Experiments were performed in the Engineering Laboratory Design recirculating wind tunnel located at the University of Florida. The test section has a  $61\times 61~\text{cm}^{2}$ cross-section and is 2.44 m in length. As shown in figure 4, the wing–alula model was suspended upside down into the test section from a model adapter arm affixed to a robotic translator. The model adapter could be manually adjusted to set the wing’s incidence angle relative to the flow. Experiments were performed with the wing set at an angle of attack of
 $28^{\circ }$ with select cases repeated at an angle of attack of
 $36^{\circ }$. The flow speed was
 $12.1~\text{m}~\text{s}^{-1}$ corresponding to a Reynolds number of 75 000 which is within the range of bird flight (Videler Reference Videler2005). The turbulence intensity of the free stream was 0.12 % at the tested velocity.
Stereo-digital particle image velocimetry system in wind tunnel.

A S-DPIV system (figure 4) was used to measure the three-component velocity field in streamwise planes of the flow (2D-3C). The wind tunnel was seeded with  ${\sim}1~\unicode[STIX]{x03BC}\text{m}$ olive oil particles generated by an atomizer. These particles were illuminated by a 4 mm thick laser sheet generated by a 20 mJ Nd:YLF laser (Quantronix Darwin Duo,
 $\unicode[STIX]{x1D706}=527~\text{nm}$). The imaging system consists of high-speed CMOS 1 Mpx cameras (Phantom v210/v211,
 $1280\times 800~\text{px}^{2}$) with the object-to-image plane mapping function (Soloff, Adrian & Liu Reference Soloff, Adrian and Liu1997) determined with a precision-machined, dual-plane calibration target. Misalignment of the target with the laser sheet was corrected with the disparity map method (Soloff et al. Reference Soloff, Adrian and Liu1997; Willert Reference Willert1997; Wieneke Reference Wieneke2005) for which 100 images (of the undisturbed free stream) were used.
An approximation of the mean volumetric flow field (3D-3C) was constructed from closely spaced planes of S-DPIV data collected by translating the wing–alula model via robotic translator through a stationary vertically oriented laser plane. A total of 38 equally spaced streamwise planes of data were taken a distance  $0.06c$ apart on the wing where
 $c$ is the chord length of the wing. Each plane of S-DPIV data consists of 300 images taken at a rate of 100 Hz (3 s of acquisition time). Each image was processed with Insight 4G software by TSI Inc. Images were first dewarped according to calibration images taken for each camera. Thereafter, an iterative multi-pass DPIV evaluation algorithm consisting of windowing shifting/deformation was performed on each image pair. Interrogation windows were made rectangular starting from
 $40\times 40~\text{px}^{2}$ down to
 $20\times 20~\text{px}^{2}$ (50 % overlap). The resulting spatial resolutions of the volumetric flow measurements in the horizontal, vertical and streamwise directions are
 $\unicode[STIX]{x0394}y=0.06c$,
 $\unicode[STIX]{x0394}z=\unicode[STIX]{x0394}x=0.026c$. The size of the measurement volume is
 $2.94c\times 2.28c\times 2.94c$ where the total number of measured velocity vectors is
 $113\times 38\times 75$. Measured quantities such as circulation are computed using this grid. A refined grid with four times the resolution, i.e.
 $452\times 152\times 300$, is used for three-dimensional plots.
Unless otherwise noted, the coordinate system used to represent the data is in the laboratory axis where  $x$ is downstream,
 $z$ is toward azimuth and
 $y$ is out the right wing as observed from an observer at the trailing edge of the wing facing the leading edge of the wing. The coordinate origin is set at the trailing edge of the wing at the midspan location.
Statistics of S-DPIV measurements of the undisturbed free stream were used to quantify measurement errors. Taking each time-averaged velocity measurement in space as a single sample, velocity errors corresponding to twice the standard deviation of the sampling distribution were  $e_{u}/U=0.02$,
 $e_{v}/U=0.01$ and
 $e_{w}/U=0.02$. Vorticity is computed using the local circulation method (Raffel, Willert & Kompenhans Reference Raffel, Willert and Kompenhans1998). An estimate of the error in vorticity from this method is
 $e_{\unicode[STIX]{x1D714}}c/U=0.61e_{U}c/(U\unicode[STIX]{x0394}x)=0.72$ where
 $e_{U}$ is taken as the average of the above velocity errors.
The other computed quantity analysed in this work is circulation. The circulation attributed to coherent vortex structures in the flow such as the leading-edge shear layer and tip vortex is quantified via area integral of the component of the vorticity vector aligned in a particular direction. For example, we quantify the strength of the leading-edge shear layer using  $\unicode[STIX]{x1D6E4}_{y}^{+}$, which is computed via an area integral of positive spanwise-oriented vorticity in the flow, or
 $+\unicode[STIX]{x1D714}_{y}$, as vorticity comprising this shear layer is primarily aligned in this direction. Similarly, we represent the strength of the left tip vortex with
 $\unicode[STIX]{x1D6E4}_{x}^{-}$, which is computed via an area integral of negative streamwise-oriented vorticity in the flow, or
 $-\unicode[STIX]{x1D714}_{x}$.
In addition to specific components of circulation, we also compute total cross-stream circulation,  $\unicode[STIX]{x1D6E4}_{y}$, in an effort to interpret changes in aerodynamic lift between test cases via the Kutta–Joukowski theorem.
 $\unicode[STIX]{x1D6E4}_{y}$ is computed at each spanwise station by integrating tangential velocity along a closed path encircling the wing and separation region. We refrained from computing
 $\unicode[STIX]{x1D6E4}_{y}$ via area integral of
 $\unicode[STIX]{x1D714}_{y}$ because high-magnitude
 $-\unicode[STIX]{x1D714}_{y}$ produced via shear at the trailing edge of the wing could not be wholly resolved in our experiments. From the Kutta–Joukowski theorem, the change in sectional lift coefficient is related to cross-stream circulation in the following manner
 $\unicode[STIX]{x0394}c_{l}=2(\unicode[STIX]{x0394}\unicode[STIX]{x1D6E4}_{y})/(Uc)$ where
 $\unicode[STIX]{x0394}\{\cdot \}=\{\cdot \}_{alula\,case}-\{\cdot \}_{baseline\,case}$. This methodology was successfully used by Pérez-Torró & Kim (Reference Pérez-Torró and Kim2017) to interpret changes in sectional lift between deep-stalled aerofoils with and without wavy leading edges. Notably, Pérez-Torró & Kim (Reference Pérez-Torró and Kim2017) found the mean change in sectional lift coefficient between test cases as estimated via Kutta–Joukowski theorem to match the change in total lift coefficient estimated by integrating pressure around the aerofoils. Due to limitations in the current experimental set-up,
 $\unicode[STIX]{x1D6E4}_{y}$ was only calculated at spanwise stations on the left half of the wing, namely at
 $y/b\leqslant -0.1$, as the sting and sting adapter blocked the camera’s view of the flow below the wing at
 $y/b>-0.1$ (for example see voids in streamline patterns below the wing at
 $y/b=0.06$ in figure 10).
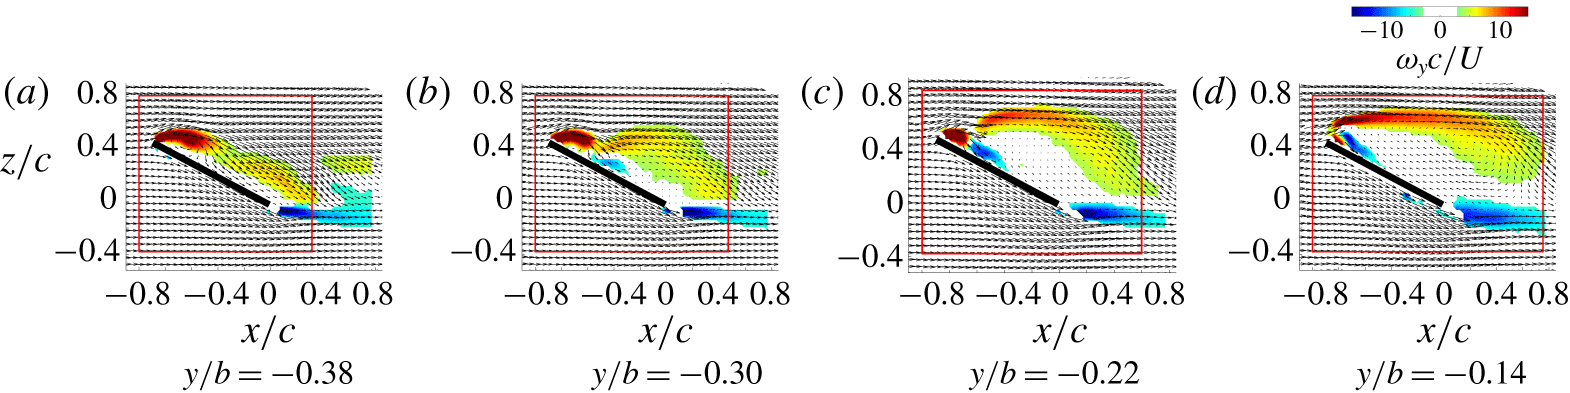
A rectangular contour path that encloses the wing and separation region was used for calculating  $\unicode[STIX]{x1D6E4}_{y}$ at spanwise stations on the left portion of the wing. The contour path was the same for all test cases for which circulation and sectional lift is compared. The contour varied in size across the span of the wing in order to accommodate the spanwise variation of the flow field near the wing tips which consists of a separation region that shrinks in size as the tip is approached. Figure 5 displays the contour path in relation to in-plane velocity and out-of-plane vorticity for select spanwise stations on the wing with a single alula. The downstream face of the contour path is constructed so that it moves toward the trailing edge of the wing linearly with spanwise location as the wing tip is approached in a manner that tracks the aft portion of the separation region harboured on the wing with the single alula.
Spanwise-varying contour path for circulation calculation. The red rectangle depicts the contour path of integration. Flow measurements are of the wing with a single alula at  $\unicode[STIX]{x1D6FC}=28^{\circ }$ where coloured contours depict out-of-plane time-averaged vorticity and the vector fields depict time-averaged velocity with every other measured vector shown.

3 Post-stall vortical flow over a wing with an alula
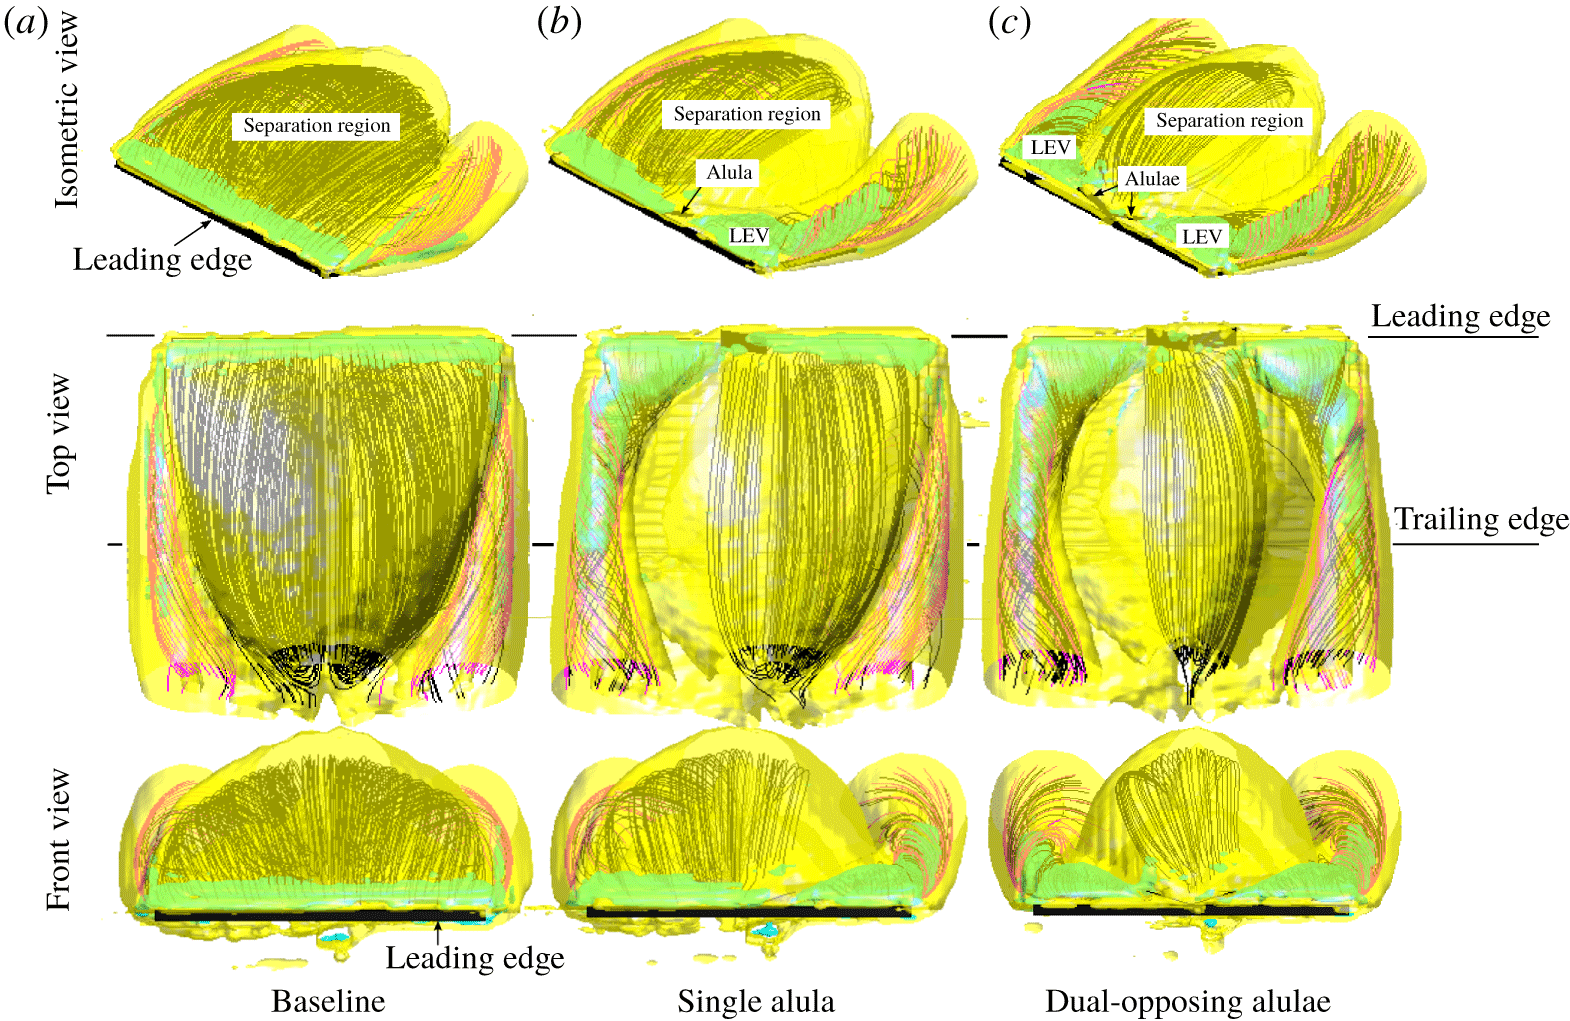
We begin by examining the three-dimensional time-averaged vortical flow over the wing with a single alula, and pair of alulae, in comparison to its plain wing counterpart. Figure 6 plots two different isosurface values atop three-dimensional streamline patterns. Vortex sheets are identified by an isosurface of vorticity magnitude ( $\Vert \unicode[STIX]{x1D74E}\Vert _{2}=3$) where vortex cores are identified by an isosurface of the
 $Q$-criterion (
 $Q=13$);
 $Q$ locally measures the excess of rotation rate relative to strain rate (Hunt, Wray & Moin Reference Hunt, Wray and Moin1988) and for incompressible flows is given by
 $Q\equiv {\textstyle \frac{1}{2}}(\Vert \unicode[STIX]{x1D734}\Vert ^{2}-\Vert \boldsymbol{S}\Vert ^{2})$, where
 $\unicode[STIX]{x1D734}\equiv {\textstyle \frac{1}{2}}[\unicode[STIX]{x1D735}\boldsymbol{u}-(\unicode[STIX]{x1D735}\boldsymbol{u})^{\text{T}}]$ and
 $\boldsymbol{S}\equiv \frac{1}{2}[\unicode[STIX]{x1D735}\boldsymbol{u}+(\unicode[STIX]{x1D735}\boldsymbol{u})^{\text{T}}]$. Streamlines are initialized at the leading edge of the wing at spatial locations of high-magnitude positive spanwise vorticity (
 $\unicode[STIX]{x1D714}_{y}>15$). These leading-edge streamlines are coloured black. Streamlines are also initiated at the side edges of the wing and are uniformly spaced along its chord. These streamlines are coloured magenta. To assist in interpreting flow reattachment, we also introduce figure 7 which compares side views of the three-dimensional streamlines initiated on the left third of the wing.
Time-averaged vortical flow over wing with no alula (a), single alula (b) and dual-opposing alulae (c). Shown in yellow is the isosurface of  $\Vert \unicode[STIX]{x1D74E}\Vert _{2}=3$. Shown in green is the isosurface of
 $Q=13$. Streamlines stemming from the side edge of the wing are coloured magenta. Streamlines stemming from the leading edge of the wing are coloured black. Rows depict isometric views, top views (parallel to wing plane) and front views (orthogonal to wing plane), respectively.

Side view depicting locus of three-dimensional streamlines on the left third of the wing. Streamlines stemming from the side edge of the wing are coloured magenta. Streamlines stemming from the leading edge of the wing are coloured black.

The flow over the baseline (plain) wing is first considered. From figure 6(a), vortical flow over the baseline wing takes the form of blanketing shear layers that envelop a separation region. Streamlines stemming from the leading and side edges of the wing follow the trajectory of the edge shear layer and from figure 7 these streamlines do not reattach back to the wing. We observe the separation region to extend downstream passed the wing’s trailing edge which implies that the flow over the baseline wing is ‘massively separated’ in this time-averaged sense.
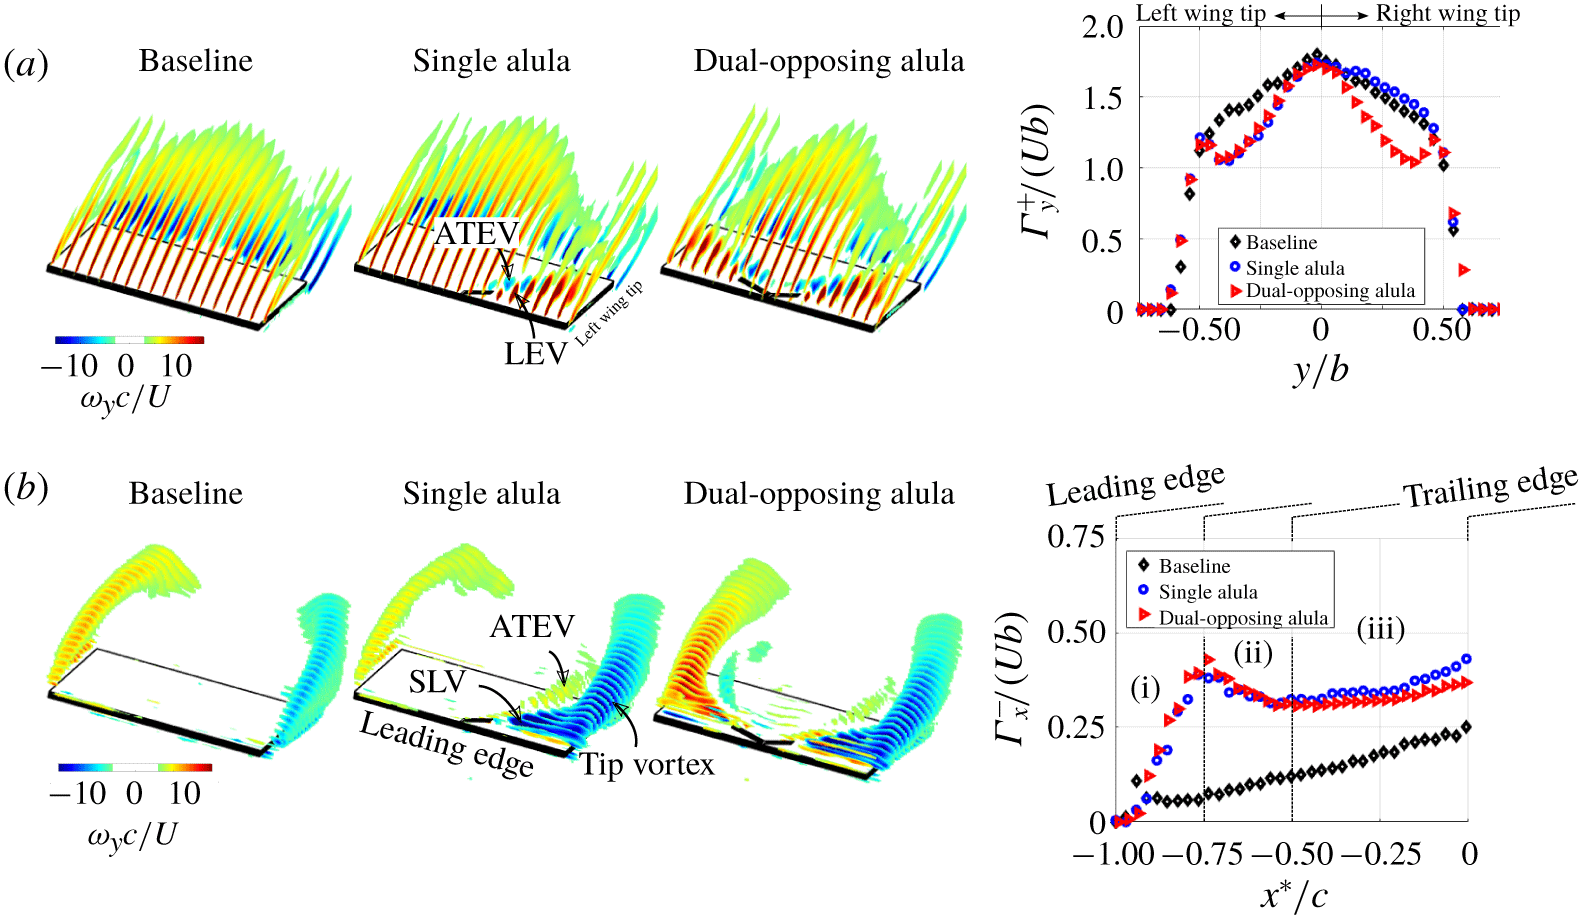
Contour slices of time-averaged (a) spanwise and (b) streamwise vorticity for the wing affixed with no alula (baseline), single alula and dual-opposing alulae. Plots on the right depict corresponding circulation distributions across the span and chord, respectively.  $\unicode[STIX]{x1D6E4}_{y}^{+}$ is computed via area integral of
 $+\unicode[STIX]{x1D714}_{y}$ in the flow.
 $\unicode[STIX]{x1D6E4}_{x}^{-}$ is computed via area integral of
 $-\unicode[STIX]{x1D714}_{x}$ in the flow, specifically that which is located above the wing plane on the left semispan. Regions marked (i)–(iii) are explained as follows: (i) emergence and growth of the surface-layer vortex, SLV, via aft tilting of LEV, (ii) amalgamation of SLV and side-edge shear layer into tip vortex, (iii) tip vortex strengthening through feeding of the side-edge shear layer.

The addition of a single alula to the wing results in two disparate vortical flow regions on the wing. For wing sections outboard of the alula, the leading-edge vortex sheet is pinned back to the wing plane. Underneath, leading-edge and wing-tip streamlines wind around the core of an aft-tilted LEV (as identified by  $Q$). The LEV stems from the alula’s root and sweeps across the outer corner of the wing merging with the tip flow to form an apparent recirculatory tip vortex by the trailing edge of the wing. Figure 7 shows leading-edge streamlines (coloured black) outboard of the alula curling back to the wing plane only to be sucked into the core of the tip vortex before entering the wake. From figure 6(b), wing sections inboard of the alula’s tip remain topologically similar to that of the baseline wing as vortical flow takes the form of separated shear layers that blanket a separation region. However, the spanwise extent of the separation region is reduced. For the dual-opposing alula configuration (figure 6c), two LEV vortex systems span the outer edges of the left and right wing. In between these regions, lies a separation region of further reduced size in comparison to the single and baseline wing cases.
For insight into the strength of vortices, we consider sectional cuts of spanwise- and streamwise-oriented vorticity,  $\unicode[STIX]{x1D714}_{y}$ and
 $\unicode[STIX]{x1D714}_{x}$, respectively, in planes normal to the respective component of vorticity (figure 8). Accompanying these figures are plots comparing circulation distributions across the span and chord computed from the area integral of components of vorticity aligned in a particular direction. Spanwise-oriented circulation is computed from
 $+\unicode[STIX]{x1D714}_{y}$, and is labelled
 $\unicode[STIX]{x1D6E4}_{y}^{+}$. This is not to be confused with the total spanwise circulation,
 $\unicode[STIX]{x1D6E4}_{y}$, which will be discussed in the next subsection and used to interpret changes in sectional lift via the Kutta–Joukowski theorem. Streamwise-oriented circulation is computed from
 $-\unicode[STIX]{x1D714}_{x}$ at
 $y/b<0$ (left semispan of the wing) and is labelled
 $\unicode[STIX]{x1D6E4}_{x}^{-}$. The distribution of
 $\unicode[STIX]{x1D6E4}_{x}^{-}$ is represented using a wing-aligned coordinate system where
 $x^{\ast }/c=-1$ marks the leading edge of the wing, and,
 $x^{\ast }/c=0$ marks the trailing edge of the wing.
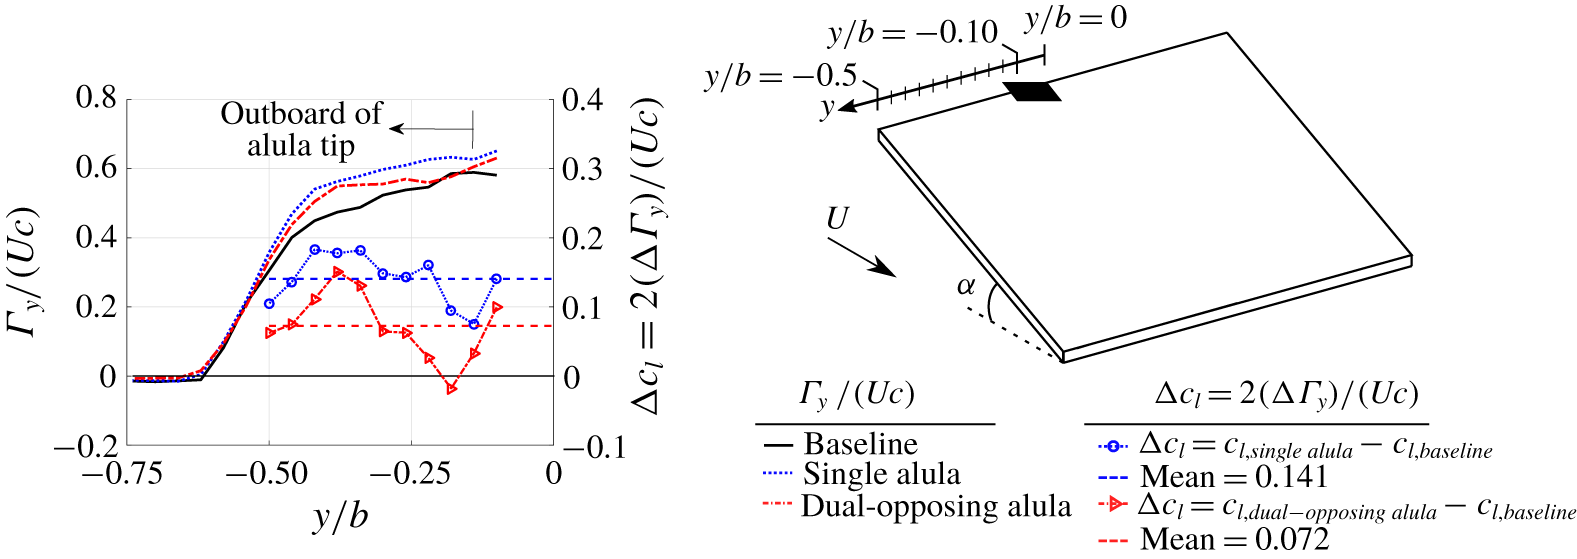
Cross-stream circulation and change in sectional wing lift for wing with a single and dual-opposing alula configuration relative to baseline plain wing. Depicted is total spanwise-oriented circulation,  $\unicode[STIX]{x1D6E4}_{y}$, as estimated via line integral of tangential velocity along a closed path in a
 $x{-}z$ data plane. Sectional lift is estimated from
 $\unicode[STIX]{x1D6E4}_{y}$ via Kutta–Joukowski theorem.

The aft-tilted LEV has components in the  $+\unicode[STIX]{x1D714}_{y}$ and
 $\mp \unicode[STIX]{x1D714}_{x}$ directions; the
 $\mp$ sign depending on if the alula is oriented to the left or right wing. Outboard of the alula
 $+\unicode[STIX]{x1D714}_{y}$ concentrates near the wing plane and lifts off as the wing tip is approached.
 $\unicode[STIX]{x1D714}_{x}$ comprising the LEV initiates as a surface layer (depicted as surface-layer vortex or ‘SLV’) and with increasing downstream distance shifts outboard amalgamating with the side-edge shear layer, of like sign, forming a near-circular tip vortex by the midchord of the wing. Stemming from the trailing edge of the alula lies a vortex, termed alula trailing-edge vortex or ATEV, that hugs the inner periphery of the LEV. This vortex is of opposite sign to the LEV containing vorticity of
 $-\unicode[STIX]{x1D714}_{y}$ and
 $\pm \unicode[STIX]{x1D714}_{x}$ direction; the
 $\pm$ sign depending on if the alula is oriented to the left or right wing. These results reflect the aft-tilted nature of vortices associated with the alula, i.e. the LEV and the ATEV. We will explain the tilting of these structures in § 4.2.
From the circulation distributions shown in figure 8, notable changes in spanwise and chordwise circulation distributions of the wing with an alula(e) are observed relative to the baseline wing. Spanwise stations harbouring an LEV experience a reduction in  $\unicode[STIX]{x1D6E4}_{y}^{+}$ which is approximately equal between the dual-opposing and single alula cases. The reduction in
 $\unicode[STIX]{x1D6E4}_{y}^{+}$ is accompanied by an increase in
 $\unicode[STIX]{x1D6E4}_{x}^{-}$ suggesting that the alula reorients spanwise vorticity generated at the wing’s leading edge into the streamwise direction.
In regard to chord-wise distributions of  $\unicode[STIX]{x1D6E4}_{x}^{-}$, the emergence and growth of the SLV associated with the aft-tilted LEV results in the rapid increase in
 $\unicode[STIX]{x1D6E4}_{x}^{-}$ which peaks around the chordwise location of
 $x^{\ast }/c=-0.75$. With increasing chordwise distance in the range
 $-0.75<x^{\ast }/c<-0.5$, the amalgamation of the surface-layer vortex and side-edge shear layer into the tip vortex results in a reduction in
 $\unicode[STIX]{x1D6E4}_{x}^{-}$ due to the contraction of these vortices. From
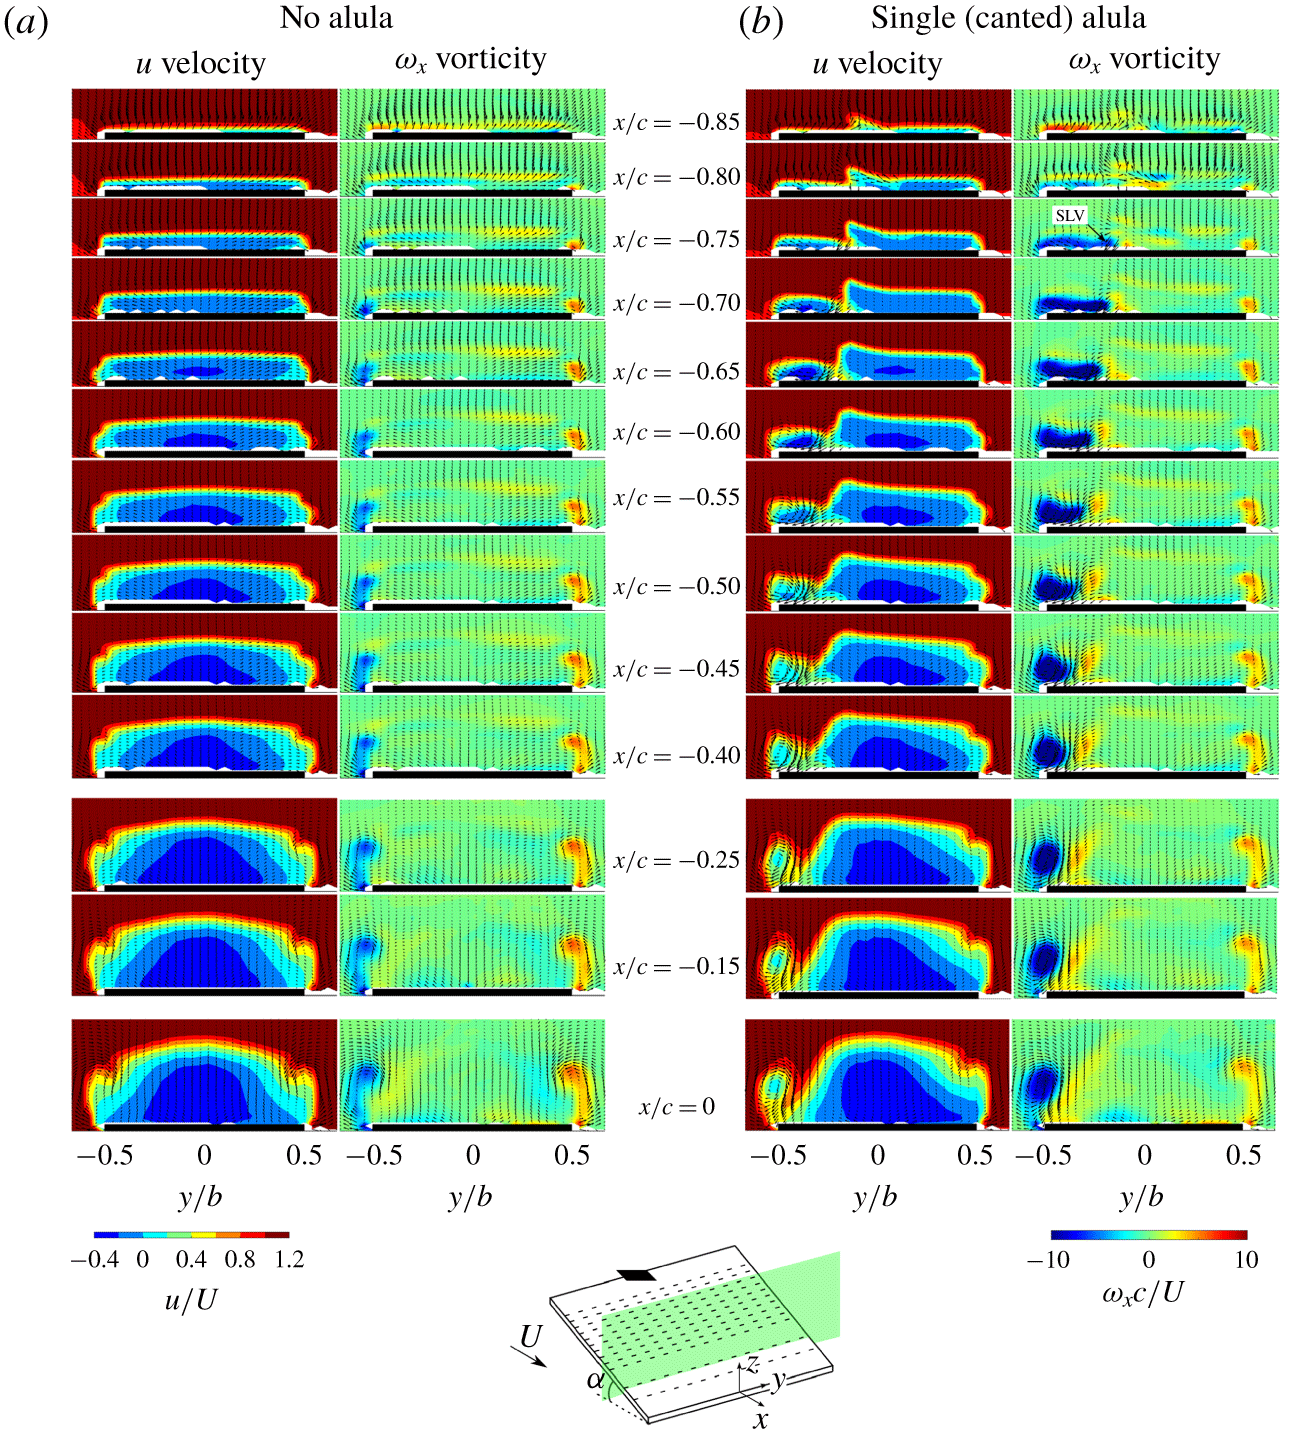
 $-0.5<x^{\ast }/c<0$ the tip vortex strengthens as it is continues to be fed by the side-edge shear layer. We refer to the interested reader to the figure 18 in appendix A which depicts the streamwise evolution of the SLV and its merging with the tip flow.
3.1 Influence on sectional wing lift
From the Kutta–Joukowski theorem, the change in sectional lift coefficient,  $\unicode[STIX]{x0394}c_{l}$, is related to total cross-stream circulation,
 $\unicode[STIX]{x1D6E4}_{y}$, through the expression
 $\unicode[STIX]{x0394}c_{l}=2(\unicode[STIX]{x0394}\unicode[STIX]{x1D6E4}_{y})/(Uc)$. Here,
 $\unicode[STIX]{x0394}\{\cdot \}=\{\cdot \}_{alula\,case}-\{\cdot \}_{baseline\,case}$.
 $\unicode[STIX]{x1D6E4}_{y}$ is estimated by integrating tangential velocity along a rectangular contour path that encloses the wing and separation region. We refer the reader to § 2 for further details of this calculation.
Figure 9 displays cross-stream circulation distributions and corresponding estimates of the change in sectional lift coefficient,  $\unicode[STIX]{x0394}c_{l}$, for the wing with an alula relative to the baseline (plain) wing. Results are shown for both the single and dual-opposing alula test cases. In general, we observe sectional lift to be increased at spanwise stations outboard of the alula most notably near the wing tips. This indicates that the alula-stabilized vortex system induced on this portion of the wing contributes to enhanced wing lift. We further observe the mean change in sectional lift coefficient on this portion of the wing to be higher for the single alula case than the dual-opposing alula case. These results are consistent with the tip vortex circulation measurements of figure 8 which shows the strength of the tip vortex by the trailing edge of the wing,
 $x^{\ast }=0$, to be weaker for the dual-opposing alula case than the single alula case. Here, a weaker tip vortex induces less downwash in the wake thereby reducing cross-stream circulation and thus sectional wing lift. We speculate the weaker tip vortex (in this time-averaged sense) on the wing with the dual-opposing alula to be the consequence of an increase in near-wake unsteadiness arising from a cooperative instability in the alula-strengthened tip vortex pair. However, further research is necessary to resolve this.
4 LEV formation and maintenance
We now investigate the mechanisms that enable the alula to induce and stabilize the observed attached vortex system. We start by considering the flow at spanwise stations in the vicinity of the alula to grant insight into the alula’s interaction with the leading-edge flow and the formation of the LEV and oppositely signed ATEV. A topological map is constructed to assist the discussion. Then we explain the mechanisms that drive the LEV to both tilt aft and smoothly merge with the tip flow. We then consider a series of tests performed at a higher angle of attack for which the effectiveness of the alula is hindered, and use our newfound knowledge of the aerodynamic mechanisms of the alula to modify the alula in an attempt to restore its effectiveness at this high angle of attack condition.
4.1 Topological description of LEV roll-up via alula
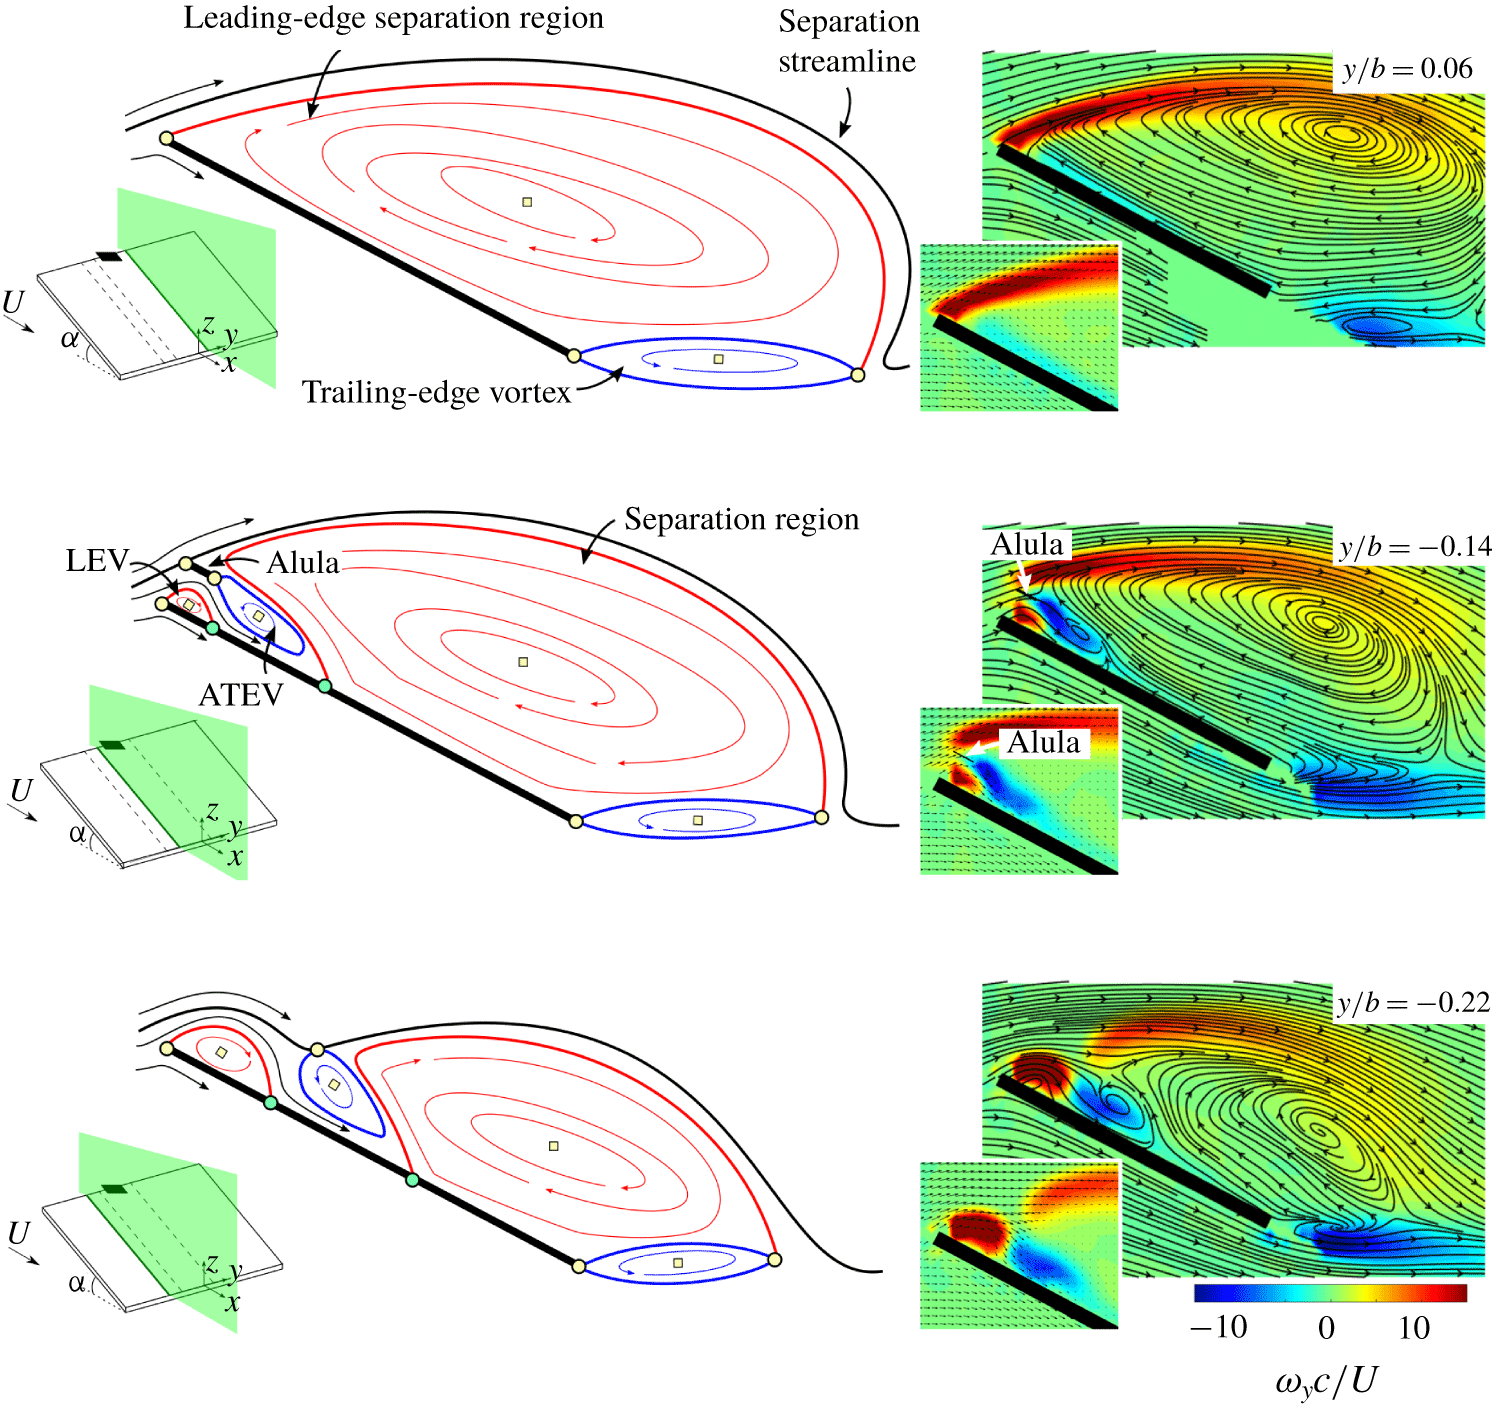
We consider the case of the wing with a single alula and analyse mean streamline patterns and spanwise vorticity contours in chordwise planes in the immediate vicinity of the alula (figure 10). To assist the discussion, topological maps are created which have been previously used by the authors to describe the mean midplane vortex structure on low- $A$ wings at high incidences (DeVoria & Mohseni Reference DeVoria and Mohseni2017). Similar topological analyses have been performed to describe unsteady LEV formation, detachment and boundary-layer eruption (Rival et al. Reference Rival, Kriegseis, Schuab, Widmann and Tropea2014; Widmann & Tropea Reference Widmann and Tropea2015) and transitional vortex shedding on an airfoil (Lipinski, Cardwell & Mohseni Reference Lipinski, Cardwell and Mohseni2008).
From Hunt et al. (Reference Hunt, Abell, Peterka and Woo1978), mean streamline patterns in a two-dimensional plane section of a two- or three-dimensional flow possess singular points that satisfy the following topological constraint,
 $$\begin{eqnarray}\left(\sum N+{\textstyle \frac{1}{2}}\sum N^{\prime }\right)-\left(\sum S+{\textstyle \frac{1}{2}}\sum S^{\prime }\right)=1-n,\end{eqnarray}$$
where  $S$ and
 $S^{\prime }$ are full- and half-saddles,
 $N$ and
 $N^{\prime }$ are full- and half-nodes and
 $n$ is the connectivity of the plane;
 $n=3$ when the wing and alula are considered and
 $n=2$ when only the wing is considered.
Topological description of the time-averaged flow over a wing with a single alula in streamwise planes at spanwise locations as indicated. Full nodes and saddles are depicted by yellow squares and circles, respectively. Half-saddle points are depicted by cyan circles. Measured streamline patterns and spanwise vorticity contours are included on the right. Insets display measured velocity vectors near leading edge of the wing.

We start by considering a plane of data,  $y/b=0.06$, located near the alula’s root on the wing section opposite that for which the alula is overhung. Spanwise vorticity is organized into a shear layer stemming from the leading edge of the wing which envelops a leading-edge separation region (LESR) that is comprised of clockwise swirl. A trailing-edge vortex is also apparent which is comprised of anti-clockwise swirl.
The flow features in this measurement plane appear topologically identical to the mean midplane streamline patterns of DeVoria & Mohseni (Reference DeVoria and Mohseni2017) obtained on steadily translating low-aspect-ratio wings. Therefore, we adopt a similar topological framework, which is briefly recounted. DeVoria & Mohseni (Reference DeVoria and Mohseni2017) likened the topology of this flow to that of a vortex pair with additional half-saddles added to account for physical separations. The vortex pair possesses two full saddles at the fore and aft stagnation points and two nodes consisting of clockwise and anticlockwise swirl. When the body streamline is mapped to the flat-plate wing, the two nodes cancel and the saddles reduce to half-saddles to be consistent with (4.1). These half-saddles are stationed at the leading and trailing edges of the plate which is consistent with the attached-flow condition modelled by Rival et al. (Reference Rival, Kriegseis, Schuab, Widmann and Tropea2014). Opposite-signed re-circulatory regions can be thought of as confined to thin boundary layers formed on each side of the plate. Now, the addition of a separation region to the plate introduces two additional half-saddles at its forward and aft stagnation points and a full node constituting an internal region of clockwise swirl. This recirculatory region has an image system, consisting of a full node with anticlockwise swirl, that lies in the plate. In the case of the LESR, as is depicted here, the forward stagnation points of the plate and separation region merge to form a full saddle at the plate’s leading edge. Furthermore, when the rear stagnation point (half-saddle) of the LESR passes the half-saddle at the trailing edge of the wing, the half-saddles merge to form a full saddle that enters the fluid. Unlike during unsteady LEV detachment as treated by Rival et al. (Reference Rival, Kriegseis, Schuab, Widmann and Tropea2014), flow does not immediately turn around the trailing edge of the wing but follows the path of streamlines that envelope an apparent recirculatory trailing-edge vortex. To model this, the full node, lying initially in the wing and consisting of anticlockwise swirl, enters the fluid through the trailing-edge singularity. One can think of this trailing-edge vortex as constituting ‘excess’ LESR image vorticity leaked into the flow. The emergence of this feature signals lift stall (DeVoria & Mohseni Reference DeVoria and Mohseni2017). Additional half-saddles are placed on the plate to represent the separation and reattachment points associated with this swirl region. Widmann & Tropea (Reference Widmann and Tropea2015) used a similar representation of fixed points at the trailing-edge of the plate in their treatment of unsteady LEV detachment. The difference is that in the current flow, separation/reattachment points associated with the trailing-edge swirl region appear to coincide with the plates trailing edge. Therefore, the corresponding half-saddles merge to form a full saddle there. Collectively, the time-averaged flow over a thin plate harbouring a LESR whose rear stagnation point passes the plate’s trailing edge can be modelled with two full nodes to represent the counter-rotating regions associated with the LESR and the trailing-edge vortex, and three full saddles placed at the leading edge and trailing edge of the plate as well as at the rear stagnation point of the LESR. This topology is depicted in the top schematic of figure 10.
The organization of vorticity on wing sections outboard of the alula differs from that on the adjacent wing section. The first plane considered ( $y/b=-0.14$) is located immediately outboard of the alula, a distance
 $0.004b$ away from the alula’s tip. The projection of the alula’s tip on the contour plot of spanwise vorticity is as indicated. We observe the leading-edge shear layer to stem from the leading edge of the alula as opposed to the leading edge of the wing. Two additional vortices are introduced into the flow, the LEV and the ATEV, comprised of clockwise and anti-clockwise swirl. The LEV stems from the wing’s leading edge where the ATEV stems from the alula’s trailing edge. Underneath the ATEV, lies high-magnitude flow near the surface of the wing as indicated by the magnitude of time-averaged velocity vectors there. This flow penetrates the separation region terminating at an apparent stagnation point as indicated by streamline patterns.
Streamlines in this plane of data are used to assist a topological description of the flow in a plane that slices through the alula and wing at a spanwise location coincident with the alula’s wing tip. The topological description of this flow is explained as follows. With two bodies present in the flow,  $n=3$ in (4.1). Underneath the alula, a separation region consisting of clockwise swirl (designated LEV) is formed. Consistent with previous modelling of separation regions, a half-saddle is placed at its fore and aft stagnation points. However, as the forward stagnation point is coincident with the stagnation point at the plate’s leading edge these half-saddles merge to form a full saddle there. Aft of the LEV lies a anti-clockwise recirculating region (designated ATEV) whose enveloping streamline appears to originate and subsequently terminate at the alula’s trailing edge, hence half-saddles modelling these stagnation points merge to form a full saddle there. The LESR is relabelled ‘separation region’ as this clockwise recirculating region no longer stems from the base plate’s leading edge. Rather the half-saddle constituting its forward stagnation point lies aft of the ALEV at approximately the
 $0.4c$ location. The fixed points in the rear of the base plate remain topologically similar to that which occurs at
 $y/b=0.06$, however, the anti-clockwise swirl region or trailing-edge vortex is of reduced size. We are left to determine the type of saddle point located at the alula plate’s leading edge. In order to satisfy (4.1), this point must be a full saddle.
Lastly, we consider a plane of data outboard of the alula’s tip at  $y/b=-0.22$. The aft stagnation point of the LEV and the forward stagnation point of the separation region both move rearward, causing the enlargement of the LEV region and the shrinking of the separation region. In between, the ATEV, released from the alula, is suspended by a full saddle point. Fixed points at the trailing edge of the plate remain undisturbed except for an apparent shrinking of the trailing-edge vortex region. Curved streamlines associated with the enlarged LEV and reduced separation region suggest enhanced lift generation at spanwise stations outboard of the alula. This is consistent with the lift estimates of figure 9.
This analysis lends itself to the following interpretation of the formation of the LEV and ATEV. The no-flow-through condition imposed by the alula, or the image vortex in the alula, steers separated leading-edge flow back to the wing plane. Shear produced from the penetration of this high-magnitude flow into the separation region results in the formation of the ATEV. The LEV forms from the accumulation of spanwise vorticity generated at the wing’s leading edge which is subsequently ‘trapped’ by the oppositely signed ATEV. While this pairing of the LEV and ATEV may assist in regulating LEV growth through vorticity annihilation, it is unlikely that two-dimensional mechanisms alone are responsible for the attached LEV. As is discussed next, LEV growth appears to be regulated by vortex tilting and outboard vorticity flux.
4.2 On the aft tilting of the LEV and outboard vorticity flux
This subsection starts by describing how spanwise vorticity, steered back toward the wing plane by the alula, is subsequently tilted aft to form the SLV as observed in figure 8. This subsection ends by explaining the amalgamation of the SLV and side-edge shear layer into the tip vortex through an analysis of outboard vorticity flux.
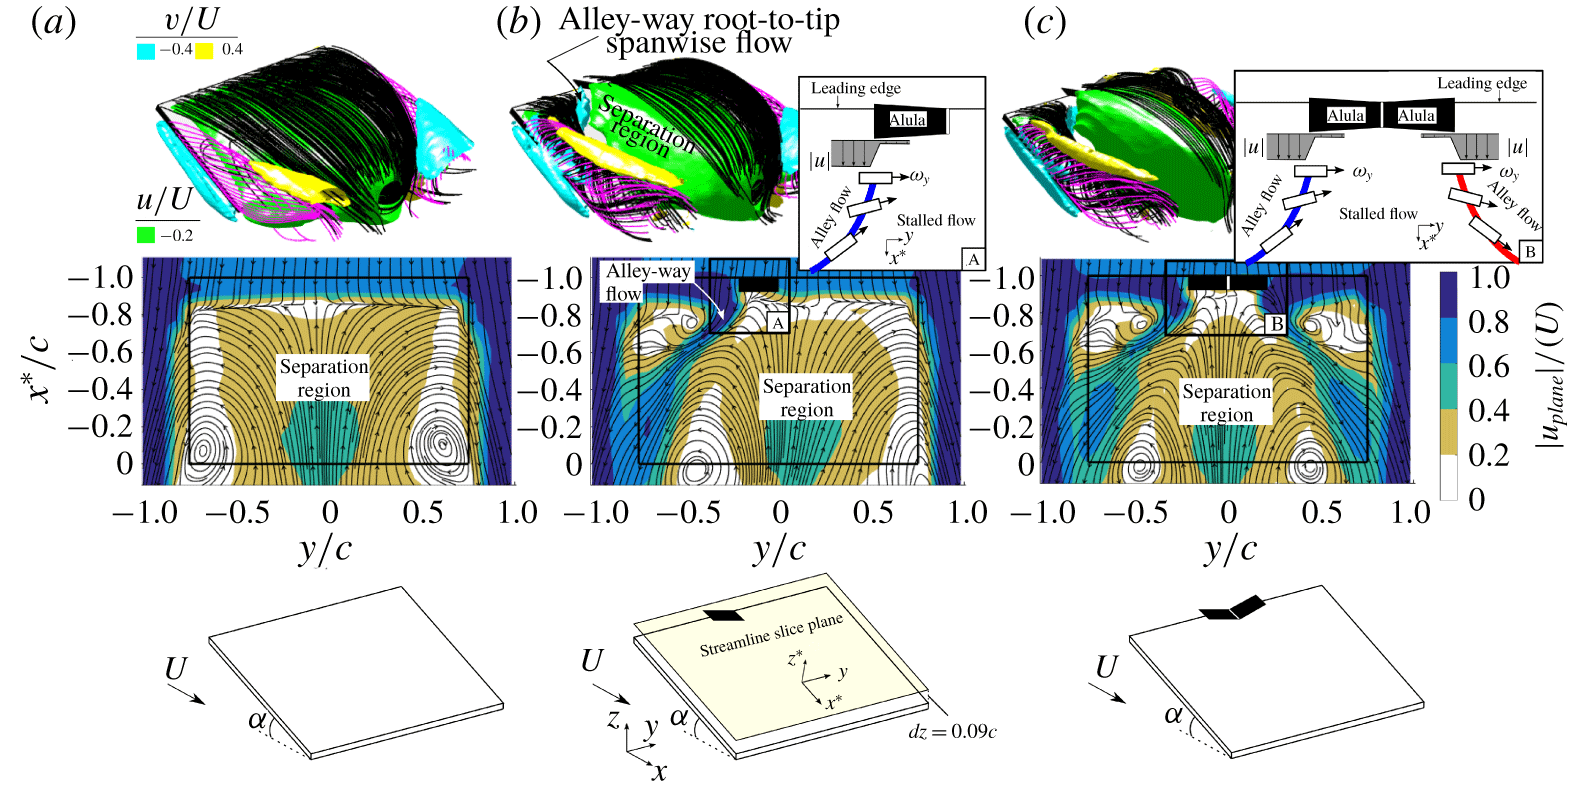
We start by analysing near-surface streamline patterns and in-plane non-dimensional velocity magnitude contours in a plane parallel to the wing located a vertical distance  $dz=0.09c$ from its top surface (figure 11). Isometric views depicting three-dimensional streamline patterns and isosurfaces of the spanwise and streamwise-oriented velocity are also included for the readers convenience.
The three-dimensional and near-surface representation of the flow outboard of the alula (figure 11b) reveal a spanwise jet directed outboard toward the wing tip. From the near-surface velocity contour plot, the in-plane velocity magnitude of this jet is  ${>}80\,\%$ that of the free-stream velocity and lies in an alley between two stagnation regions: one associated with the LEV which exists near the corner of the wing, and the other associated with the separation region which lies inboard of the alula’s tip. An alternative depiction of this flow is given in figure 17 in appendix A. Here, the jet takes the form of a vertical column, or wall jet, stationed aft of the LEV which tilts in the downstream direction and flattens out as the wing tip is approached.
Time-averaged velocity isosurfaces for wing affixed with no alula (a), single alula (b) and dual-opposing alulae (c). The two-dimensional figures plot near-surface streamline patterns obtained at a vertical distance  $dz=0.09c$ from the top surface of the wing. Overlaid in these figures are contours of time-averaged in-plane velocity magnitude. Inset schematics depict the aft tilting of spanwise-oriented vorticity associated with boxed regions labelled A and B.

The existence of this wall jet, or ‘alley flow’, adjacent to a stagnation region (associated with the separation region) results in a spanwise gradient in velocity magnitude. As depicted in the schematics in figure 11(b), a spanwise-aligned vortex element  $+\unicode[STIX]{x1D714}_{y}$, generated at the wing’s leading edge and steered back to the wing plane by the alula, tilts aft when confronted with this gradient. The tilting of
 $+\unicode[STIX]{x1D714}_{y}$ on a leftward-oriented alula contributes to the production of
 $-\unicode[STIX]{x1D714}_{x}$ while the tilting of a rightward-oriented alula contributes to the production of
 $+\unicode[STIX]{x1D714}_{x}$. This is precisely the sign of vorticity constituting the SLV as was observed in figure 8(b).
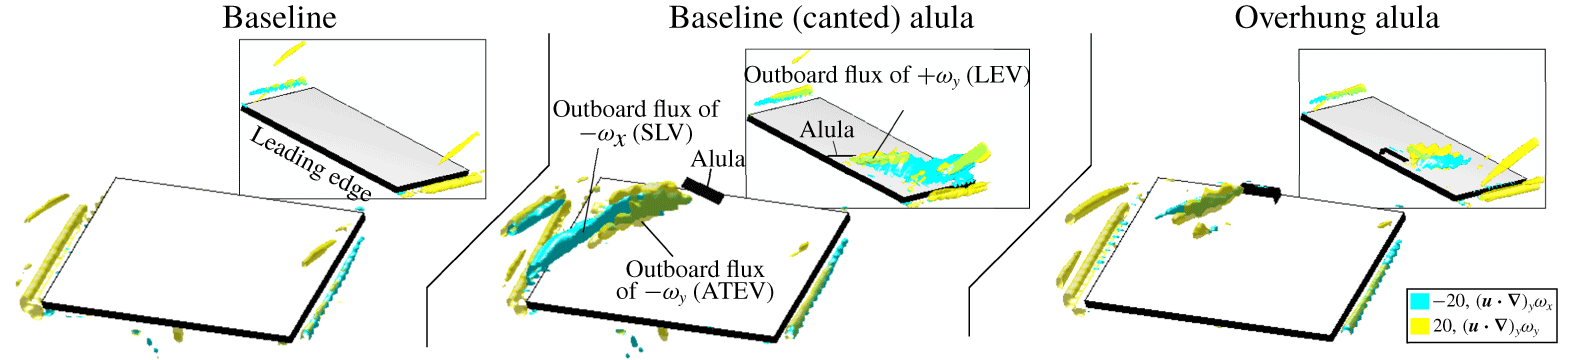
Having explained the tilting of the LEV, next we investigate the mechanism that enables its merging with the tip flow. A logical candidate is outboard vorticity flux associated with alula-induced root-to-tip spanwise flow generation. Figure 12 plots isosurfaces of  $(\boldsymbol{u}\boldsymbol{\cdot }\unicode[STIX]{x1D735})_{y}\unicode[STIX]{x1D714}_{x}=-20$ and
 $(\boldsymbol{u}\boldsymbol{\cdot }\unicode[STIX]{x1D735})_{y}\unicode[STIX]{x1D714}_{y}=20$ for the wing with a single canted alula in comparison to the baseline wing (the case of the overhung alula will be explained in the next subsection). On the wing with the canted alula, we observe an outboard flux of
 $+\unicode[STIX]{x1D714}_{y}$ and
 $-\unicode[STIX]{x1D714}_{y}$ which is associated with the transport of the non-tilted components of the LEV and ATEV, respectively. However, this flux of vorticity is not sustained across the whole wing tip. In contrast, we observe an outboard flux of
 $-\unicode[STIX]{x1D714}_{x}$ that is sustained across the outer wing sections. The sustained outboard flux of
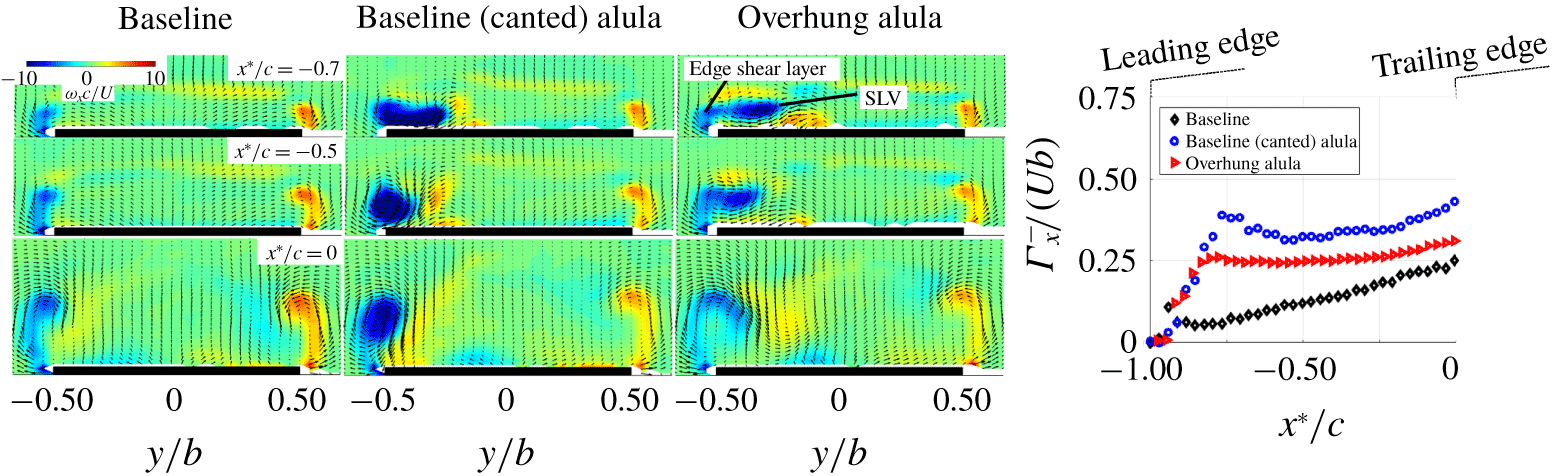
 $-\unicode[STIX]{x1D714}_{x}$ for the baseline (canted) alula drives the amalgamation of the SLV and the like-signed side-edge shear layer into a recirculatory tip vortex. The amalgamation process is best observed when analysing streamwise vorticity contours at select chordwise stations along the wing as is shown in figure 13. For the baseline (canted) alula case, we observe the formation of a nearly circular tip vortex by the midchord of the wing.
The results presented in this subsection underscore the role of three-dimensional vorticity transport mechanisms (i.e. vortex tilting and outboard vorticity flux) in enabling the smooth merging of leading- and side-edge vortex flows and, in consequence, the attached LEV. Driving both vortex tilting and outboard vorticity flux is the aft-located wall jet of spanwise flow sustained by the alula. Spanwise vorticity comprising the LEV confronts this wall jet and is tilted aft while being subsequently evacuated toward the wing tip. The tilted LEV, or SLV, is of like sign to the side-edge shear layer to which it is directed which likely facilitates the merging of these vortices.
4.3 On high-magnitude spanwise flow generation
We explained the role of spanwise flow in facilitating the smooth merging of leading- and side-edge vortex flows. Still unclear is how the alula produces this flow. A starting point is to consider the orientation of the alula. The fact that the alula is canted and affixed to an inclined wing means that a component of the free stream is directed tangent to the alula. The tangential flow component is given as  $U\sin \unicode[STIX]{x1D6FC}\cos \unicode[STIX]{x1D719}$ where
 $U$ is the free-stream velocity,
 $\unicode[STIX]{x1D6FC}$ is the angle of attack, and
 $\unicode[STIX]{x1D719}$ is the alula’s cant angle. For the test conditions considered, the free-stream flow directed tangent to the alula is
 $0.18U$; a value substantially weaker than the spanwise velocity magnitudes measured which reach magnitudes
 ${>}0.80U$.
Outboard convective flux of spanwise and streamwise vorticity shown by isosurfaces of  $(\boldsymbol{u}\boldsymbol{\cdot }\unicode[STIX]{x1D735})_{y}\unicode[STIX]{x1D714}_{y}$ and
 $(\boldsymbol{u}\boldsymbol{\cdot }\unicode[STIX]{x1D735})_{y}\unicode[STIX]{x1D714}_{x}$ on baseline wing, wing with single canted alula and wing with single overhung alula.

Time-averaged streamwise vorticity contours and velocity vectors in cross-stream planes at select chordwise locations. The plot on the right depicts the chordwise circulation distribution of the wing computed via area integral of  $-\unicode[STIX]{x1D714}_{x}$ in the flow, specifically that which is located above the wing plane on the left semispan.

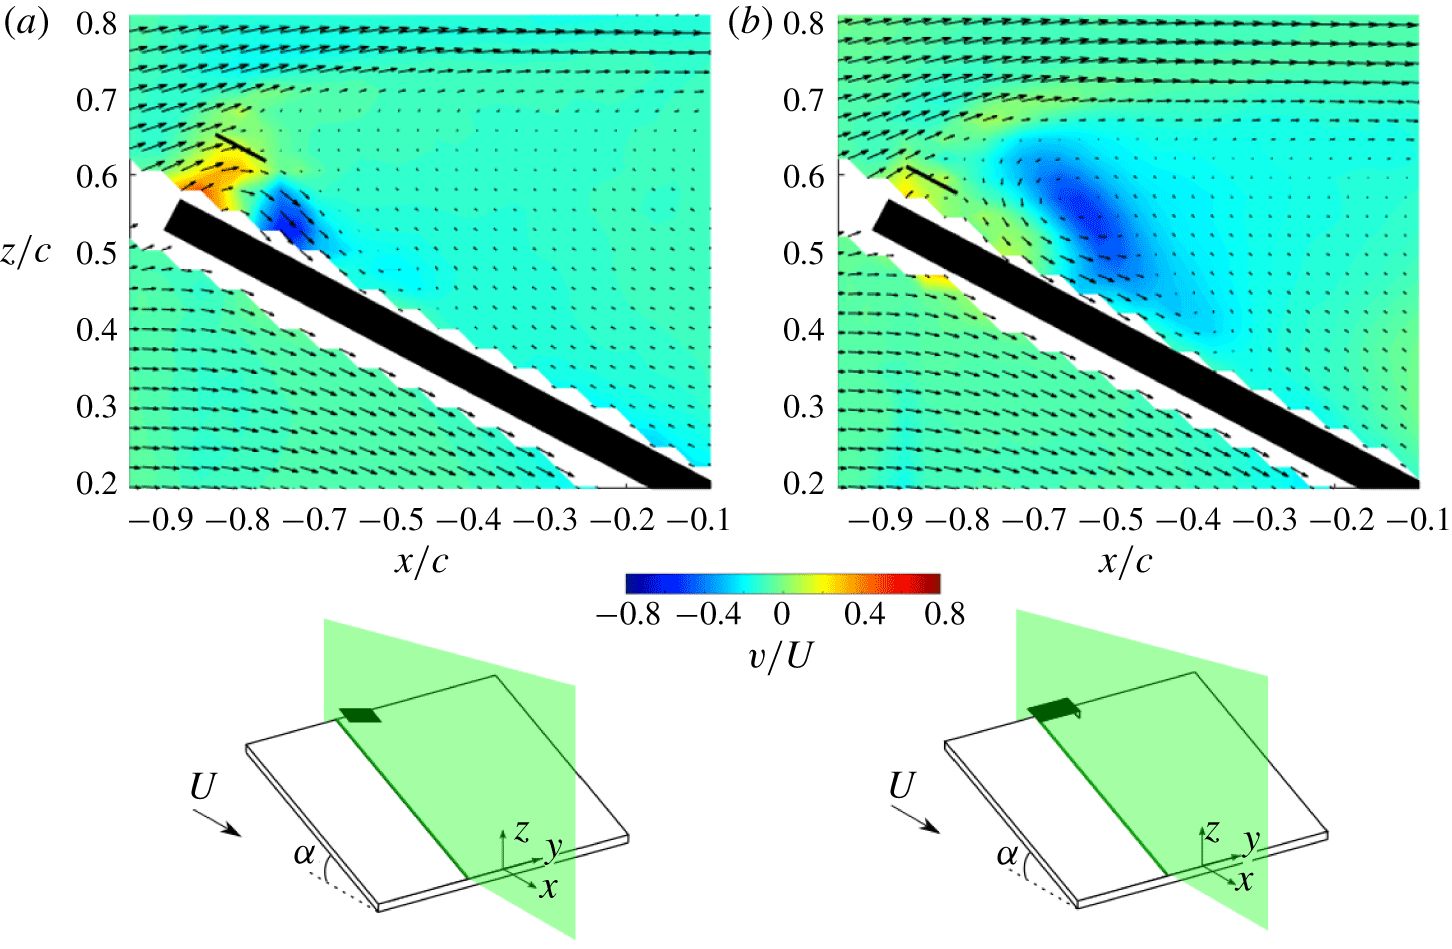
To assist this investigation, we introduce figure 14 which plots spanwise velocity contours in streamwise planes at  $y/b=-0.14$, a plane located immediately outboard of the alula. The projection of the alula’s tip on this plane is plotted for reference. From figure 14(a), we observe an influx of spanwise flow at chordwise stations upstream of the alula’s trailing edge and an outboard flux of spanwise flow at chordwise stations downstream of the alula’s trailing edge. The inflow and outflow has a maximum spanwise velocity magnitude of
 $0.50U$ and
 $0.60U$, respectively. This organization of spanwise flow suggests that a region of clockwise swirl is established underneath the canted alula (when viewed from the top of the alula). Here, a fluid element stemming from the leading edge of the wing in the vicinity of the alula is first directed toward the alula’s root and, upon confronting it, is turned and subsequently ejected outboard toward the wing tip. We hypothesize this flow to be sustained by a spanwise pressure gradient associated with the canted alula. Here, the pressure gradient is the result of the contraction (and subsequent acceleration) experienced by spanwise flow directed toward the alula’s root. We tested a modified alula which has no cant angle to corroborate this hypothesis. As opposed to being canted, the modified alula is overhung such as to form a small gap between its bottom surface and the wing’s top surface. The gap between the ‘overhung alula’ was set so that its frontal area was equal to that of the baseline (canted) alula. Moreover, the span of the overhung alula was kept the same as the projected span of the canted alula.
Spanwise flow contours for the overhung alula are shown in figure 14(b). The high magnitudes of inflow measured on the baseline (canted) alula are not observed on the overhung alula. Moreover, the outflow, or root-to-tip spanwise flow, produced by the overhung alula is weaker, more diffuse and is displaced further aft of the trailing edge of the alula in comparison to that which is observed on the baseline (canted) alula. This comparison suggests that high-magnitude root-to-tip flow is tied to the cant angle of the alula. However, further research is necessary to resolve this connection.
Spanwise velocity contours in streamwise plane stationed at  $y/b=-0.14$ for wing affixed with baseline (canted) alula (a) and overhung alula (b).

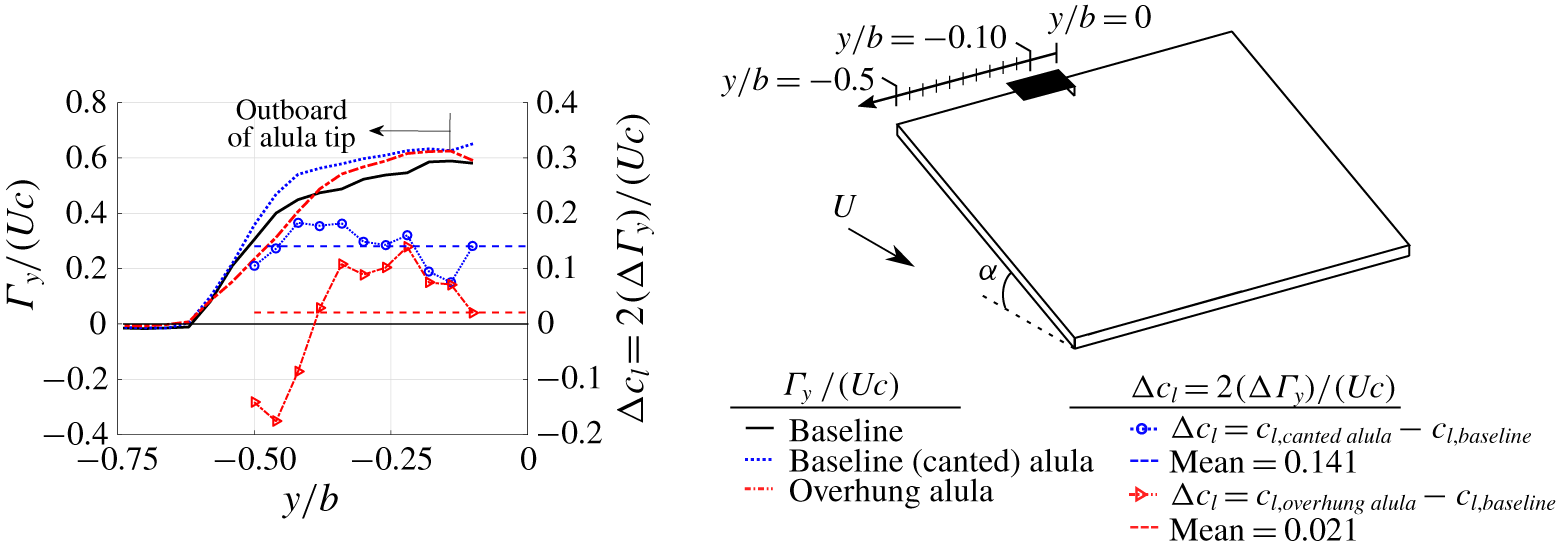
Cross-stream circulation and change in sectional wing lift for wing with a canted alula and an overhung alula relative to baseline plain wing. Depicted is total spanwise-oriented circulation,  $\unicode[STIX]{x1D6E4}_{y}$, as estimated via line integral of tangential velocity along a closed path in a
 $x{-}z$ data plane. Sectional lift is estimated from
 $\unicode[STIX]{x1D6E4}_{y}$ via Kutta–Joukowski theorem.

The consequence of reduced spanwise flow generation on the alula-induced vortex system is clear when comparing outboard vorticity flux (figure 12) and tip vortex strength (figure 13) measured on the wing with the overhung alula compared to that of the baseline (canted) alula. From figure 12, the overhung alula, with reduced spanwise flow generation sees outboard vorticity flux localized near the alula. Without sustained vorticity flux toward the wing tip, the amalgamation process of the aft-tilted LEV, or SLV, with the edge shear layer is hindered resulting in a weaker and more diffuse tip vortex as is observed in figure 13.
Figure 15 shows the consequence of reduced spanwise flow generation via overhung alula on the lift benefit of the alula. Depicted in this figure is the change in sectional lift coefficient,  $\unicode[STIX]{x0394}c_{l}$, for the wing with the overhung alula relative to the baseline plain wing. Results of the canted alula are also shown alongside corresponding cross-stream circulation distributions,
 $\unicode[STIX]{x1D6E4}_{y}$, for each test case. In comparing mean values of the sectional lift coefficient between the overhung and canted alula test cases, we observe a near complete elimination of the lift benefit of the alula on this portion of the wing when the alula is overhung as opposed to canted. An explanation for negative values in the change in sectional lift for the overhung alula occurring near the wing tip can be obtained upon analysing the relative magnitude of downwash (or downward induced velocity) near the wing tip as interpreted from velocity field measurements at
 $x^{\ast }/c=0$ in figure 13. At the three spanwise stations nearest to the wing tip,
 $-0.5\leqslant y/b\leqslant -0.42$, downwash appears stronger on the baseline (plain) wing than the overhung alula which suggests that the baseline (plain) wing experiences more cross-stream circulation and thus sectional lift in this region than that on the wing with the overhung alula. Reduced downwash near the wing tip for the wing with the overhung alula is the consequence of a more diffuse and inward-located tip vortex resulting from reduced spanwise flow generation. In summary, the results of this subsection emphasize the importance of spanwise flow on the stability of the vortex system exhibited by the wing with the alula and the apparent importance of the alula’s cant angle in producing this flow.
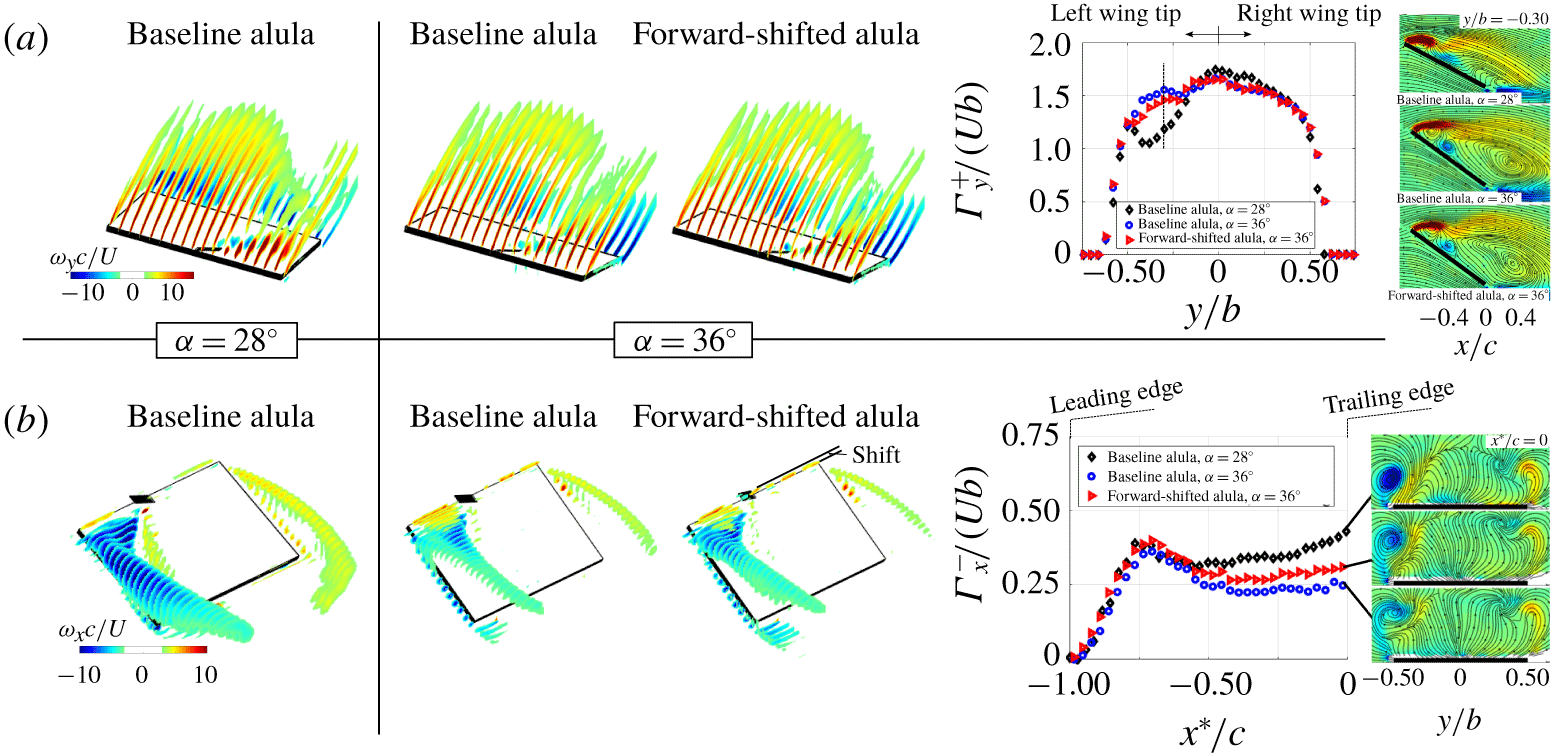
Contour slices of time-averaged non-dimensional (a) spanwise and (b) streamwise vorticity for the wing affixed with a single alula (baseline) and an alula that is shifted forward a distance one half the chord length of the alula. Angles of attack as marked. Plots depict corresponding circulation distributions across the span and chord respectively.  $\unicode[STIX]{x1D6E4}_{y}^{+}$ is computed via area integral of
 $+\unicode[STIX]{x1D714}_{y}$ in the flow.
 $\unicode[STIX]{x1D6E4}_{x}^{-}$ is computed via area integral of
 $-\unicode[STIX]{x1D714}_{x}$ in the flow, specifically that which is located above the wing plane on the left semispan. Contour plots at select spanwise and chordwise locations are also indicated.

4.4 Shadowing of the alula at high angles of attack
At the start of this section, we connected LEV formation to the alula’s ability to steer spanwise vorticity generated at the wing’s leading edge back to the wing plane. We showed this to manifest itself in distribution plots of spanwise circulation as a reduction in  $\unicode[STIX]{x1D6E4}_{y}^{+}$ relative to the baseline wing with no alula. Recall, the reduction in
 $\unicode[STIX]{x1D6E4}_{y}^{+}$ was associated with spanwise vorticity in the LEV being reoriented and evacuated toward the wing tip via vortex tilting and outboard vorticity flux. The force measurements and oil visualizations of Linehan & Mohseni (Reference Linehan and Mohseni2019) (recall figure 2) showed the alula to be ineffective if the angle of attack of the wing is too high. This suggests that the LEV formation and stabilization processes are hindered in some way. To elucidate this feature, we conducted experiments at a higher angle of attack,
 $\unicode[STIX]{x1D6FC}=36^{\circ }$. Spanwise and streamwise vorticity contours are compared in figure 16 between the two angles of attack considered. Also plotted are corresponding spanwise- and chordwise-circulation distributions.
At spanwise stations outboard of the alula, we observe in increase in  $\unicode[STIX]{x1D6E4}_{y}^{+}$ at the higher angle of attack. Contour plots of spanwise vorticity at
 $y/b=-0.3$ reveal this vorticity to be more approximately organized into a leading-edge shear layer at the higher angle of attack as opposed to the concentrated LEV observed at the lower angle of attack. This inability to steer leading-edge vorticity back toward the wing plane to induce a recirculatory LEV means that vortex tilting and outboard vorticity flux via spanwise flow cannot take effect. The consequence is the downstream shedding of spanwise vortices into the wake manifesting itself as the diffuse shear layer observed the in-time-averaged measurements. Moreover, with less spanwise vorticity being tilted, less streamwise vorticity is introduced into the flow which explains the weaker and more diffuse tip vortex as is observed at the wing’s trailing edge of the wing,
 $x^{\ast }/c=0$, at the higher incidence angle.
We hypothesize that one of the reasons why the alula is less effective at the higher angle of attack is due to the alula being shadowed behind the inclined wing. Because of this shadowing, the critical shear layer–alula interaction necessary to steer the separated boundary layer back to the wing plane to induce LEV roll-up is hindered. In an attempt to restore the alula’s effectiveness at this higher angle of attack, we consider an identical alula that is shifted forward on the wing a distance one-half the chord length of the alula. Figure 16 includes contour plots of the forward-shifted alula with circulation measurements also plotted. Relative to the baseline alula case at the same angle of attack, we observe a reduction in  $\unicode[STIX]{x1D6E4}_{y}^{+}$ on the outboard wing stations and subsequent increase in
 $\unicode[STIX]{x1D6E4}_{x}^{-}$ on the aft portion of the wing; results that suggest that the forward-shifted alula, being less shadowed behind the wing, is more effective at steering leading-edge vorticity back to the wing plane and subsequently tilting and evacuating this flow toward the wing tip and thus strengthening the tip vortex. These results underscore the importance of the alula’s streamwise location relative to the separated wing boundary layer in its ability to induce LEV roll-up.
5 Concluding remarks
Based on the results described in this manuscript, we put forth the following explanation of the alula’s maintenance of an attached leading-edge vortex on an otherwise stalled wing in steady translation. The attached LEV is the consequence of the alula’s ability to smoothly merge otherwise separated leading and side-edge vortical flows on the finite wing. The alula accomplishes this by steering the leading-edge shear layer back to the wing plane and subjecting this flow to an aft-located wall jet of high-magnitude root-to-tip spanwise flow. The former feature induces LEV roll-up while the latter feature tilts LEV vorticity aft and evacuates this flow toward the wing tip via an outboard vorticity flux. Experiments using modified alula models further uphold this explanation showing the hindrance of vortex steering, via the alula being shadowed behind the inclined wing, and the hindrance of high-magnitude root-to-tip spanwise flow generation, via elimination of the alula’s cant angle, to each contribute to a weakened and more diffuse tip vortex in the time-averaged sense.
The unique construction of the alula, which mimics an outboard canted leading-edge flap, thus appears to possess the necessary ingredients to form and maintain an attached LEV on a steadily translating unswept wing that is inclined to the flow at post-stall angles. This capability of the alula likely enables birds to maintain a spread-wing gliding posture to facilitate airbraking while enjoying enhanced wing lift via LEV flow to slow descent and adjust attitude. Additional work is necessary to resolve the viability of an alula-inspired control effector for aircraft applications; although the need for such a device is apparent. Stealth aircraft require high-lift technologies with low observability whereas micro-aerial-vehicles require control effectors that are lightweight. The size of the alula, which in this study occupies an area 1 % that of the wing, makes an alula-inspired technology an attractive pain reliever for these applications. However, key details such as the effects of manoeuvring flight, wing sweep, wing airfoil geometry, Reynolds number, among others on the observed alula-induced vortex system still need to be resolved.
Acknowledgements
The authors thank Dr A. DeVoria for the many fruitful discussions regarding this work. The authors also thank the anonymous reviewers whose comments and suggestions greatly improved the quality and clarity of the manuscript. The authors lastly acknowledge the partial financial support of the National Science Foundation (NSF) and the Office of Navy Research (ONR). This work is related to the following patent: ‘Sliding, canted, control surfaces for control augmentation of lifting surfaces at high angles of attack’, US Provisional Pat. Ser. No. 62/783 698, filed 12/21/2018 (utility patent submitted).
Declaration of interests
The authors report no conflict of interest.
Appendix A. Supplemental representations of three-dimensional time-averaged post-stall flow
The main text contains an analysis of the measured data which contributes to conclusions of the manuscript. However, researchers studying a similar problem may be interested in additional planar representations of the three-dimensional flow as is given here.
A.1 Contour plots of spanwise components of velocity and vorticity
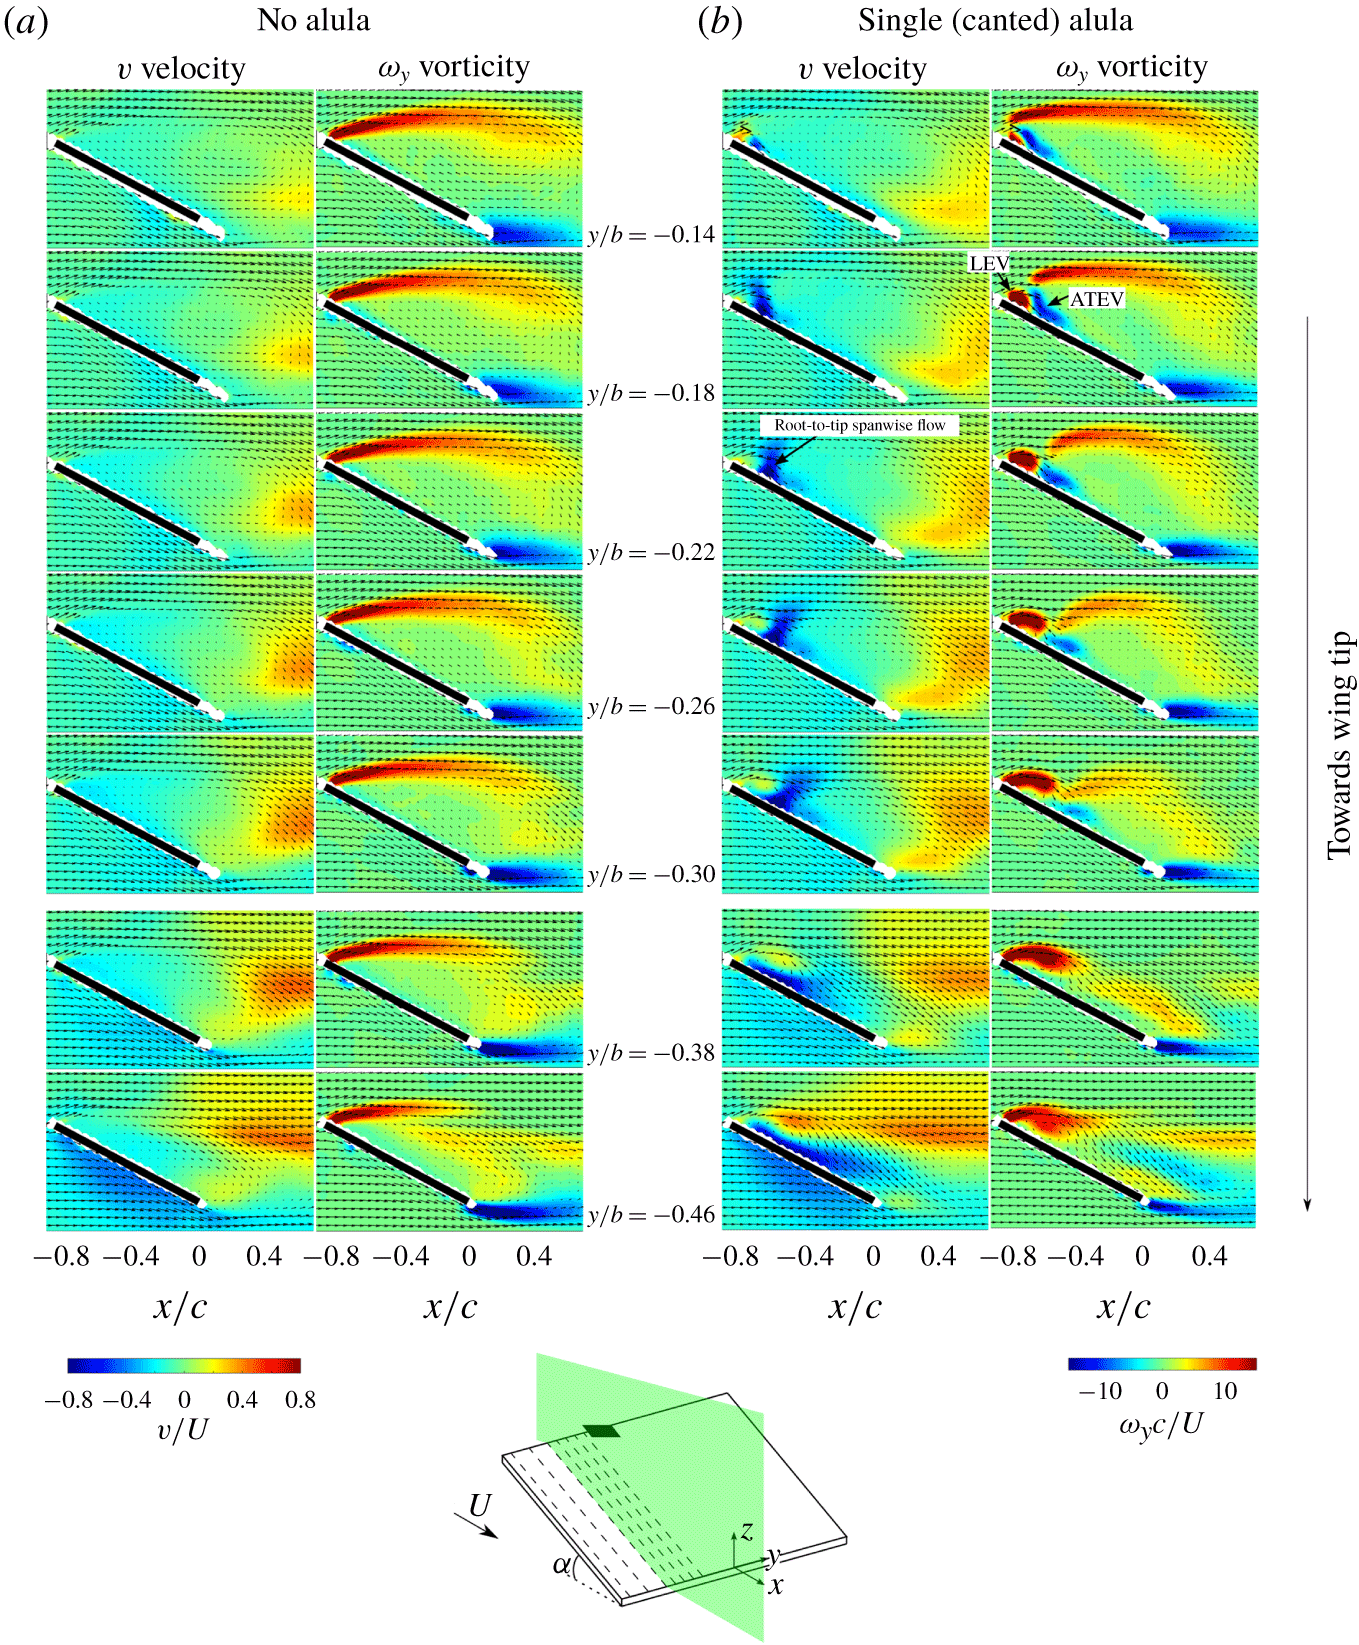
Figure 17 compares contour slices of spanwise velocity and spanwise vorticity in chordwise planes at different constant span values outboard of the wing with and without an alula. At spanwise stations immediately outboard of the alula,  $-0.22\leqslant y/b\leqslant -0.14$, positive spanwise vorticity is organized into a concentrated leading-edge vortex and a detached shear layer, the latter vortex pattern mimicking the separated leading-edge shear layer on the baseline wing. High-magnitude LEV flow penetrating the aft-located separation region results in the observed oppositely signed vortex or ATEV. The strong trailing-edge vortex stemming from the wing is the consequence of mismatched flow at the trailing edge of the wing due to the separation region extending into the wing wake.
Time-averaged spanwise vorticity  $\unicode[STIX]{x1D714}_{y}c/U$ and velocity
 $v/U$ contours in streamwise-oriented planes on the outer portion of the wing with (a) no alula and (b) a single leftward-oriented alula. Overlaid are time-averaged velocity vectors for which every second velocity vector is plotted.

Time-averaged streamwise vorticity  $\unicode[STIX]{x1D714}_{x}c/U$ and velocity
 $u/U$ contours in cross-stream planes on the outer portion of the wing with (a) no alula and (b) a single leftward-oriented alula. Overlaid are time-averaged velocity vectors for which every velocity vector is plotted.

At spanwise stations approaching the wing tip,  $y/b\leqslant -0.22$, the chord-wise extent of the LEV grows and the ATEV is shifted downstream and becomes more diffuse. Subsequently, the separated region comprised of counter-clockwise rotating swirl is reduced in size with the enveloping shear layer reduced in magnitude. These results indicate that the LEV is conical due to its size increase as the tip is approached. Such growth of the LEV results in a subsequent reduction in the chord-wise extent of the separation region near the wing tip. As the wing tip is approached, the trailing-edge vortex becomes less diffuse and is of lower magnitude than that measured on the wing without the alula.
Spanwise velocity contours are also compared in figure 17. High-magnitude spanwise flow is largely absent on the top surface of the baseline wing. In contrast, for the alula case, root-to-tip spanwise flow ( $-v/U$) of magnitude
 ${>}80\,\%$ that of the free-stream velocity is measured on the wing with the alula. This flow takes the form of a tilted column positioned between the LEV and the aft-located ATEV. This column is observed to tilt in the downstream direction and flattens out as the tip is approached. In the main text, we show that this flow drives vortex tilting and outboard vorticity flux that curbs the downstream shedding of the LEV.
Coincident with positive spanwise vorticity in the LEV is tip-to-root spanwise flow. This organization of spanwise flow, consisting of tip-to-root spanwise flow lying adjacent to root-to-tip spanwise flow, shares some similarity to that observed on rotating wings (Carr, Chen & Ringuette Reference Carr, Chen and Ringuette2013) and is the manifestation that the LEV is helical; a tracer particle injected at the leading edge navigates the LEV by first moving inboard before being accelerated outboard upon reaching the aft end of the LEV.
A.2 Contour plots of streamwise components of velocity and vorticity
Streamwise vorticity and velocity contours are shown in figure 18. For the baseline wing, streamwise vorticity takes the form of side-edge shear layers that roll up into weak concentric vortices at their ends. In contrast, for the alula cases, a surface-layer vortex is observed near the upstream corners of the wing for wing sections outboard of the alula. This vorticity stems in part from the aft-tilted LEV. With downstream distance, this vortex merges with the tip vortex, of like sign, forming a near circular tip vortex by the midchord of the wing. In contrast on the adjacent wing tip, we observe a weaker tip vortex that is displaced further from the wing plane on the wing with the alula relative to that on the baseline wing. This suggests that while the alula may increase sectional lift on the portion of the wing outboard of the alula, sectional lift is likely reduced on the adjacent portion of the wing due to reduced downwash from a weaker tip vortex.
From streamwise velocity contours, we observe two stagnation regions on the wing with the alula which contrasts with the single stagnation region on the wing without an alula. The outboard stagnation region is associated with the aft-tilted LEV and tip vortex and contains reverse flow at measured chordwise stations,  $x/c\leqslant -0.5$. The adjacent stagnation region is associated with the leading-edge separation region.