I. INTRODUCTION
Accurate noise characterization of radio frequency (RF) and microwave devices is an essential part in the process of developing performance receivers for modern wireless communications. Measurement accuracy in different noise characterization processes has been widely treated in the literature, with special focus on mismatch derived effects [Reference Randa, Dunsmore, Dazhen, Wong, Walker and Pollard1–Reference Valk, Johansen, Routledge, Vaneldik and Landecker13]. Traditionally, noise figure measurements of circuits and subsystems were typically performed using the Y-factor technique [14–16]. Nonetheless, cold-source technique, mainly used to compute device noise parameters in the past [Reference Adamian and Uhlir17–Reference Escotte, Plana and Graffeuil21], is being increasingly used in modern equipment for noise figure characterization [Reference Ballo22, 23]. Regardless of the technique used, the bandwidth of the noise receiver is an additional source of error in noise figure characterization when device under test (DUT) characteristics vary within this bandwidth. When performing a noise measurement at a certain frequency, the noise receiver measures the overall noise power within its noise bandwidth. Typically, this bandwidth should be narrow enough for the DUT characteristics to remain unchanged. The noise figure computed will then agree with the desired noise figure at measurement frequency, i.e. the spot noise figure [24] at that frequency. However, there are circumstances in which the DUT presents significant variations within the bandwidth of the receiver. This can happen either because the DUT is ultra narrow-band or just because a relatively large receiver bandwidth is imposed by the capabilities of the instrument or by the need of speeding up the measurement process. As an example, the narrowest bandwidth of some modern instruments with noise figure measurement capabilities is 800 kHz [25]. This may not be narrow enough for accurate measurement at the pass-band edge of a DUT with a very sharp roll-off.
While it is well known that the bandwidth of the noise receiver has to be narrower than the bandwidth of the DUT in order to avoid inaccuracies [Reference Carlson26–28], the effect of the opposite situation is not completely clear and contradictory results can be found [28–Reference Pastori32]. Only Y-factor based measurements were considered in [28–Reference Pastori32].
In this paper, a comparative analysis of bandwidth effects on Y-factor and cold-source noise figure measurements is performed. The analysis is founded on a full theoretical formulation that serves to explain the origin and assess the impact of these effects on both techniques. As will be shown in this work, errors associated with bandwidth effects in cold-source are completely different from Y-factor. Moreover, they are more critical and difficult to avoid, since they are not negligible for high gain DUTs as occurs with Y-factor. As an outcome of the analysis, corrections are proposed to minimize bandwidth errors whenever relevant. All the conclusions are confirmed and validated by measurements performed on different DUTs.
The paper is organized as follows. In Section II, the bases of Y-factor and cold-source noise figure measurement techniques are summarized. General expressions of Y-factor and cold-source based noise figure measurements as a function of spot noise figure and gain values are given in Section III. An analytical study of bandwidth effects when system bandwidth is limited by the DUT during the measurement process is then developed in Section IV. Correction terms are proposed in Section V to improve accuracy when narrow-band receivers are not available. Finally, in Section VI, experimental results from various DUTs are provided to confirm the conclusions extracted from the analysis and to verify the validity of the correction terms.
II. FUNDAMENTALS ON Y-FACTOR AND COLD-SOURCE NOISE FIGURE MEASUREMENT TECHNIQUES
The noise figure of a two-port is defined in [24] as the ratio between the total noise power available at the output port per unit bandwidth and the contribution to this noise exclusively coming from the source termination, which can be written as:
 $$F\left(f \right)= \displaystyle{N_o \left(f \right)\over G_{av} \left(f \right)kT_0}\comma \;$$
where N o(f) is the noise power available per unit bandwidth at the output port, k is the Boltzmann constant, T 0 is the standard reference temperature of 290 K, and G av(f) is the available gain of the two-port, given in (2).
 $$G_{av} \left(f \right)= \displaystyle{\left(1 - \vert \Gamma _s \vert ^2 \right)\over \vert 1 - s_{11} \Gamma_s \vert^2} \vert s_{21} \vert^2 \displaystyle{1 \over \left(1 - \vert \Gamma_{out} \vert^2 \right)}\comma \; $$
Sij being the S-parameters of the two-port, Γout its output reflection coefficient, and Γs is the source reflection coefficient.
To emphasize that the noise figure (1) is a point function of frequency, the term spot noise figure is used in [24].
The Y-factor and the cold-source techniques are the two main noise figure measurement techniques. The bases of these two techniques are widely reported in the literature [Reference Adamian and Uhlir17–Reference Meierer and Tsironis19, 24, 33, Reference Friis34]. Some fundamentals on these procedures are summarized here.
A) Y-factor technique
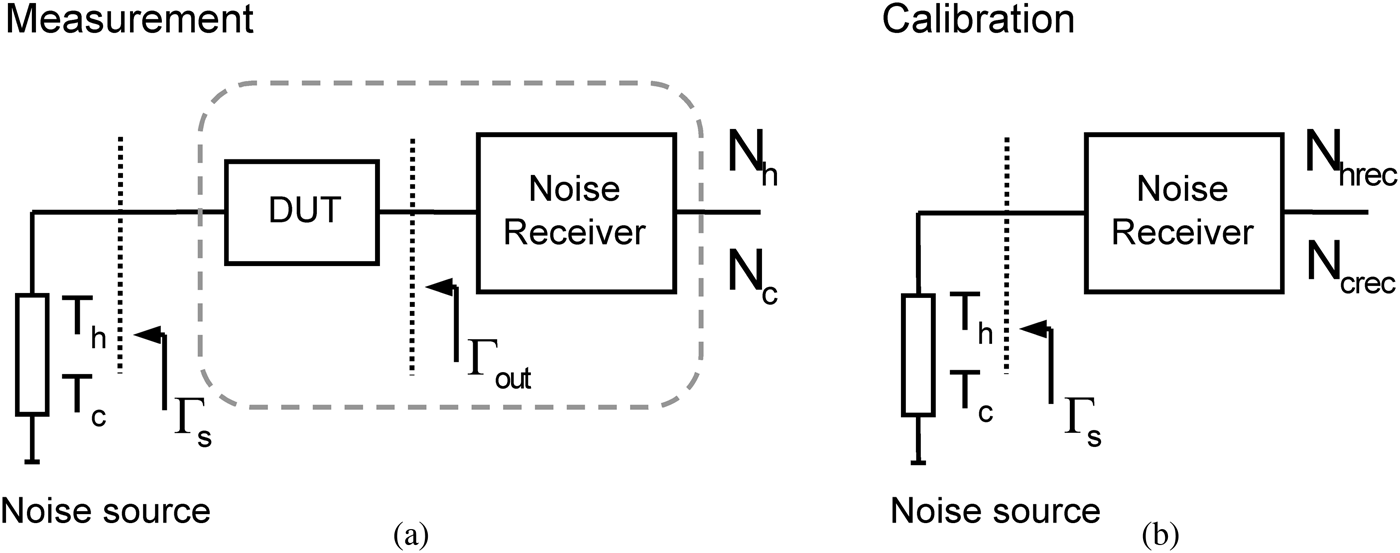
In the Y-factor technique, the noise figure is computed from two noise powers (N c, N h) measured with the noise source at its cold and hot temperatures (T c, T h) connected to the DUT. A second stage correction is necessary to eliminate the noise contribution of the receiver. To this end, a calibration step in which the receiver noise figure is characterized has to be performed. With the noise source directly connected to the receiver, two noise powers (N crec, N hrec) are measured. A basic block-diagram of measurement and calibration steps can be seen in Fig. 1. The DUT noise figure is computed as:
 $$F_{YF} = F_{sys} - \displaystyle{F_{rec} - 1 \over G_{ins}}\comma \;$$
where F sys is the noise figure of the DUT-receiver system and F rec is the receiver noise figure. Note that, in (3), G av required by Friis formula [Reference Friis34] is approximated by the insertion gain of the DUT G ins, computed from scalar measurements. Approximating the cold temperature T c to the reference temperature of T 0 = 290 K, these noise figures can be obtained as:
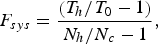 $$F_{sys} = \displaystyle{\left(T_h / T_0 - 1 \right)\over N_h / N_c - 1}\comma \; $$
 $$F_{rec} = \displaystyle{\left(T_h /T_0 - 1 \right)\over N_{hrec} / N_{crec} - 1}.$$
G ins is computed as:
 $$G_{ins} = \displaystyle{N_h - N_c \over N_{hrec} - N_{crec}}.$$
Basic block-diagram of a Y-factor based noise figure measurement: (a) DUT measurement step; (b) calibration step.

B) Cold-source technique
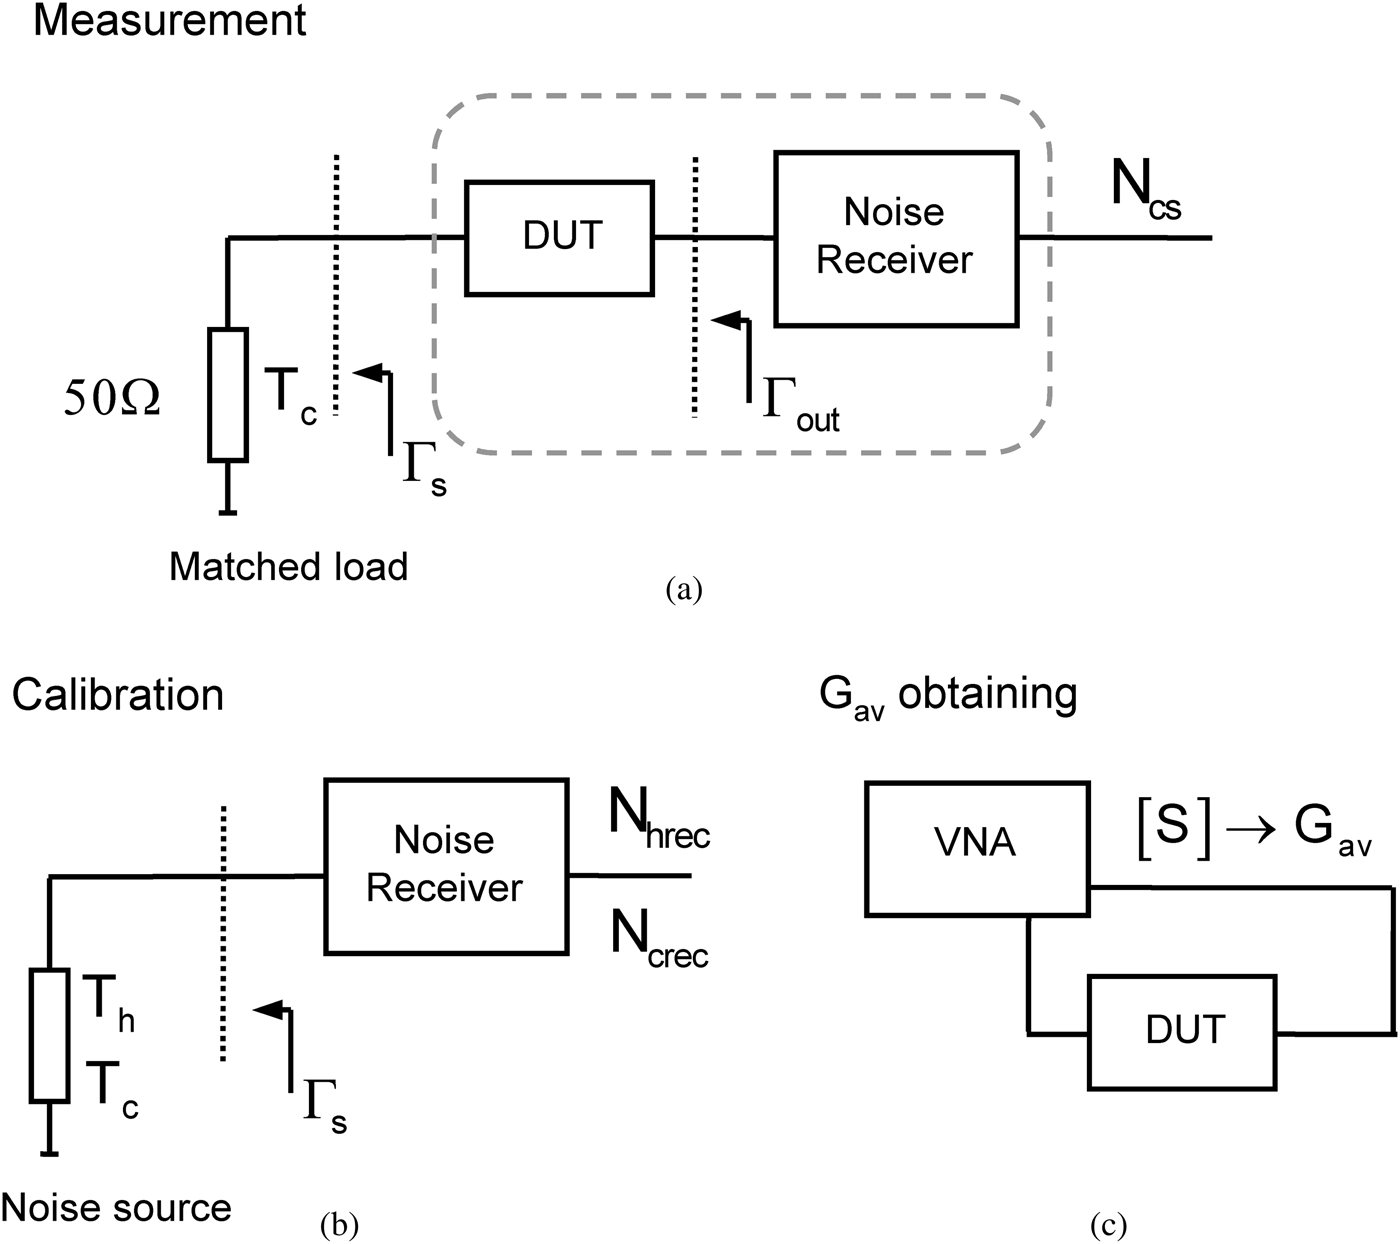
The cold-source technique computes the noise figure from a single noise measurement (N cs) with a matched source load at room temperature T c. For that, the available gain of the DUT and the gain-bandwidth product of the receiver (kBGrec) have to be previously determined. This kBGrec term is usually obtained in the calibration step, required also for removing the noise contribution of the receiver. In cold-source technique, by definition, there is no hot measurement of the DUT. Thus, instead of G ins the G av computed from vector measurements is used. Since noise measurements are normally performed in a noise figure analyzer or a spectrum analyzer, obtaining G av requires the additional use of a VNA. However, modern noise figure measurement capabilities included in VNA (PNA-X [25]) offer a significantly simplified vector corrected setup, especially valuable for the most challenging DUTs and setups [Reference Simpson, Ballo, Dunsmore and Ganwani35, Reference Wiatr, Crupi, Caddemi, Mercha and Schreurs36]. A basic block-diagram of cold-source based noise figure characterization is given in Fig. 2.
Basic block-diagram of a cold-source based noise figure measurement: (a) DUT measurement step; (b) calibration step; (c) G av obtaining.
Thus, and considering T c ≈ T 0 again, the DUT noise figure can be characterized as in (7).
 $$F_{CS} = F_{sysCS} - \displaystyle{F_{rec} - 1 \over G_{av}}\comma \; $$
where
 $$F_{sysCS} = \displaystyle{N_{cs} \over \underline{kBG}_{rec} G_{av} T_0}.$$
F rec is, in its simplest form, that of (5) and
 $$\underline{kBG}_{rec} = \displaystyle{N_{hrec} - N_{crec} \over \left(T_h - T_c \right)}.$$
It is worthwhile to point out that (7)–(9) represent a simplified approach of the usual fully corrected cold-source implementation [Reference Davidson, Leake and Strid18, Reference Otegi, Collantes and Sayed20] in which all mismatch terms have been neglected.
III. GENERAL EXPRESSIONS FOR NOISE FIGURE AS A FUNCTION OF SPOT NOISE FIGURE AND GAIN
In this section, the general expressions for Y-factor and cold-source techniques will be analytically formulated in terms of the spot noise figure and gain. For the sake of simplicity and to properly focus on the stated problem, any systematic effect apart from the influence of the measurement bandwidth will be neglected. In particular, a perfectly matched measurement path will be assumed and the cold temperature T c will be approximated to the reference T 0.
Let us consider that the noise figure of a DUT with frequency dependent noise figure F(f) and available gain G(f) is to be characterized at a frequency f 0. Thus, the spot DUT noise figure F(f 0) = F f0 is the desired result. For the characterization, a noise receiver with noise figure F rec(f) and transducer gain G rec(f) will be considered. Note that these F rec(f) and G rec(f) correspond to a bandpass type response, with a certain bandwidth B rec, centered at f 0.
Since no mismatch will be present according to our approximation, there will be no difference between available and delivered noise powers. So from now on, G(f) and G rec(f) will be simply referred to as gains.
A) Noise figure from Y-factor
The cold and hot noise powers (N c, N h) measured by the receiver in the DUT measurement step can be written as (10) and (11), respectively [Reference Carlson26].
 $$N_c = kT_0 \vint_0^{\infty} G_{rec} \left(f \right)\left(G\left(f \right)F\left(f \right)+ \left(F_{rec} \left(f \right)- 1 \right)\right)df\comma \; $$
 $$\eqalign{N_h &= k\vint_0^{\infty} G_{rec} \left(f \right)\left(T_h G\left(f \right)+ T_0 G\left(f \right)\left(F\left(f \right)- 1 \right)\right. \cr &\quad \left. +\; T_0 \left(F_{rec} \left(f \right)- 1 \right)\right)df.}$$
Besides, the cold and hot noise powers measured by the receiver in the calibration step can be written as in (12) and (13).
 $$N_{crec} = kT_0 \vint_0^{\infty} G_{rec} \left(f \right)F_{rec} \left(f \right)df\comma \;$$
 $$N_{hrec} = k\vint_0^{\infty} \left(T_h G_{rec} \left(f \right)+ T_0 G_{rec} \left(f \right)\left(F_{rec} \left(f \right)- 1 \right)\right)df.$$
In practice, the overall integrals in (10)–(13) are limited by the frequency selectivity of the two-ports involved.
Substituting (10) and (11) in (4), the system noise figure is given by:
 $$F_{sys} = \displaystyle{\vint_0^{\infty} G_{rec} \left(f \right)\left(G\left(f \right)F\left(f \right)+ \left(F_{rec} \left(f \right)- 1 \right)\right)df \over \vint_0^{\infty} G_{rec} \left(f \right)G\left(f \right)df}.$$
Analogously, the receiver noise figure F rec measured in the calibration step as in (5) leads to (15), which is the average receiver noise figure [37].
 $$F_{rec} = \displaystyle{\vint_0^{\infty} G_{rec} \left(f \right)F_{rec} \left(f \right)df \over \vint_0^{\infty} G_{rec} \left(f \right)df}.$$
The insertion gain obtained from (6) is also an average, weighted by the receiver gain, as shown in (16).
 $$G_{ins} = \displaystyle{\vint_0^{\infty} G_{rec} \left(f \right)G\left(f \right)df \over \vint_0^{\infty} G_{rec} \left(f \right)df}. $$
From (14) to (16), and applying (3), the resultant Y-factor noise figure is:
 $$F_{YF} = \displaystyle{\vint_0^{\infty} G_{rec} \left(f \right)G\left(f \right)F\left(f \right)df \over \vint_0^{\infty} G_{rec} \left(f \right)G\left(f \right)df}. $$
B) Noise figure from cold-source
In this case, the DUT noise figure will be computed by means of (7). With the assumptions made, i.e. no mismatch and T c ≈ T 0, N cs comes to be N c in (10). The computed gain-bandwidth product of the receiver will simply be:
 $$\underline{kBG}_{rec} = k\vint_0^{\infty} G_{rec} \left(f \right)df.$$
Besides, G av in (7) and (8), computed from S-parameters, will be the spot gain corresponding to the measurement frequency f 0, i.e. G av = G(f 0) = G f0. Thus, the system noise figure characterized by means of cold-source will be:
 $$F_{sysCS} = \displaystyle{\vint_0^{\infty} G_{rec} \left(f \right)\left(G\left(f \right)F\left(f \right)+ \left(F_{rec} \left(f \right)- 1 \right)\right)df \over G_{f_0} \vint_0^{\infty} G_{rec} \left(f \right)df}.$$
The noise figure obtained with cold-source is then:
 $$F_{CS} = \displaystyle{\vint_0^{\infty} G_{rec} \left(f \right)G\left(f \right)F\left(f \right)df \over G_{f_0} \vint_0^{\infty} G_{rec} \left(f \right)df}.$$
An important difference needs to be pointed out between (17) and (20). In (17), the integral in the denominator is limited to the actual bandwidth resulting from the series connection of the DUT and the receiver (G rec(f)G(f)). On the contrary, in (20) the integral in the denominator is only limited by the receiver bandwidth G rec(f).
This difference has no relevance if the receiver bandwidth is narrower than the DUT, as will be the case of many conventional measurements. Actually, if we can consider that the DUT characteristics remain constant inside the receiver bandwidth, both (17) and (20) will yield the desired spot noise figure Ff 0.
However, the difference between (17) and (20) can be significant when the DUT has a narrower bandwidth than the receiver. This situation is analyzed in detail in the following section.
IV. SYSTEM BANDWIDTH LIMITED BY THE DUT
Let us analyze here the case in which the bandwidth during the noise measurement is limited by the DUT instead of being restricted by the receiver. We can have this condition either because we are measuring ultra narrow-band DUTs, or because we want to speed up a measurement by choosing a wideband receiver. This situation is ideally sketched in Fig. 3(a). In addition, an equivalent situation happens when the measurement is performed in the pass-band edge of a DUT with a very sharp roll-off as depicted in Fig. 3(b).
Two possible sources of error: (a) DUT bandwidth narrower than receiver bandwidth; (b) measurement in DUT pass-band edge.
To ease the derivation of qualitative conclusions, idealized band-pass frequency responses have been assigned to DUT and receiver in Fig. 3. DUT and receiver have constant gains (Gf 0 and G 0rec, respectively) inside their respective bandwidths (Fig. 3). In these conditions, the bandwidth during the measurement step will be given by the intersection of the DUT and receiver bandwidths. In the following, this system bandwidth will be notated as B sys. A system bandwidth limited by the DUT implies that B sys < B rec.
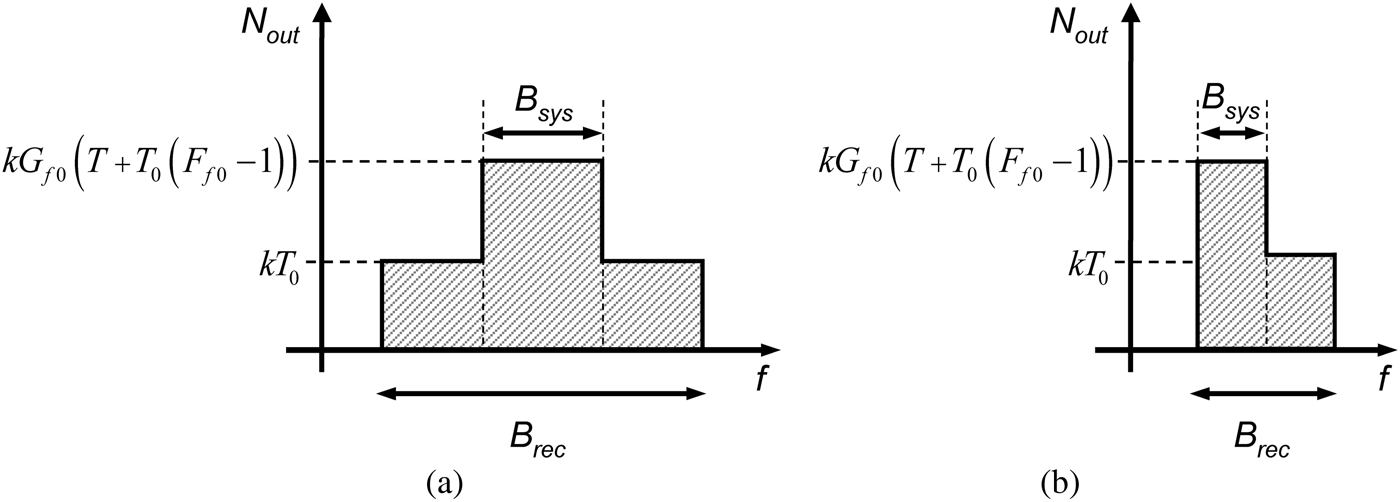
Under these idealized conditions assumption, the available noise power density at the output of the DUT (N out) for a source temperature T is that of (21). A basic diagram showing the noise behavior at the output of the DUT for the two situations of Fig. 3 is given in Fig. 4.
 $$\eqalign{N_{out} \left(f \right)&= kG\left(f \right)\left(T + T_0 \left(F\left(f \right)- 1 \right)\right)\cr &\approx \left\{\matrix{kG_{f0} \left(T + T_0 \left(F_{f0} - 1 \right)\right)\hfill &f \in B_{DUT} \hfill \cr kT_0 \hfill &f \notin B_{DUT} \hfill} \right..}$$
Noise power density available at the output of the DUT within the receiver bandwidth: (a) DUT bandwidth narrower than receiver bandwidth; (b) measurement in DUT pass-band edge.
A) Impact of B sys < B rec on Y-factor
From (21), the measured cold and hot noise powers, (10) and (11) can be rewritten as (22) and (23), respectively:
 $$\eqalign{N_c &\approx kG_{0rec} \left[B_{sys} G_{f0} F_{f0} T_0 + \left(B_{rec} - B_{sys} \right)T_0 \right. \cr &\quad \left. +\; B_{rec} T_0 \left(F_{rec} - 1 \right)\right]\comma \; }$$
 $$\eqalign{N_h &\approx kG_{0rec} \left[B_{sys} G_{f_0} \left(T_h + T_0 \left(F_{f_0 } - 1 \right)\right)\right. \cr &\quad \left. + \;\left(B_{rec} - B_{sys} \right)T_0 + B_{rec} T_0 \left(F_{rec} - 1 \right)\right]\comma \; } $$
where kG 0rec(B rec − B sys)T 0 is the out-of-band noise contribution of the DUT inside B rec.
Let us reconsider the Y-factor formulation under the assumptions made. From these noise powers (22), (23) the system noise figure (eqn) results in:
 $$F_{sys} \approx F_{f_0} + \left(\displaystyle{B_{rec} \over B_{sys}} - 1 \right)\displaystyle{1 \over G_{f_0}} + \displaystyle{B_{rec} \over B_{sys}} \displaystyle{\left(F_{rec} - 1 \right)\over G_{f_0}}\comma \; $$
which agrees with [Reference Pastori32]. Besides, the insertion gain (16) will turn into:
 $$G_{ins} \approx \displaystyle{B_{sys} \over B_{rec}} G_{f_0}. $$
Thus, the DUT noise figure characterized by means of Y-factor will be:
 $$F_{YF} \approx F_{f_0} + \left(\displaystyle{B_{rec} \over B_{sys}} - 1 \right)\displaystyle{1 \over G_{f_0}}.$$
It is commonly accepted, [28, 29], that the error due to B sys < B rec in Y-factor comes from the extra noise detected in the calibration step. However, as it can be concluded from (22)–(26), the error comes from the out-of-band noise contribution of the DUT during the measurement step (the term kG 0rec(B rec − B sys)T 0), as pointed-out in [Reference Pastori32]. Besides, the error for a given B sys decreases as G f0 increases, turning negligible for a G f0 significantly higher than the (B rec − B sys)/B sys ratio. In other words, the error turns negligible for a gain high enough to make the out of band noise contribution of the DUT negligible. It should be noted in (26) that the result is not an underestimation of the DUT noise figure, as concluded from [28] or stated in [29], but an overestimation [31, Reference Pastori32].
B) Impact of B sys < B rec on cold-source
Coming to cold-source, N cs is again approximated by (22), so (19) leads to:
 $$F_{sysCS} \approx F_{f_0} \displaystyle{B_{sys} \over B_{rec}} + \left(1 - \displaystyle{B_{sys} \over B_{rec}} \right)\displaystyle{1 \over G_{f_0}} + \displaystyle{\left(F_{rec} - 1 \right)\over G_{f_0}}. $$
Thus, the cold-source noise figure result is:
 $$F_{CS} \approx F_{f_0 } \displaystyle{B_{sys} \over B_{rec}} + \left(1 - \displaystyle{B_{sys} \over B_{rec}} \right)\displaystyle{1 \over G_{f_0}}. $$
There is a substantial difference between this result and the previous Y-factor (26). In Y-factor the error tends to disappear as DUT gain increases, however, this is not the case for cold-source. Actually, the error, in dB, tends to the bandwidth ratio (B sys/B rec)dB for a significant DUT gain that makes negligible the second term in (28). This comes directly from the fact that the integral in the denominator of (20) is limited by the receiver (B rec) while the integral in the numerator is limited by the series connection of DUT and receiver (B sys). This ratio makes the first term in (28) to underestimate the spot noise figure, for any DUT gain.
V. CORRECTION TERMS
In sight of the previous results, correction terms can be estimated, for both cold-source and Y-factor, to minimize the effect of a system bandwidth limited by the DUT. To this end, the knowledge of the bandwidth ratio B sys/B rec would be required. It is important to note that these corrections are approximate because they rely on the ideal band-pass characteristics of DUT and receiver.
A) Y-factor
In Y-factor, according to (25), the B sys/B rec ratio can be estimated from (29).
 $$\displaystyle{B_{sys} \over B_{rec}} \approx \displaystyle{G_{ins} \over G_{f_0}}. $$
G ins is known from the Y-factor measurement while G f0 can be determined from an additional measurement with a vector network analyzer, for instance. The corrected Y-factor expression would then be:
 $$F_{YF\_corr} = F_{YF} - \left(\displaystyle{1 \over G_{ins} / G_{f_0}} - 1 \right)\displaystyle{1 \over G_{f_0}}. $$
B) Cold-source
In cold-source the insertion gain G ins is not known. Therefore (29) cannot be used to estimate the B sys/B rec ratio. However, a fair approximation to B sys/B rec can be achieved as:
 $$\displaystyle{B_{sys} \over B_{rec}} \approx \displaystyle{\left. \overline{G\left(f \right)} \right\vert_{B_{rec}} \over G_{f_0}}\comma \;$$
where  $\left. \overline{G\left(f \right)} \right\vert_{B_{rec}}$ is the average gain of the DUT in the receiver bandwidth. This average gain can be obtained from an S-parameter characterization of the DUT in the whole B rec. It is important to remember that (31) is only an approximation because B rec is assumed to have an ideal rectangular band-pass frequency-response. According to (28) and (31), the corrected cold-source result can be calculated as:
 $$\eqalign{F_{CS\_corr} &= F_{CS} \displaystyle{1 \over \left. \overline{G\left(f \right)} \right\vert_{B_{rec}} \bigg{/} G_{f_0}} \cr &\quad - \left(\displaystyle{1 \over \left. \overline{G\left(f \right)} \right\vert_{B_{rec}} \bigg{/} G_{f_0}} - 1 \right)\displaystyle{1 \over G_{f_0}}.}$$
VI. MEASUREMENTS
To verify the validity of the analysis and formulation presented in this paper, relevant measurement results are provided. The noise measurements have been performed in a spectrum analyzer including noise figure measurement capabilities (PSA E4440), with a 346B noise source. A PNA E8358A has been used for vector measurements.
For the measurements, three DUTs (labeled as DUT1, DUT2, and DUT3) with different gains and a 3 dB bandwidth of approximately 2 MHz, are considered. The DUTs are in-home built, cascading packaged commercial amplifiers and narrow-band filters. Attenuators at the output avoid mismatch effects, eliminating the necessity of a full noise receiver calibration. It is important to note that the whole analysis has been developed on the basis of a matched setup. Taking into account mismatch effects would require a rigorous analysis of the overall effects on the obtained results and their correction, as well as requiring more demanding measurement setups. This can be the case, for instance, of on-wafer noise characterization, where the effect of input/output access blocks has to be removed [Reference Gao, Law, Wang, Aditya and Boeck38–Reference Dambrine, Happy, Danneville and Cappy41].
A) Gain and noise characteristics of the DUTs versus frequency
Figures 5 and 6 show, respectively, the spot gains and noise figures of the DUTs as a function of frequency in a 6 MHz range centered at 70 MHz. The gains have been computed from vector measurements in the PNA. The noise figures have been characterized by means of cold-source technique, from noise measurements carried out in the PSA with a bandwidth of 51 kHz at each measurement point. The three DUTs present equal spot noise figure (6.25 dB) while different spot gains (4, 6.75 and 20.5 dB, respectively) at 70 MHz. These values are taken as the reference true values for the rest of the analysis.
Spot gains of the three DUTs in the 67–73-MHz frequency range.
Spot noise figures of the three DUTs in the 67–73-MHz frequency range.
B) Noise figure measurements with different receiver bandwidths
First, the evolution of Y-factor and cold-source noise figure measurement results for increasing receiver bandwidth has been analyzed. For that, the noise figure of DUT1 has been measured at its central frequency of 70 MHz with five different receiver bandwidth settings (0.51, 1, 2, 4, and 6 MHz). These receiver bandwidths lead approximately to the following B sys/B rec ratios, respectively: 0.99, 0.96, 0.84, 0.57 and 0.38. According to (29), these values can be estimated dividing the insertion gain computed in each measurement with the spot insertion gain.
Y-factor and cold-source noise figures (labeled as F YF and F CS, respectively) have been measured as described in Section II. The measurement results, given in Fig. 7, clearly show how the accuracy degrades as the receiver bandwidth widens. Results confirm that Y-factor overestimates the actual DUT noise figure (approximately 0.6 dB for a B rec of 6 MHz), as pointed out in Section IV. In contrast, the cold-source results are significantly less accurate than Y-factor and below the true DUT noise figure. With a B rec of 6 MHz the noise figure obtained from cold-source technique is more than 3 dB lower than the true value.
Y-factor (F YF) and cold-source (F CS) noise figure measurements of DUT1 with five receiver bandwidths compared to the actual spot noise figure F f0 = 6.25 dB.
C) Noise figure measurements as a function of DUT gain and correction terms
Let us now verify the effect of DUT gain on the measurement results. For that, the Y-factor and cold-source noise figures of the three DUTs have been measured at 70 MHz setting B rec to 6 MHz. In addition, their corrected versions (30) and (32) have been computed. For the sake of clarity, the results have been depicted in Fig. 8 as a function of DUT gain. The results shown in Fig. 8 are in very good agreement with the conclusions presented in Section IV. When coming to Y-factor, as expected, the error disappears for high DUT gain. However, in cold-source the error augments as DUT gain increases. The worst case is an underestimation of approximately 4.2 dB for DUT3, i.e. for highest gain. As expected from (28), this error is (B sys/B rec)dB.
Y-factor and cold-source noise figures of the three DUTs measured with B rec = 6 MHz (with and without corrections), and comparison to the actual spot noise figure F f0 = 6.25 dB.
Finally, let us analyze the correction terms proposed in Section V. As it can be seen in Fig. 8, the errors are almost eliminated with the corrected versions (F YF_corr and F CS_corr) even though they are based on ideally rectangular band-pass frequency responses. These results show that the correction terms can be an acceptable solution when receivers with narrow bandwidth are not either available or recommended (because we may be interested in speeding up the measurement process, for instance).
VII. CONCLUSION
The effect of receiver bandwidth on Y-factor and cold-source noise figure measurements has been analyzed and compared. Results show that, contrary to Y-factor, errors associated with a wide receiver bandwidth in cold-source increase with DUT gain and generate a critical underestimation of the actual noise figure. As a consequence, the use of wide receiver bandwidths to speed up the measurement process in high gain DUTs, acceptable in Y-factor, should be avoided in cold-source. Bandwidth selection has to be carefully considered when measuring noise figure with cold-source technique, especially in ultra narrow-band DUTs or at the band-pass edge of DUTs with sharp roll-offs. Nonetheless, the availability of receivers with narrow enough bandwidths for accurate narrow-band DUT characterization may be limited by the capabilities of the measurement instrument. Correction terms have then been proposed to improve accuracy when narrow-band receivers are not available. Conclusions of the analysis have been experimentally validated by means of noise measurements performed on various narrow-band DUTs with different characteristics.
ACKNOWLEDGEMENT
This work was supported in part by Spanish and Basque administrations, respectively, under Project TEC2012-35875 and Project IT456-10.
 Nerea Otegi received the Ph.D. degree from the University of the Basque Country (UPV/EHU), Bilbao, Spain, in 2008. In 2002, she joined the Electricity and Electronics Department, UPV/EHU, where she has been an Associate Professor since 2006. Her areas of interest include noise characterization at microwave frequencies and nonlinear analysis of microwave circuits.
Juan-Mari Collantes received the Ph.D. degree in electronics from the University of Limoges, France, in 1996. Since February 1996, he has been an Associate Professor with the Electricity and Electronics Department, University of the Basque Country (UPV/EHU), Bilbao, Spain. In 1996 and 1998, he was an Invited Researcher with Agilent Technologies (formerly the Hewlett-Packard Company), Santa Rosa, CA. In 2003, he was with the French Space Agency (CNES), Toulouse, France, where he was involved with power amplifier analysis, simulation, and modeling. His areas of interest include nonlinear analysis and design of microwave circuits, microwave measurement techniques, and noise characterization.
Mohamed Sayed received BS and MS degrees in electrical engineering, from Cairo University, Egypt. He earned his Ph.D. degree in electrical engineering from Johns Hopkins University, Baltimore, Maryland. Mohamed is currently principal consultant for Microwave and Millimeter Wave Solutions. He previously worked at Hewlett-Packard and Agilent Technologies for 30 years. He is a world-wide expert on microwave and millimeter wave products and systems. He developed and launched state-of-the-art technologies for vector network analyzers, sources, and spectrum analyzers. Mohamed is an IEEE Life Senior Member. He is currently the ARFTG Vice President, and was general and technical program chair for several ARFTG conferences. He is also on the steering committee of the IEEE Wireless and Microwave Technology Conference. Mohamed is the author and co-author of over 70 publications on device characterization, microwave and millimeter wave measurement systems, and high power amplifier design. He also reviews technical papers for ARFTG conferences and IEEE publications.