Introduction
Aves is the most diverse tetrapod class, with approximately 10,000 extant species ranging in size from the bee hummingbird (~0.002 kg) to the ostrich (~110 kg) (Dunning Reference Dunning2007; Jetz et al. Reference Jetz, Thomas, Joy, Hartmann and Mooers2012). There is now an abundance of evidence indicating that birds are a derived group of theropod dinosaurs (Huxley Reference Huxley1868, Reference Huxley1870; Ostrom Reference Ostrom1973, Reference Ostrom1976; Padian and Chiappe Reference Padian and Chiappe1998). A gradual accumulation of the traits that today distinguish Aves occurred throughout the evolution of Theropoda (Padian and Chiappe Reference Padian and Chiappe1998; Brusatte et al. Reference Brusatte, Lloyd, Wang and Norell2014). Much attention is paid to changes directly related to the evolution of powered flight, including shifts in the orientation of the bones of the pectoral girdle (Jenkins Reference Jenkins1993; Senter Reference Senter2006), changes in forelimb proportions (Middleton and Gatesy Reference Middleton and Gatesy2000; Benson and Choiniere Reference Benson and Choiniere2013; Dececchi and Larsson Reference Dececchi and Larsson2013; Benson et al. Reference Benson, Campione, Carrano, Mannion, Sullivan, Upchurch and Evans2014), and body size reduction (Turner et al. Reference Turner, Pol, Clarke, Erickson and Norell2007; Dececchi and Larsson Reference Dececchi and Larsson2013; Lee et al. Reference Lee, Cau, Naish and Dyke2014; Puttick et al. Reference Puttick, Thomas and Benton2014). However, a number of key changes also occurred in the pelvic girdle and limbs (Gatesy and Middleton Reference Gatesy and Middleton1997; Hutchinson and Gatesy Reference Hutchinson and Gatesy2000; Hutchinson Reference Hutchinson2001; Hutchinson and Allen Reference Hutchinson and Allen2009). One of these is the shift in femoral orientation from a near-vertical position to a subhorizontal one, with the long axis running cranioventrally (Gatesy Reference Gatesy1990, Reference Gatesy1991; Hutchinson and Allen Reference Hutchinson and Allen2009). The orientation of the femur seen in extant birds was likely fully established in avians basal to Ornithurae (Hutchinson and Gatesy Reference Hutchinson and Gatesy2000).
This change in femoral orientation is associated with a more craniad center of mass in birds compared with nonavian theropods. It is due either to the reduction in the tail and associated musculature (Gatesy Reference Gatesy1990), an increase in the relative size of the pectoral girdle and limbs (Allen et al. Reference Allen, Bates, Li and Hutchinson2013), or a combination of the two. This shift requires a subhorizontal orientation of the femur in order for the knee to be placed under the center of mass (Gatesy Reference Gatesy1990, Reference Gatesy1991). One implication of this construction is that the loading regime of avian femora is dominated by torsion due to the ground reaction force crossing the long axis of the bone at an eccentric angle (Carrano Reference Carrano1998a; Carrano and Biewener Reference Carrano and Biewener1999; Main and Biewener Reference Main and Biewener2007). Although the degree to which torsion is greater than other strains varies during the stride cycle, it is only superseded by bending strain at the end of it, prior to push-off of the foot, when the femur is at its most vertical (Carrano Reference Carrano1998a; Carrano and Biewener Reference Carrano and Biewener1999). As bone is less resistant to twisting than to axial compression or bending strains, avian femora are required to be more robust to torsional strain (Gatesy Reference Gatesy1991; Biewener and Dial Reference Biewener and Dial1995; De Margerie et al. Reference De Margerie, Sanchez, Cubo and Castanet2005). Another consequence of this shift in center of mass is that femoral length should be constrained in birds in order to keep the knee under the center of mass during stance (Gatesy Reference Gatesy1990, Reference Gatesy1991). This is likely to impose an additional constraint on the femoral morphology of birds compared with nonavian theropods.
If the function of the avian femur constrains its proportions, then regressions of femoral length versus circumference should exhibit a nonlinear pattern, with large taxa scaling with a lower exponent than small taxa. A previous study found that interspecific curvilinear scaling occurs in nonavian theropods between femoral and tibial lengths and their respective circumferences, with exponents decreasing in larger theropods (>300 kg) (Christiansen Reference Christiansen1999a). This scaling pattern has been interpreted as a feature that enables larger taxa to maintain similar stresses in their bones to those of smaller taxa despite their increased mass and has also been found in mammals (Bertram and Biewener Reference Bertram and Biewener1990; Christiansen Reference Christiansen1999b,Reference Christiansenc; Carrano Reference Carrano2001). Although maintaining stresses similar to those of smaller species in large mammals during stance can be achieved through linear allometric patterns, for example, elastic similarity (McMahon Reference McMahon1973, Reference McMahon1975), such a relationship alone may not be sufficient to maintain those stresses during locomotion (Alexander Reference Alexander1977). However, a recent study of allometric patterns in extant quadrupeds found no difference in the scaling coefficient of body mass against femoral circumference in different size classes of mammals (Campione and Evans Reference Campione and Evans2012). Differences between size classes were found in regressions of femur circumference and length (Campione and Evans Reference Campione and Evans2012). This would suggest that the previously observed pattern of scaling between femoral circumference and length in mammals was not caused by changes in the relationship between circumference and body mass, but instead constitutes a separate size-dependent relationship.
Several studies have shown that femoral diameter and the maximum second moment of area scale with positive allometry relative to length in birds (Maloiy et al. Reference Maloiy, Alexander, Njau and Jayes1979; Gatesy Reference Gatesy1991; Carrano Reference Carrano1998a; Doube et al. Reference Doube, Yen, Kłosowski, Farke, Hutchinson and Shefelbine2012). Comparisons with nonavian theropods indicate that avian femora are more robust than those of their nonavian counterparts (Gatesy Reference Gatesy1991; Carrano Reference Carrano1998a). However, curvilinear scaling has not yet been found in birds. Given the additional constraints placed upon avian femora, it is expected that the scaling curve of femoral circumference (x) and length (y) should exhibit nonlinear scaling, despite few birds obtaining the masses found in large nonavian theropods. The additional constraints on avian leg-bone length outlined here only apply to the femur. As a result, curvilinear scaling of the tibiotarsus of terrestrial birds is not expected, particularly given that only a few extinct avian species attained a body mass approaching the 300 kg cutoff point between small and large theropods used by Christiansen (Reference Christiansen1999a) (Amadon Reference Amadon1947; Nguyen et al. Reference Nguyen, Boles and Hand2010).
Terrestrial, flightless birds are an excellent group in which to test for curvilinear scaling of femoral length to circumference. Flying birds use their hind limbs for a variety of functions beyond weight support and locomotion on land (e.g., prey capture, perching, swimming) that are associated with differences in femoral dimensions (Zeffer et al. Reference Zeffer, Johansson and Marmebro2003; Doube et al. Reference Doube, Yen, Kłosowski, Farke, Hutchinson and Shefelbine2012). Thus, interpretations of scaling relationships in the legs of flying birds need to consider adaptive changes related to differences in usage. In addition, many avian lineages have independently lost flight across a number of different orders, preventing results being attributable to the particular quirks of a single lineage (Roff Reference Roff1994; McCall et al. Reference McCall, Nee and Harvey1998). The predictions outlined here are tested using a large, phylogenetically broad sample of terrestrial flightless birds covering more than four orders of magnitude in body mass and fit to be compared with nonavian theropods.
Materials and Methods
Femoral length and least-circumference measurements were taken for 58 species of terrestrial flightless birds. Of these, 17 species represented the Palaeognathae and 23 represented the Gruiformes. The data set also included species of Columbiformes (2), Psittaciformes (1), and Galloanserae (12). Length was measured from the tip of the femoral trochanter to the distal-most point of the lateral condyle (Supplementary Fig. S1). Tibiotarsal length and least-circumference measurements were taken from 54 species. Due to the frequency of damage to the cnemial crest in fossil and subfossil specimens, tibiotarsal length was measured from the interarticular area (the area interarticularis as figured by Baumel and Witmer [Reference Baumel and Witmer1993]) to the distal-most point of the distal condyles (Supplementary Fig. S1). Length was measured to the nearest 0.01 mm using 300 mm digital calipers and rounded to the nearest 0.1 mm. A small number of specimens were measured using 150 mm dial calipers to the nearest 0.1 mm (Supplementary Appendix S1). Distances greater than 30 cm were measured to the nearest 1 mm using a tape measure. Circumferences were measured with cotton twine wrapped tightly around the bone shaft and marked at the end with ultrafine marker pen; the length of the marked section was then measured using 300 mm calipers. For bones with a diameter less than 7 mm, individual strands of twine were used. All measurements were taken three times, and the average was used for analysis. In addition, measurements of the phorusrhacid Psilopterus lemoinei were provided by F. Degrange (F. Degrange personal communication 2013). Tibiotarsal length for P. lemoinei was measured from the interarticular area to the intercondylar notch (F. Degrange personal communication 2013).
Only adult specimens were measured. These were identified by the following characteristics: femur exhibiting a fully formed intercondylar bridge, cnemial crest fully fused to the tibia with no trace of symphysis, tibiale and fibulare fully fused to the tibia with no evidence of symphysis, and a completely formed supratendinal bridge (when present).
Nonavian theropod femoral lengths and circumferences were taken from the literature. The core of the data set was provided by Carrano (Reference Carrano1998b) and Christiansen (Reference Christiansen1999a), with an additional 36 taxa added from more recent literature (see Supplementary Material). The former author used midshaft circumferences, while the latter used least circumferences. A one-way paired t-test of log10 circumference measurements from specimens used in both data sets indicated that the Christiansen (Reference Christiansen1999a) measurements were significantly lower (t=−2.47, df=21, p=0.011, 95% confidence interval [CI] of the differences=−0.015 to −0.001) than the corresponding measurements taken by Carrano (1998). Linear regression of the differences between corresponding measurements against the midshaft circumference for each specimen found no significant relationship between these variables (multiple R 2=0.058; adjusted R 2=0.011, p=0.282), indicating that the difference between measurements from the two sources did not increase with size of measurement. A simple transform function was therefore added to convert midshaft measurements to estimates of minimum shaft circumference. For a given amount of bone the most effective means to increase resistance to torsional loads is to distribute the material farther from the central axis, thus when subjected to greater torsional stresses bone remodeling will produce a long bone of greater circumference and thinner bone walls (Cowin Reference Cowin1987). As such, converting midshaft circumferences to minimums was required to make the measurements equivalent. This involved calculating the difference between log10 midshaft circumference and log10 least circumference in specimens present in both data sets. The mean of the differences was then subtracted from midshaft circumferences to give an estimated least circumference. Species averages were used, except when specimens were listed as indeterminate members of a particular genus, family, or the clades Tetanurae or Theropoda. These specimens were treated as separate data points. Taxa that have since been found to be nomina dubia were removed, and any synonyms were merged. This protocol yielded a sample size of 100, with 78 of these being identified to the species level.
Tibia length and least-circumference measurements for nonavian theropods were mostly taken from Christiansen (Reference Christiansen1999a) and Carrano (Reference Carrano1998b), with additional data added from Benson (Reference Benson2010). As with the femoral data, Christiansen (Reference Christiansen1999a) used least-shaft circumferences and Carrano (Reference Carrano1998b) used midshaft circumferences. The same procedure as outlined for femoral measurements was used to make the two data sets compatible. As with the femora, a linear regression of the differences between log10 circumferences of specimens in both data sets against the equivalent Carrano (Reference Carrano1998b) measurements found no significant relationship between the differences and increased circumference (multiple R 2=0.011; adjusted R 2=−0.065; p=0.706). The total sample size was 58, with 42 identified to the species level.
Quadratic regressions were used to test for a curvilinear relationship between femoral length and circumference and between tibiotarsal length and circumference using R, Version 3.01.0 (R Core Development Team 2014). This method has previously been used to test for nonlinear scaling between limb-bone length and diameter in carnivoran and bovid mammals (Bertram and Biewener Reference Bertram and Biewener1990). This is a more objective means of testing for nonlinear scaling in birds, as there is no a priori reasoning for assuming an inflection point at any given size that could be used as a dividing point between “small” and “large” species in this clade. All data were log10 transformed and centered on the mean before analysis. Centering of the data was carried out to reduce multicollinearity between the predictor variables (Kraemer and Blasey Reference Kraemer and Blasey2004). Linear and quadratic models were both derived as a function of centered circumference. The second-order variable was produced by squaring the centered circumferences. Quadratic models were compared with linear models using Akaike’s information criterion corrected for small sample size (AICc) (Akaike Reference Akaike1973; Hurvich and Tsai Reference Hurvich and Tsai1989). AICc weights were generated using the aictab function in the R package AICcmodavg (Mazerolle Reference Mazerolle2015). A higher AICc weight indicates an increased likelihood that a model fits the data better than other candidate models (Mazerolle Reference Mazerolle2006). For the avian data set, species’ averages were used for regression, with the exception that several subspecies were treated as separate data points because they exhibited substantial differences in size. These were Dromaius novaehollandiae ater (Heupink et al. Reference Heupink, Huynen and Lambert2011), Dromaius novaehollandiae baudinianus (Worthy et al. Reference Worthy, Hand and Archer2014), Euryapteryx curtus curtus (Worthy and Scofield Reference Worthy and Scofield2012), Euryapteryx curtus gravis (Worthy and Scofield Reference Worthy and Scofield2012), Gallirallus australis australis, and Gallirallus australis scotti.
Whether relatedness between taxa affects the significance of the quadratic term was tested in nonavian theropods using phylogenetic generalized least squares (PGLS). Consensus phylogenetic trees were constructed using matrix representation parsimony (MRP) (Baum Reference Baum1992; Ragan Reference Ragan1992) in the program PAUP, Version 4.0b10, by means of a heuristic search (see Supplementary Appendix S2 for source trees). MRP allows trees to be combined by coding the placement of each taxon within each tree using a matrix of binary characters that represent the nodes on each tree (Baum Reference Baum1992; Ragan Reference Ragan1992). Source trees were selected based on species coverage and represent the most recent, well-supported phylogenetic hypotheses (Supplementary Appendix S2). All theropods in the data set were included, with the exception of those listed as Theropoda or Tetanurae indeterminate. Specimens listed as family indeterminate were coded so that they were free to be placed anywhere within the family specified (Supplementary Appendix S2, Supplementary Fig. S3). Due to the high number of permutations caused by a number of individuals being listed as family or genus indeterminate, the number of trees generated was limited to 100,000. Of these, 1000 trees were selected randomly without replacement and dated using age ranges from the Paleobiology Database. The trees were time-scaled using the timePaleoPhy function in the paleotree package in R (Bapst Reference Bapst2012), with minimum branch lengths set to 1 million years. Quadratic PGLS regressions were carried out on femoral and tibiotarsal data for each tree using the gls function in the nlme package (Pinheiro et al. Reference Pinheiro, Bates, DebRoy and Sarkar2014). The correlation structure was defined by tree topology of the residual error, and tip heights were used to set fixed variance weights to account for unequal tip heights. To account for multiple comparisons, the p-values were adjusted using the Benjamini–Hochberg (BH) correction (Benjamini and Hochberg Reference Benjamini and Hochberg1995).
A modified version of this analysis was carried out using the avian data set. Prior to tree generation, taxa of uncertain affinity and/or lacking in dating information were excluded. This protocol trimmed the data set to 47 taxa. The dromornithids, Genyornis newtoni and Dromornis stirtoni, and Diatryma were coded as “?” for nodes representing the basal split of Galloanserae and the base of Anseriformes (see Murray and Vickers-Rich Reference Murray and Vickers-Rich2004; Mayr Reference Mayr2010, Reference Mayr2011). As a result, 52 trees were generated. These trees were time-scaled in the same way as the nonavian theropod trees, with the exception that the dates used were a combination of molecular divergence dates and stratigraphic ranges, due to the former being unavailable in a number of cases (Supplementary Appendix S2). In the case of extant taxa, first appearance dates were set to the date of molecular divergence and last appearance dates to the present. To account for the fact that molecular divergence dates do not necessarily indicate the presence of the extant species but instead the origination of the lineage leading to that species, timePaleoPhy was set to add terminal ranges so that tips corresponded to last appearance dates rather than first appearances.
To test for differences between avian phylogenetic groups, separate standard major axis (SMA) regressions for the ratites (n=20), Galloanserae (n=12), Gruiformes (n=24), and Rallidae (n=22) in the avian femoral data set were carried out using the smatr package (Warton et al. Reference Warton, Duursma, Falster and Taskinen2012). These same groupings were used for the tibiotarsal data. Pairwise comparisons of these slopes were carried out using the slope.com function, which tests the likelihood of the bivariate data from different groups sharing a common slope. SMA intercepts were compared using two-tailed t-tests provided by an R function that prevents the alteration of the true slopes that occurs in standard t-tests of intercepts (Campione and Evans Reference Campione and Evans2012). To account for multiple comparisons, p-values from all tests were adjusted using the BH correction (Benjamini and Hochberg Reference Benjamini and Hochberg1995). For the nonavian theropod femoral data set, SMA regressions were carried out for Ceratosauria (n=9), Allosauroidea (n=10), Tyrannosauroidea (n=19), Tyrannosauridae (n=11), Ornithomimidae (n=10), Maniraptora (n=27), Oviraptorosauria (n=12), and Deinonychosauria (n=11). For the tibial data set, SMA regressions were carried out for the Ceratosauria (n=9), Tyrannosauroidea (n=11), Ornithimimidae (n=8), and Maniraptora (n=11).
Results
Flightless Avian Femora
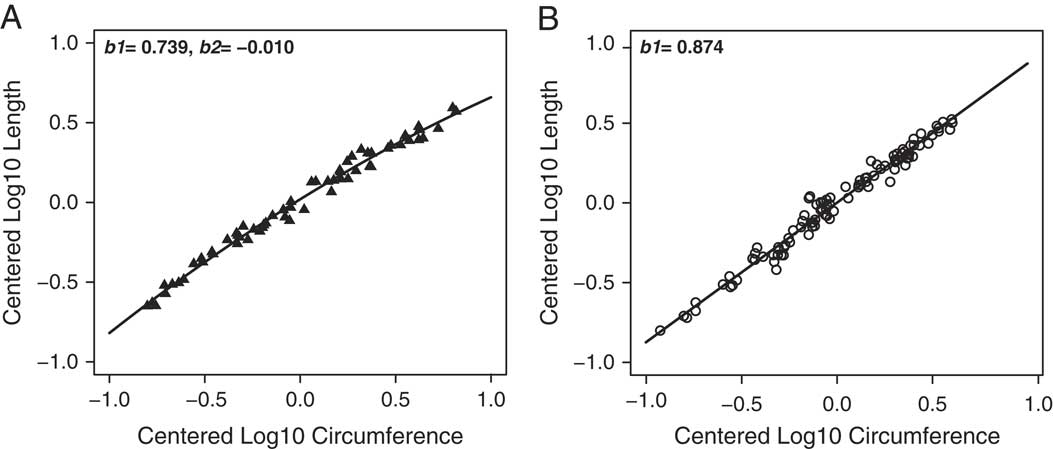
Quadratic regression of femoral least circumference versus length of femur in flightless birds found a significant negative shift in the slope coefficient with the addition of the second-order polynomial (Table 1, Fig. 1). AICc weights of the linear and quadratic models indicate a 100% probability that the quadratic model provides a better fit to the data (Table 1).
Best-fitting regression models for femoral measurements of flightless birds (A) and nonavian theropods (B); b1 is the linear coefficient; b2 is the quadratic coefficient. A quadratic model provided the best fit to the data for birds, whereas a linear model was the preferred solution for the nonavian theropod data.
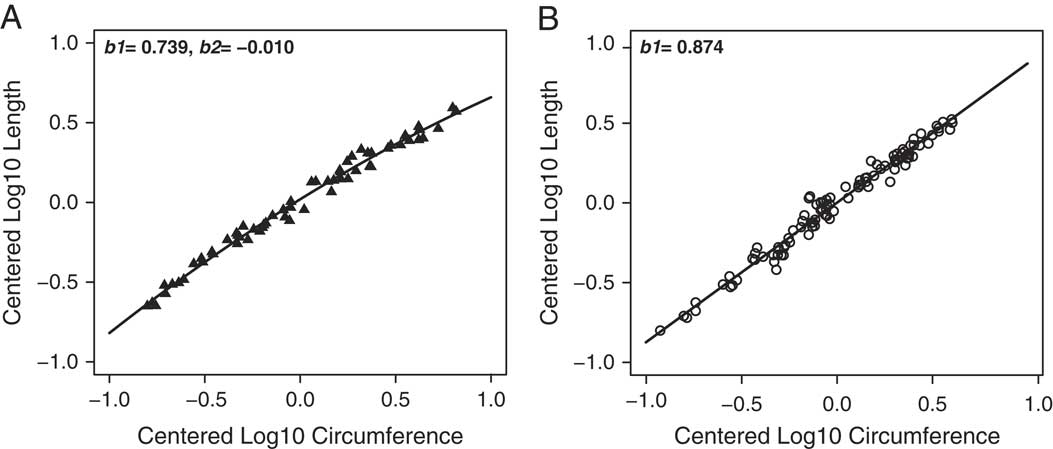
Quadratic regressions of length versus least circumference for avian and nonavian (N-a) theropod femora and tibiotarsi; b1, linear coefficient; b2, coefficient for second-order polynomial; AICcWt, Akaike weight. Significance level of coefficients is indicated with asterisks: *, 0.05; **, 0.01; ***, 0.001.

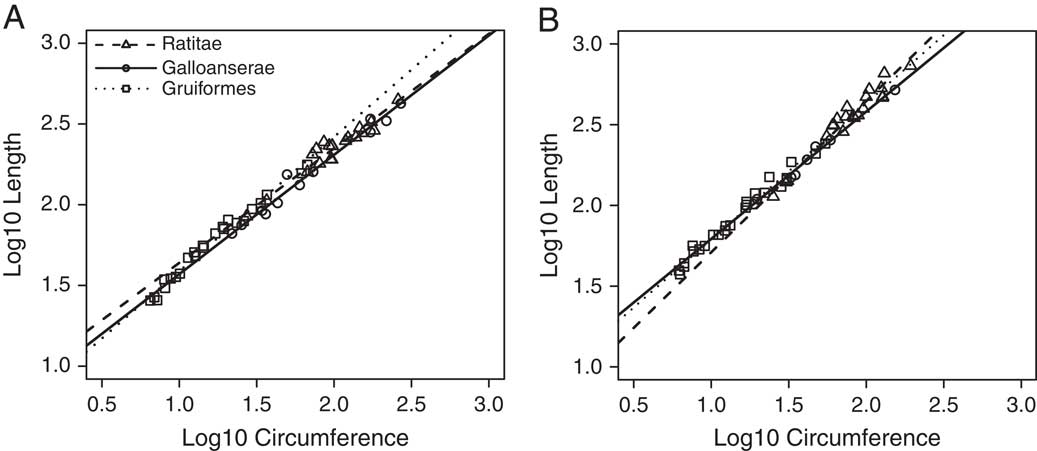
Prior to adjustment of p-values, the PGLS quadratic term indicated a negative shift in the coefficient and was always significant (<0.05) regardless of the tree used, with p-values varying between 0.020 and 0.040. Quadratic coefficients of the regressions varied between −0.082 and −0.070. After adjustment, all p-values were marginal (0.040). Quadratic regression of the trimmed data set without phylogenetic correction also found a marginally significant, negative quadratic term (b2=−0.075, p=0.045). These PGLS results should be interpreted with caution due to the combination of minimum and maximum dates used to time-scale the tree. As a result, the different branch lengths may not accurately reflect true divergence dates for a number of species. In addition, a sufficiently long period of evolutionary separation has occurred between certain lineages for covariance to have become minimal. For example, in the data set the closest relative of the flightless parrot, Strigops habroptilus, is a cariamiform (Psilopterus lemoinei). These lineages have likely been separated since the Paleocene (Mayr Reference Mayr2014). Thus, in these cases phylogenetically controlled generalized least squares may have overestimated covariation between taxa. However, in other parts of the tree, lineages have been separated for relatively short periods of time. For instance, several of the flightless rallids may have diverged from their volant relatives within a few hundred thousand years (Kirchman Reference Kirchman2012). With these considerations in mind, the similarity between phylogenetically corrected and uncorrected regressions suggests that reduced significance of the quadratic term in the former is due to reduced sample size rather than the phylogenetic effects. This interpretation is supported by removal of Rallidae from the sample. The rails occupy the lower end of the x-axis (Fig. 2), so to test whether curvilinear scaling was caused by differences between the smaller rallids and other taxa, the nonphylogenetically corrected quadratic regression was repeated with this group removed. Despite removal of 22 data points, the quadratic term remained significant, albeit at a weaker level (Table 1).
Femoral (A) and tibiotarsal (B) scaling of flightless birds from three phylogenetic groups. Fitted lines are based on SMA regression results (see Table 2).
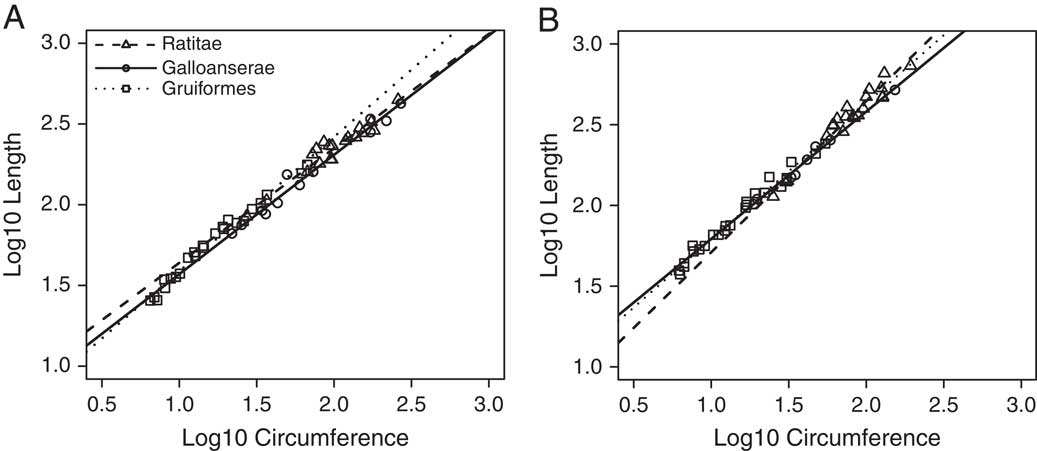
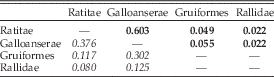
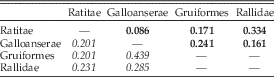
CIs for slope coefficients and intercepts from SMA regressions overlap for the majority of the phylogenetic groups (Table 2). The only exception was the nonoverlapping 95% CIs of the slope coefficients for Rallidae and Ratitae, with Rallidae scaling with a higher slope coefficient (0.873 compared with 0.700). Pairwise comparisons found the Rallidae coefficient to be significantly different from both the ratite and Galloanserae slopes after BH correction of p-values (Table 3). The Gruiformes and Ratitae slopes were also found to be significantly different from each other (Table 3). These results are likely due to rails occupying the lower end of the x-axis (Fig. 2) and therefore scaling with a higher coefficient than the larger ratites.
Standard major axis regressions of femoral dimensions for avian groupings including 95% confidence intervals for intercepts (a) and slopes (b).

p-Values from pairwise comparisons of avian femoral standard major axis regression coefficients (bold) and intercepts (italics) corrected for multiple comparisons using BH correction (Benjamini and Hochberg Reference Benjamini and Hochberg1995).

The overall avian SMA regression indicates that femoral length scales with negative allometry (b<1) with respect to least-shaft circumference.
Nonavian Theropod Femora
Quadratic regression of femoral least circumference (x) and length (y) of nonavian theropods found no significant change in slope coefficient with the addition of the second-order polynomial (Table 1). AICc weights indicate that the linear regression model has a marginally greater likelihood of fitting the data better than the quadratic model (Table 1).
Prior to correction of p-values, 984 out of 1000 PGLS quadratic regressions found the quadratic term to be significant, with the coefficient varying between −0.137 and −0.075. After BH correction, p-values for slope changes varied between 0.031 and 0.075 and were significant in 983 out of 1000 cases. Thus, significance rarely depended on the patterns of divergences within the tree.
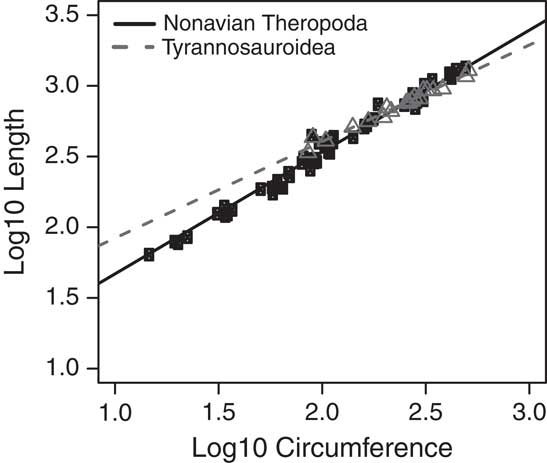
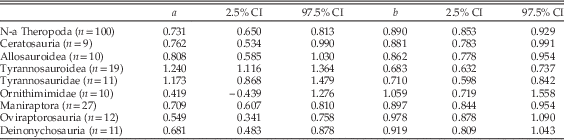
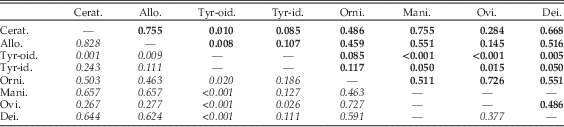
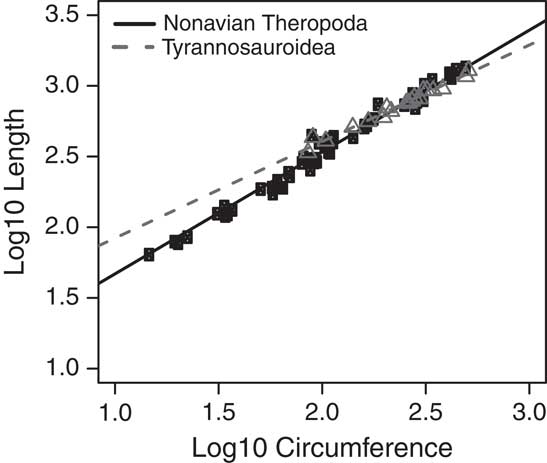
SMA regressions show that tyrannosauroids and tyrannosaurids scale with lower slope coefficients and higher intercepts than all other theropod groupings (Fig. 3, Table 4). These two groupings exhibit similar slope and intercept values, with the tyrannosaurids exhibiting broader confidence intervals for both values, which is likely to be due to a decrease in sample size (from 19 to 11). Given the similarities between the two groupings and the fact that one is subset of the other, for the remainder of this section only the tyannosauroid regression is considered. Pairwise comparisons found significant differences between the regression coefficients of Tyrannosauroidea and all other clades, with the exception of Ornithomimidae (Table 5).
Femoral scaling of all nonavian theropods combined and tyrannosauroids. Fitted lines based on results of SMA regressions (see Table 4).
Standard major axis regressions of femoral dimensions for nonavian theropod (N-a) groups including 95% CIs for intercepts (a) and slopes (b).

p-Values of pairwise comparisons of nonavian theropod femoral standard major axis regression coefficients (bold) and intercepts (italics) after BH correction for multiple comparisons (Benjamini and Hochberg Reference Benjamini and Hochberg1995). Abbreviations are as follows: Cerat., Ceratosauria; Allo., Allosauroidea; Tyr-oid, Tyrannosauroidea; Tyr-id., Tyrannosauridae; Orni., Ornithomimidae; Mani., Maniraptora; Ovi., Oviraptorosauria; Dei., Deinonychosauria.

A substantial difference in size exists between Gigantoraptor erlianensis and the next largest oviraptorosaur, Anzu wyliei (Xu et al. Reference Xu, Tan, Wang, Zhao and Tan2007; Lamanna et al. Reference Lamanna, Sues, Schachner and Lyson2014). Given the disproportionate effect of points at the ends of the regression, a separate Oviraptorosauria SMA regression was carried out with G. erlianensis excluded. This produced a coefficient of 0.965 (95% CI 0.809–1.151) and an intercept of 0.572 (95% CI 0.248–0.896). The similarity to the original regression (Table 5) indicates that the gross proportions of the femur of G. erlianensis appear to have been attained through continuation of a linear relationship between femoral length and circumference in smaller oviraptorosaurs.
The tyrannosauroid slope combines a substantially higher intercept and a slower increase in length with circumference compared with other nonavian theropods. In other words, smaller tyrannosauroids appear to have longer femora compared with other taxa with similar femoral circumferences, but as size increases tyrannosauroid femora become more robust at a faster rate than other nonavian theropods.
Regression coefficients indicate that, in general, the length of nonavian theropod femora scales with negative allometry with respect to femoral circumference (Table 3). Compared with the flightless avian coefficients, this relationship is closer to geometric similarity (b=1). Thus, femoral robustness increases more rapidly in flightless birds than in nonavian theropods. The higher intercept seen in the flightless bird regressions (Table 2) is probably due to the smaller sizes that are represented on the avian x-axis, with these smaller birds having more gracile femora than the larger nonavians, which are the smallest representatives of their group.
Flightless Avian Tibiotarsi
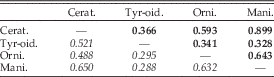
Quadratic regression of tibiotarsal least circumference versus length found no significant change in slope with the addition of the second-order polynomial (Table 1). AICc weights indicate a 76% probability that the linear model fits the data better than the quadratic regression. Quadratic phylogenetic least-squares regressions also found the quadratic term to be nonsignificant regardless of the tree used. The 95% CIs for slope coefficients and intercepts of SMA regressions exhibit overlap between all phylogenetic groupings with no significant differences found between slopes after BH correction of p-values from pairwise comparisons (Table 6, 7).
Standard major axis regressions of tibiotarsal dimensions for avian groupings including 95% CIs for intercepts (a) and slopes (b).

p-Values of pairwise comparisons of avian tibiotarsal standard major axis regression coefficients (bold) and intercepts (italics) after BH correction for multiple comparisons (Benjamini and Hochberg Reference Benjamini and Hochberg1995).

The scaling of tibiotarsal length against circumference is negatively allometric. However, the slope coefficient is closer to geometric similarity than the one generated for avian femora (Tables 2, 6).
Nonavian Theropod Tibia
Quadratic regressions of tibia least circumference versus length indicate a significant negative shift in slope coefficient with the addition of the second-order polynomial (Table 1). AICc weights indicate a probability of 91% that the quadratic regression better fits the data than the linear model. Phylogenetically controlled regressions also found quadratic coefficients to be highly significant (p≤0.002) in all 1000 analyses regardless of the topology of the tree, both before and after BH correction of the p-values. Quadratic coefficients varied between −0.281 and −0.186.
Pairwise comparisons of SMA regressions of the different phylogenetic groups found no significant differences between the clades either in the slopes or intercepts. However, CIs for both intercepts and slope coefficients were broader than those found in femoral regressions (Table 8). Pairwise comparisons of SMA regression coefficients found no significant differences between slopes, even prior to BH correction (Table 9). The tyrannosauroid coefficient was substantially affected by a single species, Calamosaurus foxi, a possible basal tyrannosauroid (Naish and Martill Reference Naish and Martill2007) that is the smallest tyrannosauroid in the data set and falls a considerable distance away from the remaining ones. Removal of Calamosaurus from the tyrannosauroid data set substantially reduced the slope coefficient and increased the intercept value (Table 8).
Standard major axis regressions of tibial dimensions for nonavian (N-a) theropod groupings including 95% CIs for intercepts (a) and slopes (b).

p-Values of pairwise comparisons of nonavian theropod tibial standard major regression coefficients (bold) and intercepts (italics) after BH correction for multiple comparisons (Benjamini and Hochberg Reference Benjamini and Hochberg1995). Abbreviations are as described for Table 5.

Regression coefficients show that tibial length scales with negative allometry with respect to circumference in nonavian theropods (Tables 1, 8).
Discussion
With the addition of a negative quadratic component, the already negative allometric relationship between femoral length and circumference becomes even more pronounced in flightless birds. This indicates that not only do avian femora become more robust with increased size but that length increases at a lower rate with respect to circumference in larger taxa. The curvilinear relationship found here occurs despite the fact that few of these animals obtained masses close to the cutoff point between small and large theropods (300 kg) used to test nonlinear scaling in these animals (Christiansen Reference Christiansen1999a). It is suggested here that the anterior center of mass and the associated subhorizontal orientation of the femur constrains the rate of femoral length increase in larger birds to maintain the position of the knee under the center of mass, while circumference continues to increase. This conclusion is supported by experimental manipulation of the center of mass by adding artificial tails to growing chickens (Grossi et al. Reference Grossi, Iriarte-Diaz, Larach, Canals and Vásquez2014). The more posterior center of mass caused by the addition of the artificial tail led to a more vertical orientation and a lengthening of the femur compared to nonaltered individuals and to individuals that had additional weight, equivalent to the mass of the artificial tail, added near the natural center of mass (Grossi et al. Reference Grossi, Iriarte-Diaz, Larach, Canals and Vásquez2014). The slower rate of increase in femoral length with increased size combined with variation related to leg function (Zeffer et al. Reference Zeffer, Johansson and Marmebro2003; Doube et al. Reference Doube, Yen, Kłosowski, Farke, Hutchinson and Shefelbine2012) provides an explanation as to why femoral length performs worse than circumference as a predictor of avian body mass (Field et al. Reference Field, Lynner, Brown and Darroch2013; Campione et al. Reference Campione, Evans, Brown and Carrano2014).
Femoral length in nonavian theropods also scales with negative allometry with respect to circumference, indicating an increase in femoral robusticity with increased size. Support for a curvilinear relationship between femoral length and circumference in nonavian theropods was found only in phylogenetically controlled analyses. Standard major axis regressions indicate that tyrannosauroid femora scale with increasing robusticity at a higher rate than other nonavian theropods. These results suggest that underlying the phylogenetic variation in femoral scaling is a functional signal of femoral girth increasing relative to length in larger theropods. Christiansen’s (Reference Christiansen1999a) analyses of limb-bone scaling were not corrected for phylogenetic covariation, thus the nonlinear scaling found in the previous study was likely caused by scaling differences between phylogenetic groups. Tyrannosauroids dominate the largest body-size class of Christiansen’s (Reference Christiansen1999a) data set. As shown by this study (Fig. 3, Table 5), tyrannosauroid femora increase in robusticity at a higher rate than other nonavian theropods. Tyrannosauroids are well sampled in this study, and this clade includes smaller basal taxa such as Timimus (Benson et al. Reference Benson, Rich, Vickers-Rich and Hall2012) and large, derived tyrannosaurids (Supplementary Appendix S2, Supplementary Fig. S3). This combination of smaller, gracile forms and gigantic, robust forms within the same clade is the probable cause of the higher intercept and lower slope coefficient in the SMA regression of femoral dimensions.
Phylogenetic covariation does not affect the nonlinear relationship between femoral length and circumference in birds. Combined with the lack of variation between clades, this indicates a stronger functional constraint in the femoral morphology of birds than seen in nonavian theropods. This is probably due to the more posterior center of mass in the latter, which would not have required the femur to reorientate in order to reposition the knee (Gatesy Reference Gatesy1990, Reference Gatesy1991). The restricted femoral length of birds compared with nonavian theropods means that rotation of the femur contributes much less to stride length in birds than was likely in nonavian theropods (Carrano 1998; Rubenson et al. Reference Rubenson, Lloyd, Besier, Heliams and Fournier2007). However, the relative contribution of femoral rotation to stride length increases with increasing velocity of locomotion in small birds (Stoessel and Fischer Reference Stoessel and Fischer2012). In addition to lengthening and a more vertical orientation of the femur in experimental chickens, Grossi et al. (Reference Grossi, Iriarte-Diaz, Larach, Canals and Vásquez2014) found a concurrent increase in femoral rotation during walking. The more anterior center of mass, shortened femur, and low degree of femoral rotation during locomotion seen in extant birds therefore appear to be inextricably linked to one another.
There is no support for a curvilinear relationship between length and circumference in flightless avian tibiotarsi. This finding supports the prediction that the proportions of avian tibiotarsi are not constrained in the same way as those of the femora (Gatesy Reference Gatesy1991; Stoessel et al. Reference Stoessel, Kilbourne and Fischer2013). Both phylogenetically controlled and uncontrolled regression analyses indicate curvilinear scaling in the tibia of nonavian theropods. This echoes the pattern of differential scaling between size classes found by Christiansen (Reference Christiansen1999a).
Studies finding curvilinear scaling in mammals suggested that this feature allows larger species to maintain similar levels of stress on the bones as in smaller taxa (Bertram and Biewener Reference Bertram and Biewener1990; Christiansen Reference Christiansen1999b,Reference Christiansenc; Carrano Reference Carrano2001). Mammals and nonavian theropods show a straightening of limb posture with increasing body size, leading to a decrease in bending strains, an increase in the effective mechanical advantage of the extensor muscles in the legs, and a decrease in the relative muscle mass required for locomotion (Biewener Reference Biewener1989; Gatesy and Biewener Reference Gatesy and Biewener1991; Carrano Reference Carrano2001; Hutchinson Reference Hutchinson2004). These changes may act in combination with a reduction in locomotor performance to reduce stresses placed upon the long bones so that larger species maintain similar stresses during locomotion to those seen in smaller taxa (Biewener Reference Biewener1982, Reference Biewener1990; Rubin and Lanyon Reference Rubin and Lanyon1984). Straightening of the limb bones can only occur to a certain point, after which an increase in the robustness of the limb bones through an increase in thickness or a decrease in bending moment arms through shortening of the bones is required to maintain a constant safety factor (i.e., the yield point of a structure divided by the force it encounters) (Bertram and Biewener Reference Bertram and Biewener1990; Biewener Reference Biewener1990; Christiansen Reference Christiansen1999a). The results presented here support the hypothesis of differential scaling between large and small species in the case of these nonavian theropods. However, the masking of this pattern by phylogenetic covariation and variation between clades suggests a degree of flexibility in the relationship between femoral proportions.
A previous study found increased femoral eccentricity (the discrepancy between diameters at different axes) and decreased femoral curvature in nonavian dinosaurs with increasing size (Carrano Reference Carrano2001). These features in combination with decreased locomotor capability may have been sufficient to prevent increased stress on the femur during locomotion in larger theropods. This may explain the greater degree of variation in femoral scaling in nonavian theropods, as changes in girth relative to length were not necessarily required to maintain tolerable stress levels. In contrast, the nonlinear scaling of tibial dimensions is not masked by phylogenetic variation, suggesting the loading regime of the tibia was different from that of the femur. Further comparative study on the cross-sectional properties of these bones in nonavian theropods and modeling of the strains incurred during locomotion are required to identify whether this is the case.
Curvilinear scaling of limb-bone dimensions within separate phylogenetic groups has been found in mammals (Christiansen Reference Christiansen1999b,Reference Christiansenc; Carrano Reference Carrano2001; Campione and Evans Reference Campione and Evans2012). For example, nonlinear scaling has been identified within Carnivora and Bovidae (Bertram and Biewener Reference Bertram and Biewener1990). It remains possible that the different phylogenetic groupings of nonavian theropods exhibit their own curvilinear scaling relationships. However, greater sample sizes for each grouping are required to test this hypothesis. Leg-bone lengths and circumferences are often used to produce body mass–predicting regression equations, which are generally applied to all nonavian theropods (e.g., Anderson et al. Reference Anderson, Hall-Martin and Russell1985; Christiansen and Fariña Reference Christiansen and Fariña2004). Thus, phylogenetic variation in the scaling relationships of these measurements has the potential to increase the uncertainty of estimates of mass produced using such methods.
External dimensions do not correlate linearly with the ability of the bone to withstand applied stresses (Doube et al. Reference Doube, Yen, Kłosowski, Farke, Hutchinson and Shefelbine2012). However, for a given amount of cross-sectional area of bone, avian femora show greater second and polar moments of area (indicative of increased resistance to twisting and bending) due to the distribution of bone farther from the central axis compared with mammals (Doube et al. Reference Doube, Yen, Kłosowski, Farke, Hutchinson and Shefelbine2012). This is an expected result of bone modeling under a torsion-dominated loading regime (Cowin Reference Cowin1987). A knock-on effect of this is that avian femora are broader and have greater circumferences for a given cross-sectional area of bone (Doube et al. Reference Doube, Yen, Kłosowski, Farke, Hutchinson and Shefelbine2012). Previous comparisons also show the diameters of avian femora to be relatively greater than those of nonavian theropods (Gatesy Reference Gatesy1991; Carrano 1998). In addition, femoral eccentricity increases with body size in bipedal nonavian dinosaurs, which indicates that the femora of large nonavian theropods are not as resistant to torsion as those of birds, which have a circular cross section (Carrano Reference Carrano2001; De Margerie et al. Reference De Margerie, Sanchez, Cubo and Castanet2005). As such, the relatively greater circumferences of avian femora compared to nonavian theropods are a partial reflection of the mechanical demands on this bone. Indeed, it has previously been suggested that the amount of torsion imposed upon the femur may limit the amount of force imposed upon the legs, and therefore limit body mass in birds (Gatesy Reference Gatesy1991). This, combined with the limit to femur length caused by the more anterior center of mass, as indicated by the results presented here, and resultant postural differences with nonavian theropods, means the proportions of this bone in birds are more severely constrained.
Conclusion
Nonlinear scaling of femoral length in terrestrial flightless birds leads to a more rapid relative shortening of the femur with increased size than a simple linear relationship would imply. It is suggested here that this pattern results from the femur being constrained to maintain the knee under the more anterior center of mass. This requirement in turn restricts the length of the bone. The absence of curvilinear scaling in the tibiotarsus confirms that these restrictions only affect the proximal leg bone. On the other hand, the curvilinear scaling in nonavian theropod femora is masked by the effects of phylogenetic covariation. Both this and the variation in femoral scaling between clades indicate that the length of this bone was not so constrained in this group.
All flightless avians are secondarily flightless, and it may be that the retention of a posture associated with the evolution of powered flight more strongly restricted mass than was the case with the ancestrally flightless nonavian theropods.
Acknowledgments
I am grateful to K. Roberts, E. Fitzgerald (Museum Victoria), A. Tennyson (Museum of New Zealand Te Papa Tongarewa), H. James, M. Florence, C. Milensky (National Museum of Natural History, Smithsonian Institute), B. Gill (Auckland War Memorial Museum), M.-A. Binnie (South Australian Museum), and J. Sladek (Australian Museum) for access to collections. Thanks go to M. Carrano for providing the data from his Ph.D. thesis and F. Degrange for measurements of Psilopterus lemoinei. I also thank G. Lloyd, who provided advice on phylogenetic analyses. This article was considerably improved by comments from J. Alroy, M. Carrano, N. Campione, M. Laurin, M. Bonnan, and two anonymous reviewers.
Supplementary Material
Data available from the Dryad Digital Repository: http://dx.doi.org/10.5061/dryad.h77n8