1 Introduction
Transport of droplets and bubbles in confined environments is a common process in engineering applications, such as microscale heat transfer and cooling using a slug flow (Kandlikar Reference Kandlikar2012; Magnini, Pulvirenti & Thome Reference Magnini, Pulvirenti and Thome2013), enhanced oil recovery based on foam injections where bubbles move in porous media (Farajzadeh, Andrianov & Zitha Reference Farajzadeh, Andrianov and Zitha2009), and microfluidic engineering using droplets as micro-reactors (Song, Chen & Ismagilov Reference Song, Chen and Ismagilov2006) and cell-encapsulating micro-compartments (He et al. Reference He, Edgar, Jeffries, Lorenz, Shelby and Chiu2005), to name a few. The study of transported droplets in confined dimensions also extends to biological science, where red blood cells traversing passages with non-axisymmetric geometries were analysed (Halpern & Secomb Reference Halpern and Secomb1992).
Pioneering work has been initiated for a long bubble translating inside a straight cylindrical tube by Taylor (Reference Taylor1961) conducting experiments and Bretherton (Reference Bretherton1961) combining experiments and asymptotic analysis. The analysis of Bretherton showed that the lubrication equations, at a very small capillary number
 $Ca$
, were similar to their one-dimensional (1-D) version assuming spanwise invariance. He established the famous asymptotic relation between the uniform film thickness
 $H_{\infty }$
and the capillary number in the
 $Ca<10^{-3}$
regime, namely,
 $H_{\infty }/W=P(3Ca)^{2/3}/2$
, where
 $W$
is the tube diameter and
 $P$
is a coefficient. The capillary number
 $Ca=\unicode[STIX]{x1D707}_{o}U_{d}/\unicode[STIX]{x1D6FE}$
is built with the carrier phase dynamic viscosity
 $\unicode[STIX]{x1D707}_{o}$
, the droplet velocity
 $U_{d}$
and the surface tension
 $\unicode[STIX]{x1D6FE}$
between the two fluids. Aussillous & Quéré (Reference Aussillous and Quéré2000) proposed
 $$\begin{eqnarray}\frac{H_{\infty }}{W}=\frac{1}{2}\,\frac{P(3Ca)^{2/3}}{1+PQ(3Ca)^{2/3}},\end{eqnarray}$$
as the Taylor’s law including an empirical coefficient
 $Q=2.5$
, with the coefficient
 $P$
inherited from Bretherton (Reference Bretherton1961); this law was validated against the experimental data of Taylor (Reference Taylor1961) for
 $Ca<2$
. The empirical relation was rationalized by incorporating into the analysis of Bretherton the so-called ‘tube-fitting’ condition, namely, that the bubble–film combination should fit inside the tube (Klaseboer, Gupta & Manica Reference Klaseboer, Gupta and Manica2014). Besides those works considering the steady translation, Yu et al. (Reference Yu, Zhu, Shim, Eggers and Stone2018) have recently investigated how the lubrication film evolves between two steady states of a Bretherton bubble by combining theory, experiments and simulations.
Contrary to the translating bubble in a capillary tube, a bubble moving in a Hele-Shaw cell (two closely gapped parallel plates) resembles a flattened pancake. This configuration is relevant to microfluidic applications (Baroud, Gallaire & Dangla Reference Baroud, Gallaire and Dangla2010) where the thickness of the microfluidic chips is much smaller than their horizontal dimension. Owing to the mathematical similarity between the governing equations of the depth-averaged Hele-Shaw flow and those of the two-dimensional (2-D) irrotational flow, as proved by Stokes (Reference Stokes1898) and commented upon by Lamb (Reference Lamb1993), potential flow theory was adopted to study the motion of a Hele-Shaw bubble theoretically (Taylor & Saffman Reference Taylor and Saffman1959) and numerically (Tanveer Reference Tanveer1986). Based on the stress jump derived by Bretherton (Reference Bretherton1961) and Park & Homsy (Reference Park and Homsy1984), 2-D depth-averaged simulations including the leading-order effects of the dynamic meniscus were also carried out (Meiburg Reference Meiburg1989).
Motivated by the applications of droplet-based microfluidics, several works have recently been conducted to investigate the dynamics of a pressure-driven Hele-Shaw droplet. Huerre et al. (Reference Huerre, Theodoly, Leshansky, Valignat, Cantat and Jullien2015) and Reichert et al. (Reference Reichert, Huerre, Theodoly, Valignat, Cantat and Jullien2018) performed high-precision experiments using the reflection interference contrast microscopy technique to study pressure-driven droplets, observing the so-called ‘catamaran’ droplet shape. Simulations based on a finite volume method (Ling et al. Reference Ling, Fullana, Popinet and Josserand2016) and a boundary integral method (BIM) (Zhu & Gallaire Reference Zhu and Gallaire2016) were carried out, confirming such a peculiar interfacial feature. It has to be mentioned that the much earlier work of Burgess & Foster (Reference Burgess and Foster1990) performing a multi-region asymptotic analysis subtly revealed this feature for a Hele-Shaw bubble, which went rather unnoticed.
Limited work has been conducted for the gravity-driven droplets in a Hele-Shaw cell. Eri & Okumura (Reference Eri and Okumura2011) and Yahashi, Kimoto & Okumura (Reference Yahashi, Kimoto and Okumura2016) studied such configurations experimentally, trying to build up the scaling laws for the viscous drag friction of the Hele-Shaw droplets. Recently, Keiser et al. (Reference Keiser, Jaafar, Bico and Reyssat2018) conducted experiments to study a sedimenting Hele-Shaw droplet, focusing on its velocity as a function of confinement, viscosity contrast and the lubrication capacity of the carrier phase.
In this work, we combine experiments, simulations and a lubrication model solved numerically to study the buoyancy-driven translation of a droplet inside a vertical Hele-Shaw cell. We examine the droplet velocity, film thickness and how they vary with the density and viscosity difference between the droplet and carrier phase. We introduce the experimental set-up in § 2, followed by the experimental results of the droplet mean velocity and film thickness in §§ 3.1 and 3.2, respectively. The comparison between the three-dimensional (3-D) BIM simulations and the experiments is shown in § 3.3. The lubrication equation employed to model the problem is presented in § 4, where the numerical solution of the lubrication equation is compared to the 3-D simulation results in § 4.1. The film thickness pattern is rationalized by solving the linearized 2-D lubrication equation, which is presented in § 4.2. We finally summarize our results in § 5 with some discussions.
2 Experimental set-up
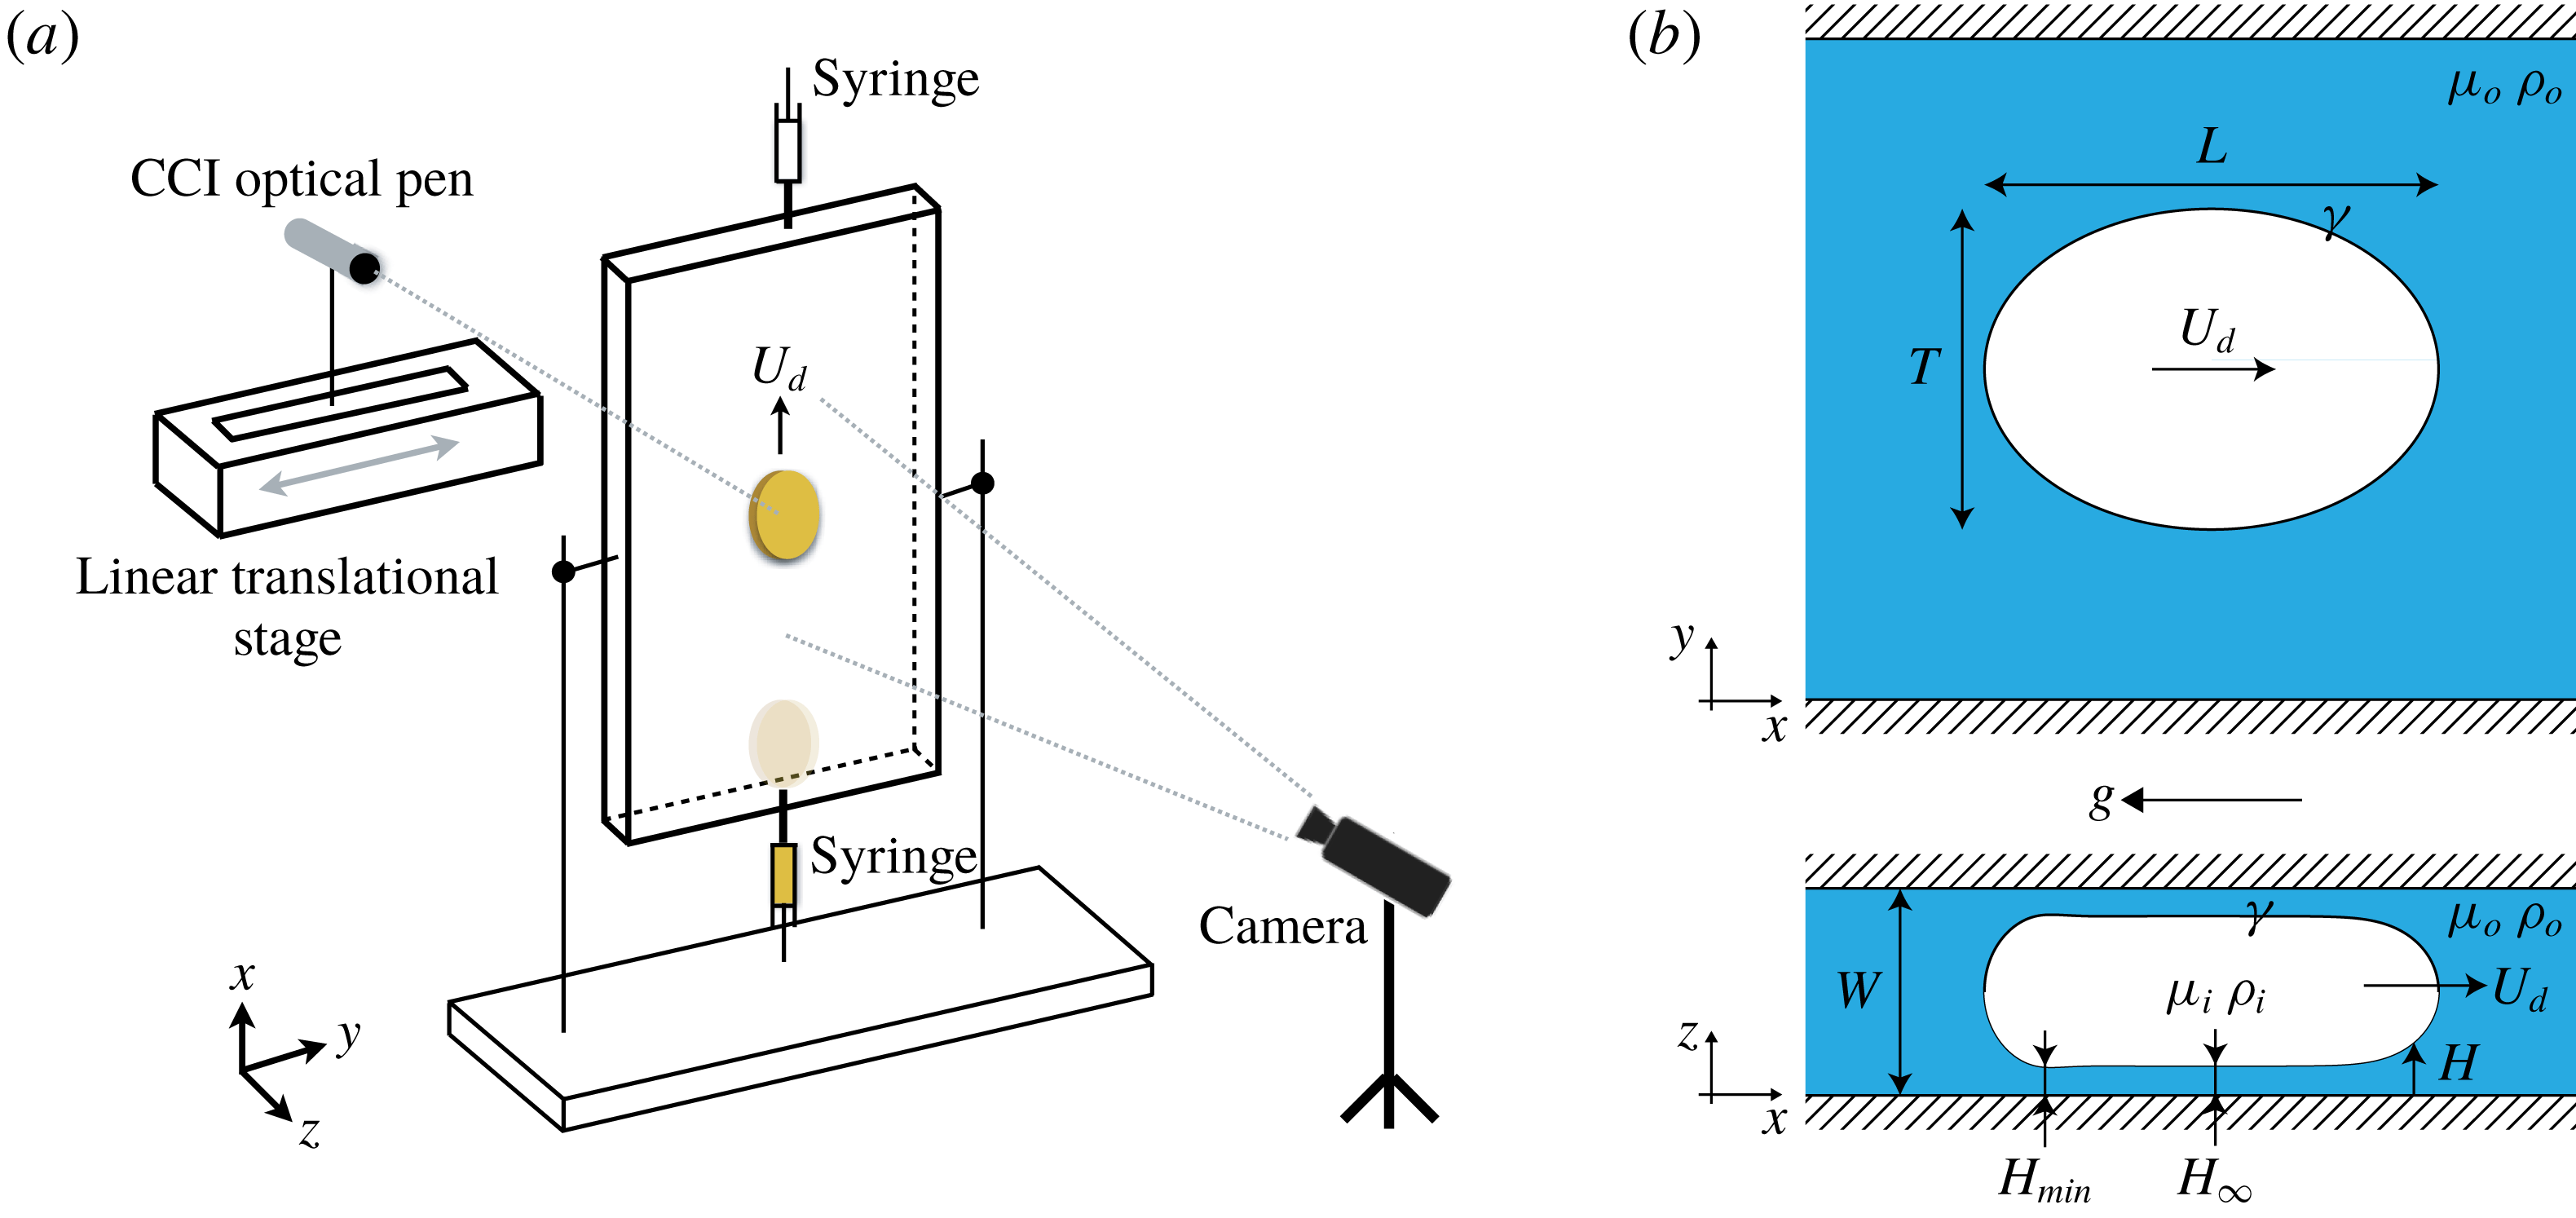
(a) Schematic of the experimental set-up. (b) Sketch of the problem: a droplet with density
 $\unicode[STIX]{x1D70C}_{i}$
and dynamic viscosity
 $\unicode[STIX]{x1D707}_{i}$
moving at velocity
 $U_{d}$
in a Hele-Shaw cell of height
 $W$
, where the carrier phase has a dynamic viscosity
 $\unicode[STIX]{x1D707}_{o}$
and its density
 $\unicode[STIX]{x1D70C}_{o}>\unicode[STIX]{x1D70C}_{i}$
. The in-plane (
 $x,y$
) projection shows the drop’s longitudinal and transverse lengths,
 $L$
and
 $T$
, respectively. The out-of-plane (
 $x,z$
) drop shape shows the thickness
 $H_{\infty }$
of the uniform thin film and the minimum thickness
 $H_{min}$
of the film along the centreline.

A vertical Hele-Shaw cell made of two parallel glass plates, separated by a gap
 $W$
, is filled with silicone oil of dynamic viscosity 560 mPa s and density
 $972~\text{kg}~\text{m}^{-3}$
, measured at
 $20\,^{\circ }\text{C}$
. An oil drop is injected into the silicone oil medium from the bottom using a syringe as shown in figure 1(a). The drop moves as a result of buoyancy. The higher the density difference between the inner and outer medium, the higher the drop velocity
 $U_{d}$
. The spanwise and streamwise cell dimensions are sufficiently large compared to the drop size to avoid any finite size effects from the lateral walls. On the other hand, the droplet is highly confined in the wall-normal direction. The droplet radius
 $a$
is always larger than the cell gap
 $W$
. Given the compliance of the glass walls, the thickness of which is bounded by our optical measurement tools, the cell gap
 $W$
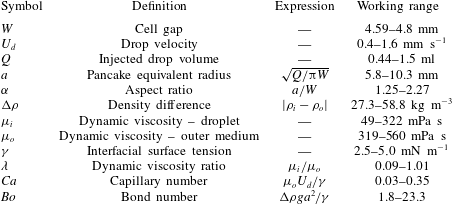
lies in the range of [4.59–4.8] mm and is recorded every time before the drop injection (see table 2).
The injected oils are tested beforehand to ensure non-wetting conditions for the oil droplet on the cell plates. The outer silicone oil totally wets the glass plate and forms a thin film of thickness
 $H$
, between the drop and the glass’s interface (see figure 1
b), which is measured using a confocal chromatic imaging (CCI) optical pen (see details in appendix A). The pen is either placed fixed such that it measures the film thickness only along the centreline
 $L$
(centreline film thickness) or mounted on a linear translational stage to perform lateral scans while the drop moves longitudinally. With an acquisition frequency of 200–500 Hz, scanning amplitude of 20–30 mm and frequency of 2–3 Hz, the obtained experimental data are interpolated in MATLAB to obtain the film thickness maps for the entire drop. Droplet size and velocity determine the optimal acquisition frequency for the thickness sensor, and the scanning amplitude and frequency for the linear translational stage.
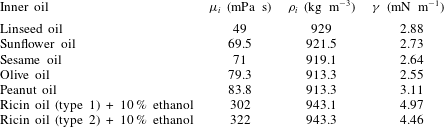
Dynamic viscosity
 $\unicode[STIX]{x1D707}_{i}$
and density
 $\unicode[STIX]{x1D70C}_{i}$
of the inner oils. Those of the outer oil are
 $\unicode[STIX]{x1D707}_{o}=560~\text{mPa}~\text{s}$
and
 $\unicode[STIX]{x1D70C}_{o}=972~\text{kg}~\text{m}^{-3}$
, except for the case of ricin (type 2)
 $+10\,\%$
ethanol, for which the outer oil has
 $\unicode[STIX]{x1D707}_{o}=319~\text{mPa}~\text{s}$
and
 $\unicode[STIX]{x1D70C}_{o}=970.5~\text{kg}~\text{m}^{-3}$
. The interfacial surface tension between the inner–outer oils is
 $\unicode[STIX]{x1D6FE}$
. These properties were obtained at a room temperature of
 $20\,^{\circ }\text{C}$
.

We observe that for the chosen inner oil volumetric range, the droplet in-plane shape is no longer a circle but closer to an oval; hence we refer to the drop longitudinal length (along the direction of gravity) as
 $L$
and to the transverse length as
 $T$
, as shown in figure 1(b). The drop motion is captured using a Phantom Miro M310 camera with a Nikon 105 mm macro lens. The spatio-temporal analysis of the movie ensures uniform drop velocity as the drop moves along a longitudinal distance of
 $5L$
or more.
The drop volume
 $Q$
is expressed as a pancake of radius
 $a$
and height
 $W-2H_{\infty }$
, where
 $H_{\infty }$
is the mean film thickness. We can simplify
 $Q$
as
 $\unicode[STIX]{x03C0}a^{2}W$
when
 $H_{\infty }\ll W$
. For the volumetric range used for the inner oils, we found that the longitudinal and transverse lengths,
 $L$
and
 $T$
, scale as the pancake radius
 $a$
. The aspect ratio
 $\unicode[STIX]{x1D6FC}$
is expressed as the ratio
 $a/W$
. Keeping the cell gap
 $W$
fixed, data for different aspect ratios are obtained using three different volumes (0.5 ml, 1 ml and 1.5 ml) for each oil.
Six oils with physical properties as mentioned in table 1 are used. The surface tension
 $\unicode[STIX]{x1D6FE}$
between the inner and outer media is measured using a Teclis tensiometer, and the oil viscosity and density are measured using an Anton Paar
 $\text{SVM}^{\text{TM}}$
3000 viscometer. The experiment is performed at
 $20$
–
 $22\,^{\circ }\text{C}$
.
The ratio
 $\unicode[STIX]{x1D706}$
between the dynamic viscosity of the inner and outer phase lies in the range [0.09–0.54]. In addition to this range, another set of experiments is performed with
 $\unicode[STIX]{x1D706}=1.01$
, where the outer medium is silicone oil (
 $\unicode[STIX]{x1D707}_{o}=319~\text{mPa}~\text{s}$
,
 $\unicode[STIX]{x1D70C}_{o}=970.5~\text{kg}~\text{m}^{-3}$
) and the inner medium is a mixture of ricin oil and
 $10\,\%$
ethanol (
 $\unicode[STIX]{x1D707}_{i}=322~\text{mPa}~\text{s}$
,
 $\unicode[STIX]{x1D70C}_{i}=943.3~\text{kg}~\text{m}^{-3}$
) for three different drop volumes. The interfacial surface tension between these oils is
 $4.46~\text{mN}~\text{m}^{-1}$
. The notation for the physical parameters and their definitions is detailed in table 2.
List of notation, definitions and working ranges.

3 Experimental acquisition of the drop characteristics and their comparison with 3-D BIM simulations
3.1 Experimental results for drop velocity
Considering the bulk dissipation only, the resulting viscous drag force acting on the drop scales as
 $F_{d}\sim (\unicode[STIX]{x1D707}_{i}+\unicode[STIX]{x1D707}_{o})U_{d}\unicode[STIX]{x03C0}a^{2}W^{-1}$
. Unlike Okumura (Reference Okumura2018), we consider both the inner and outer viscosities since they are of the same order. Balancing the total drag force with the buoyancy force,
 $F_{g}\sim \unicode[STIX]{x0394}\unicode[STIX]{x1D70C}g\unicode[STIX]{x03C0}a^{2}W$
, we obtain a scaling for the droplet mean velocity as
 $$\begin{eqnarray}U_{d}\sim \frac{\unicode[STIX]{x0394}\unicode[STIX]{x1D70C}gW^{2}}{(\unicode[STIX]{x1D707}_{i}+\unicode[STIX]{x1D707}_{o})},\end{eqnarray}$$
where
 $\unicode[STIX]{x0394}\unicode[STIX]{x1D70C}$
is the density difference and
 $g=9.81~\text{m}~\text{s}^{-2}$
.
Under the assumption of cylindrical penny-shaped wetting drops, a theoretical expression for the drop velocity can be obtained from Maxworthy (Reference Maxworthy1986), Bush (Reference Bush1997) and Gallaire et al. (Reference Gallaire, Meliga, Laure and Baroud2014). Gallaire et al. (Reference Gallaire, Meliga, Laure and Baroud2014) deduced the drop velocity in a Hele-Shaw cell, subjected to both buoyancy and Marangoni flow, using depth-averaged Stokes equations, called the Brinkman equations. In the absence of the Marangoni effect and at leading order, Bush (Reference Bush1997) and Gallaire et al. (Reference Gallaire, Meliga, Laure and Baroud2014) predicted the mean drop velocity as
 $$\begin{eqnarray}U_{d}=\frac{\unicode[STIX]{x0394}\unicode[STIX]{x1D70C}gW^{2}}{12\unicode[STIX]{x1D707}_{o}(\unicode[STIX]{x1D706}+1)}.\end{eqnarray}$$
Introducing the Bond number
 $Bo$
(see table 2), we can rewrite (3.2) using the aspect ratio
 $\unicode[STIX]{x1D6FC}$
as
 $$\begin{eqnarray}12\unicode[STIX]{x1D6FC}^{2}(\unicode[STIX]{x1D706}+1)Ca=Bo.\end{eqnarray}$$
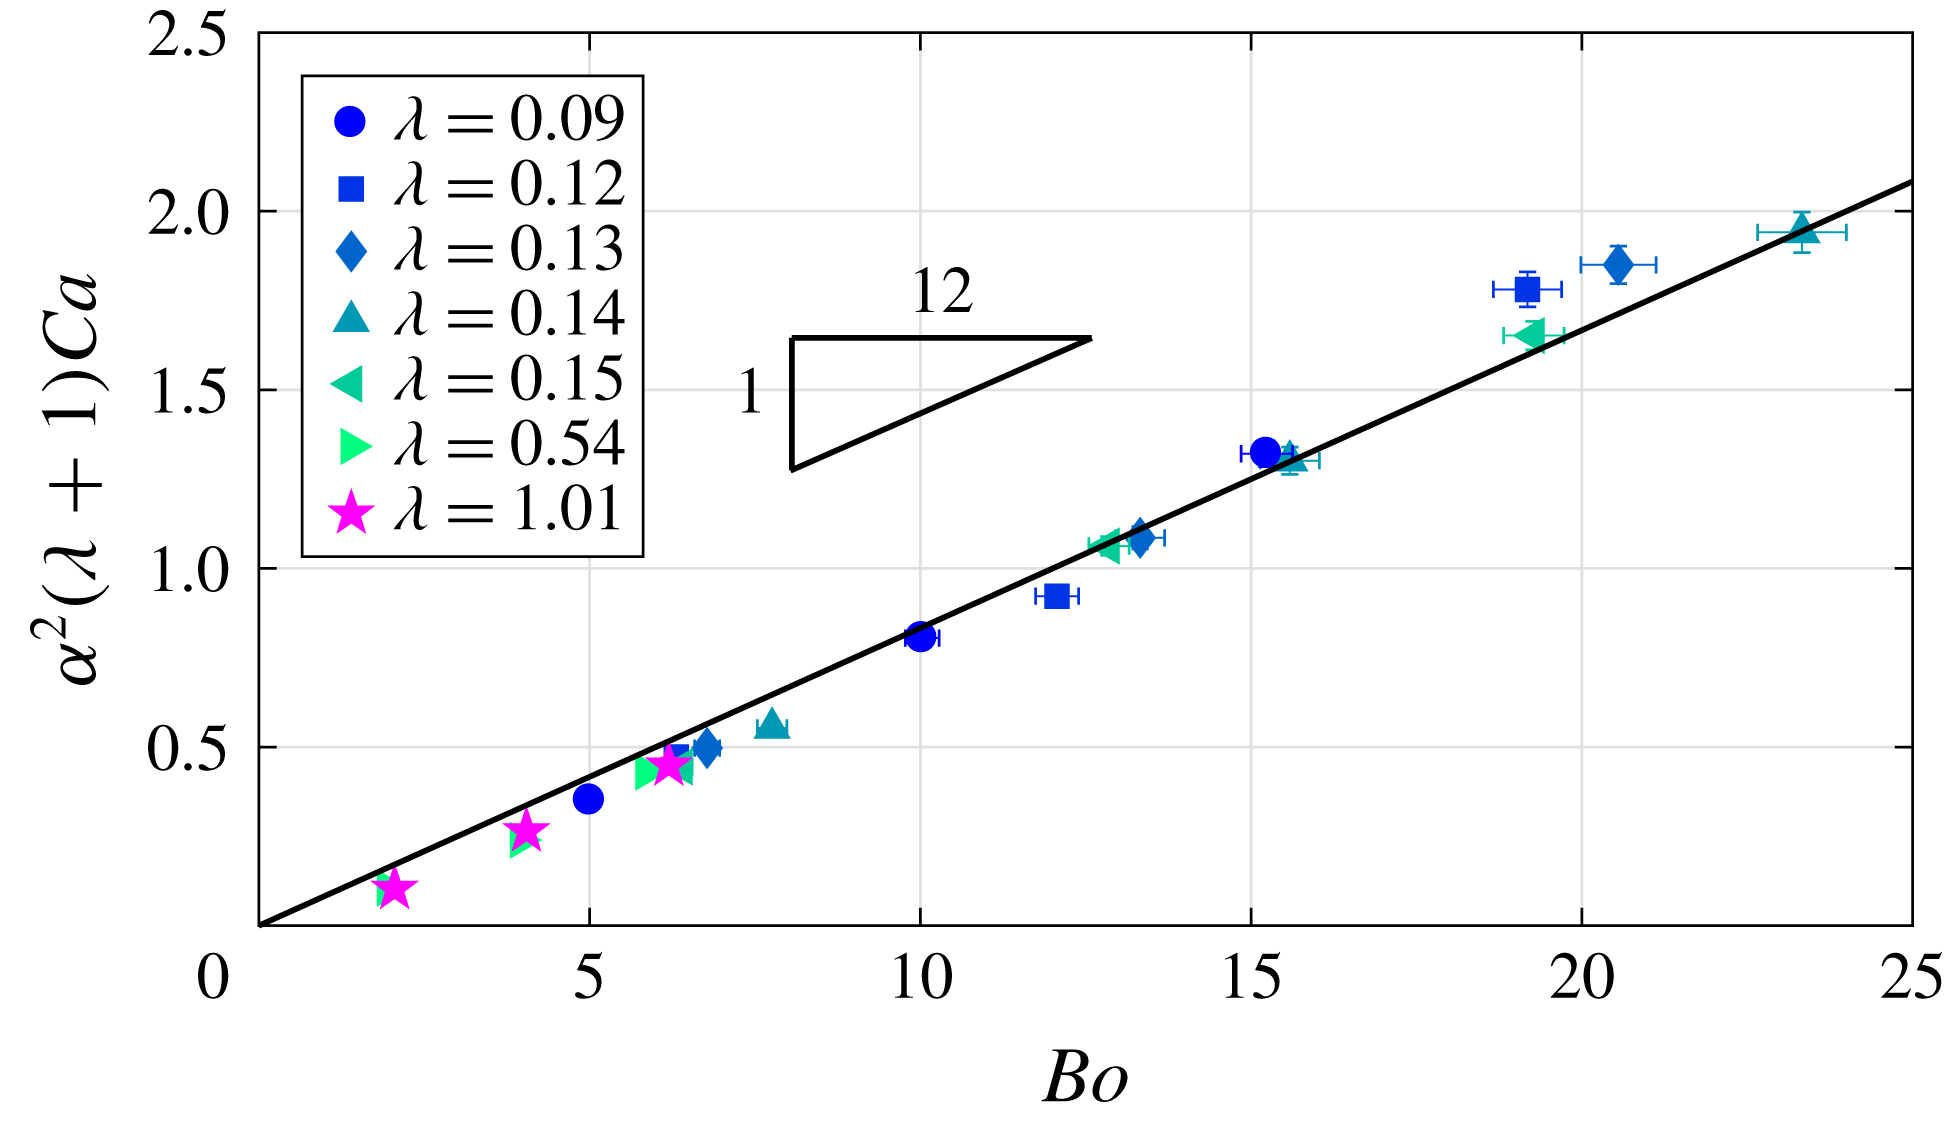
Experimental data
 $\unicode[STIX]{x1D6FC}^{2}(\unicode[STIX]{x1D706}+1)Ca$
versus the Bond number
 $Bo$
, where
 $Ca\in [0.03,0.35]$
. The markers correspond to different viscosity ratios
 $\unicode[STIX]{x1D706}$
of the inner–outer medium. The data closely fit (3.3) represented by the straight line.

The experimental data are plotted against the theoretical equation (3.3) in figure 2. Following the trend predicted by (3.3), figure 2 signifies that the dominant forces in play are buoyancy and viscous drag due to the volume of fluid displaced by the drop. The dissipation induced in the thin film as well as that in the dynamic meniscus region are found not to play a role in the selected parameter range. However, it has been observed that, for low
 $Ca$
ranges, the dissipation in the thin film (Keiser et al.
Reference Keiser, Jaafar, Bico and Reyssat2018) and in the dynamic meniscus (Reyssat Reference Reyssat2014) have to be taken into account.
3.2 Experimental results for film thickness
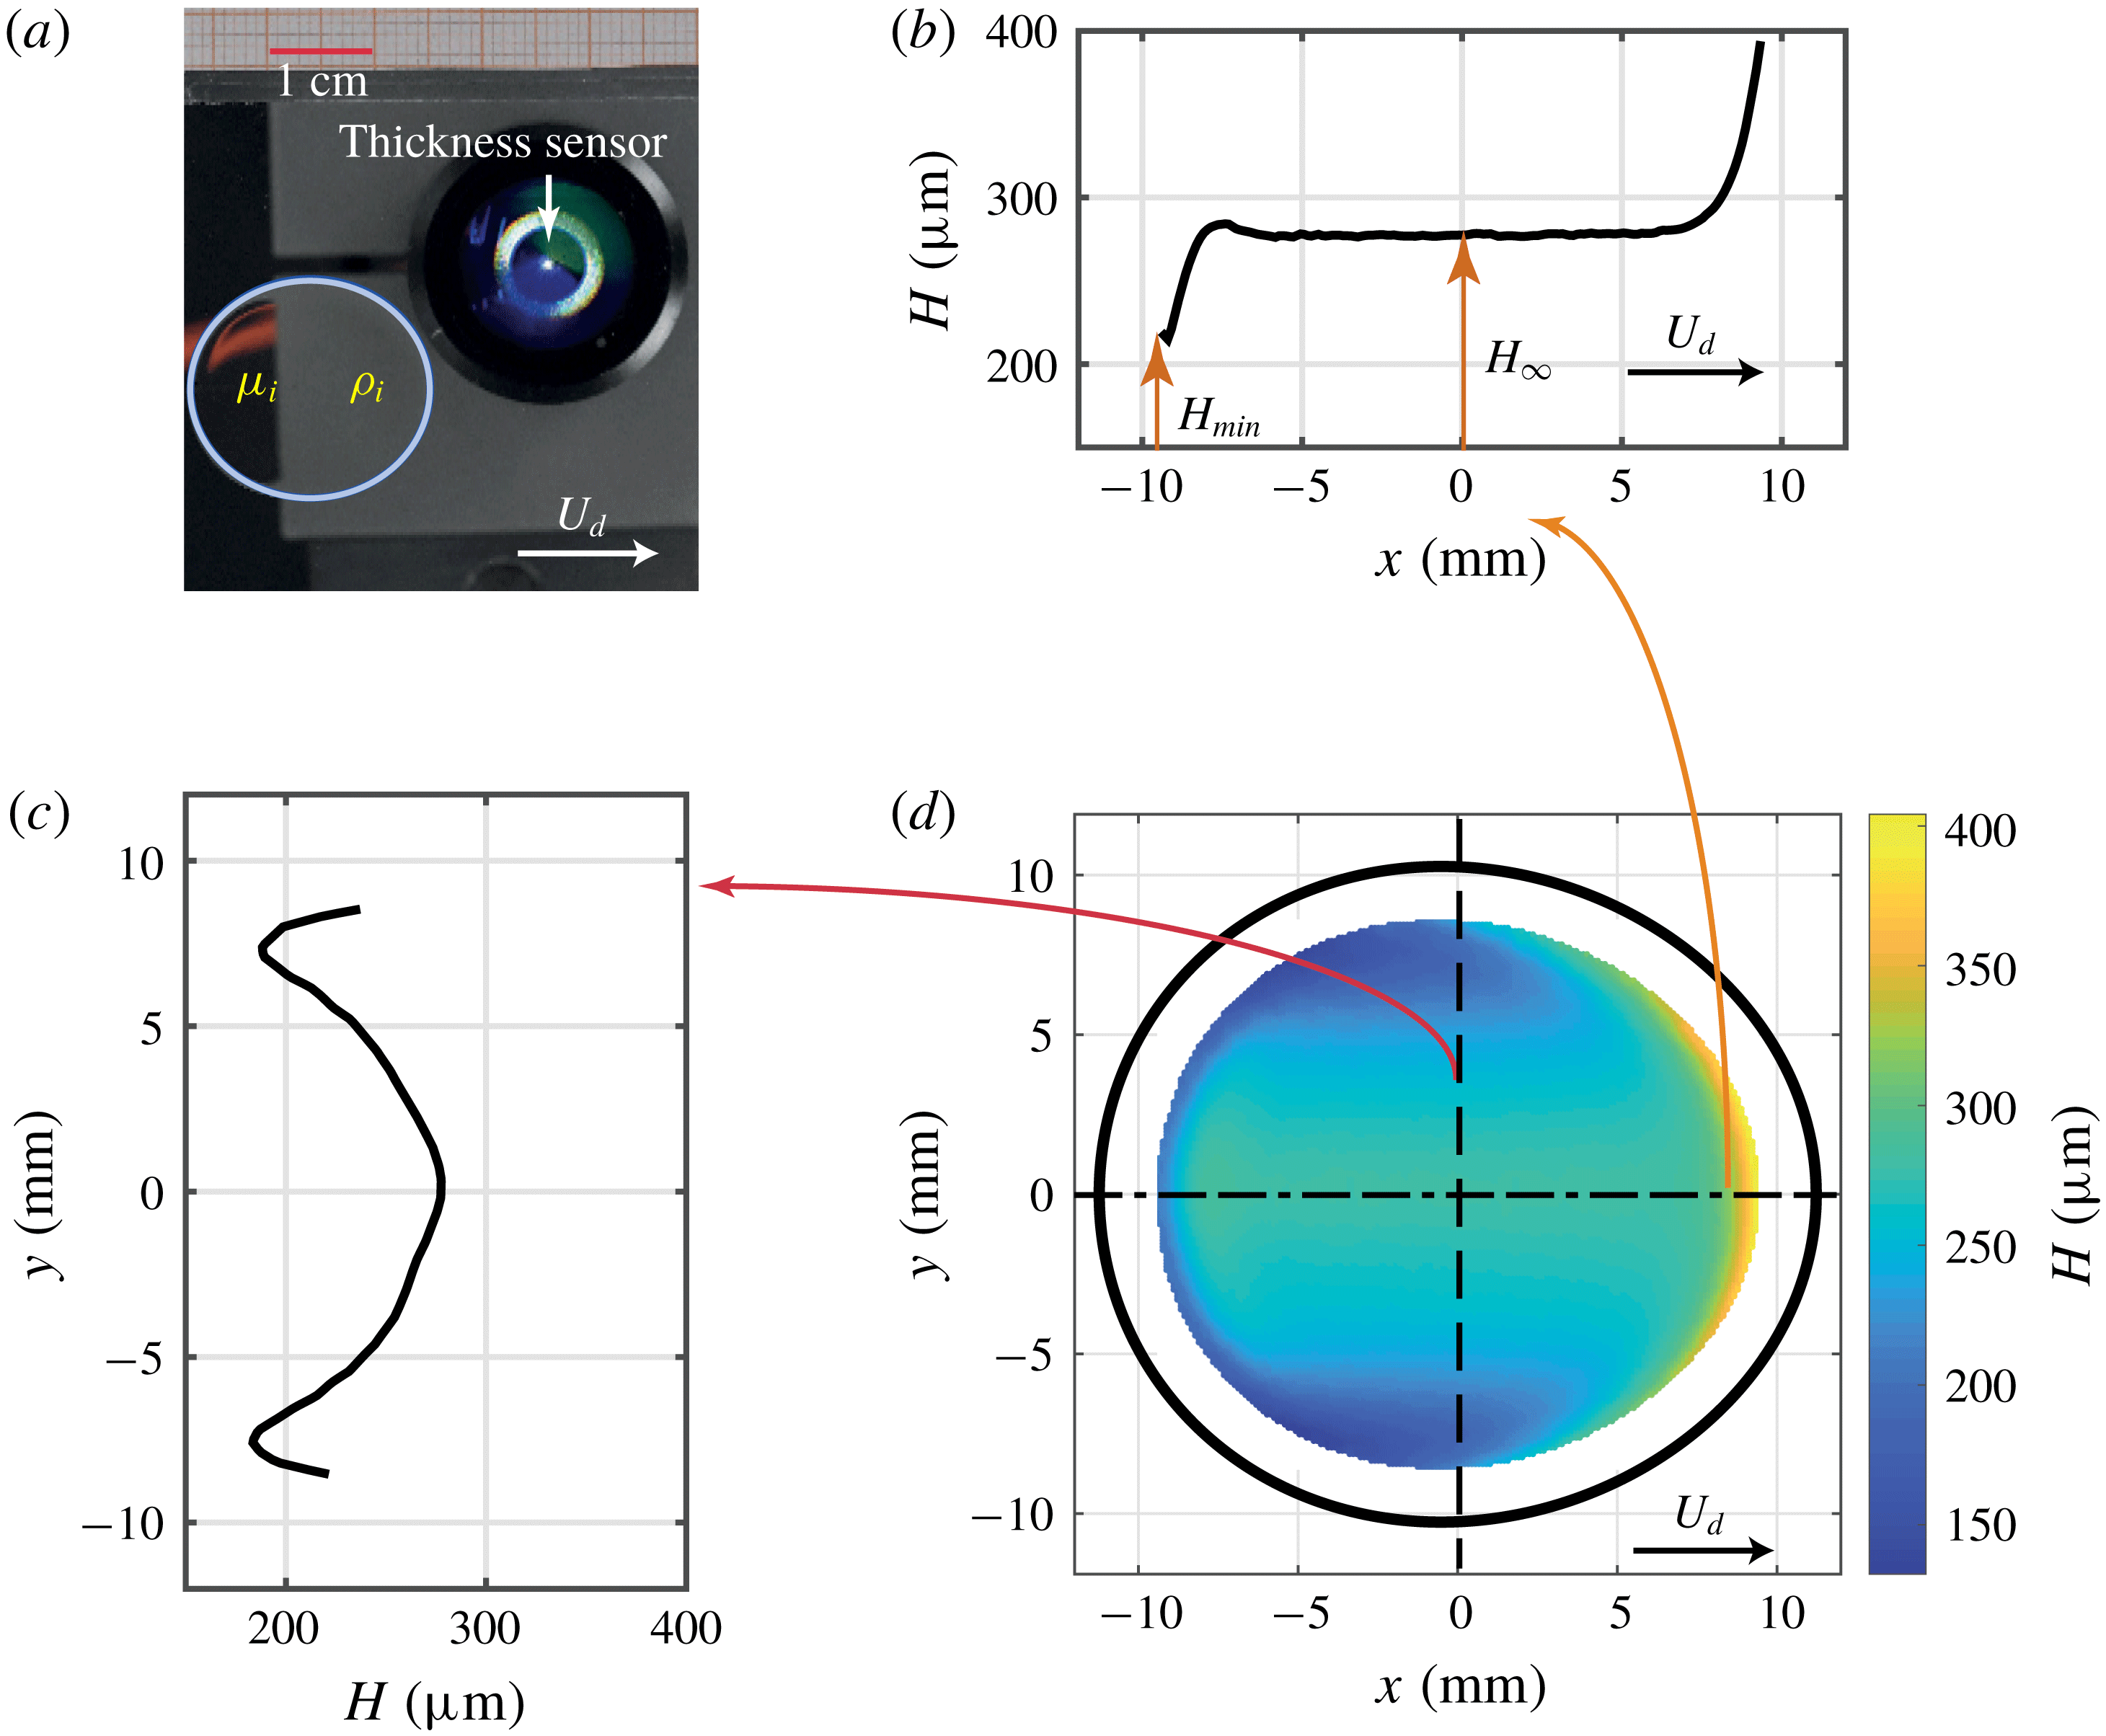
Film thickness maps were measured for different droplet velocities. Since the thickness sensor fails to capture the data in the presence of high thickness gradient, no data are acquired along the drop edges, as shown in figure 3(d), where the black curve represents the drop in-plane boundary. For different aspect ratios, qualitatively similar thickness maps were obtained, with a high film thickness on the front edge, a constant film thickness in the centre and very low film thickness along the lateral edges of the drop, overall resembling a catamaran-like shape. The spanwise and streamwise cut made along the film thickness are shown in figure 3(b,c). The centreline film thickness indicated by the streamwise cut at
 $y=0$
(figure 3
b) clearly shows a monotonically decreasing film thickness pattern, followed by a region of constant film thickness
 $H_{\infty }$
, which then reaches a minimum value of
 $H_{min}$
. At the rear of the droplet, the strong thickness gradient reverses direction, to have an increasing thickness profile close to the drop receding edge, thus posing technical issues to capture the film thickness.
Drop characteristics for a droplet with
 $\unicode[STIX]{x1D706}\sim 1$
moving with mean velocity
 $U_{d}=0.64~\text{mm}~\text{s}^{-1}$
,
 $Ca=4\times 10^{-2}$
and
 $Bo=6.2$
. (a) The blue curve shows the in-plane drop shape fitting based on (3.5) with
 $L/2=11.22$
mm,
 $T/2=10.21$
mm and fitting coefficient
 $c=-7.485\times 10^{-6}~\text{mm}^{-1}$
. The film thickness in the streamwise and spanwise directions
 $y=0$
and
 $x=0$
of the drop are shown in (b) and (c), respectively. (b) The typical centreline thickness profile with monotonically decreasing thickness, followed by constant thickness
 $H_{\infty }$
and ending with the minimum film thickness
 $H_{min}$
. (c) The film thickness profile along the spanwise direction highlights the two minima along the lateral edge of the drop at
 $y\sim \pm 7.5$
mm, which are clearly seen in panel (d), where we see the in-plane shape in black and the obtained film thickness map. The data are missing along the drop boundaries due to the presence of high thickness gradient that cannot be captured by the thickness sensor.

A similar centreline film thickness profile was obtained for all the droplets with a distinct value of
 $H_{\infty }$
and
 $H_{min}$
. These profiles are very similar to those of Bretherton (Reference Bretherton1961) for pressure-driven droplets, and as already noted in other works on pancakes (Huerre et al.
Reference Huerre, Theodoly, Leshansky, Valignat, Cantat and Jullien2015; Zhu & Gallaire Reference Zhu and Gallaire2016; Reichert et al.
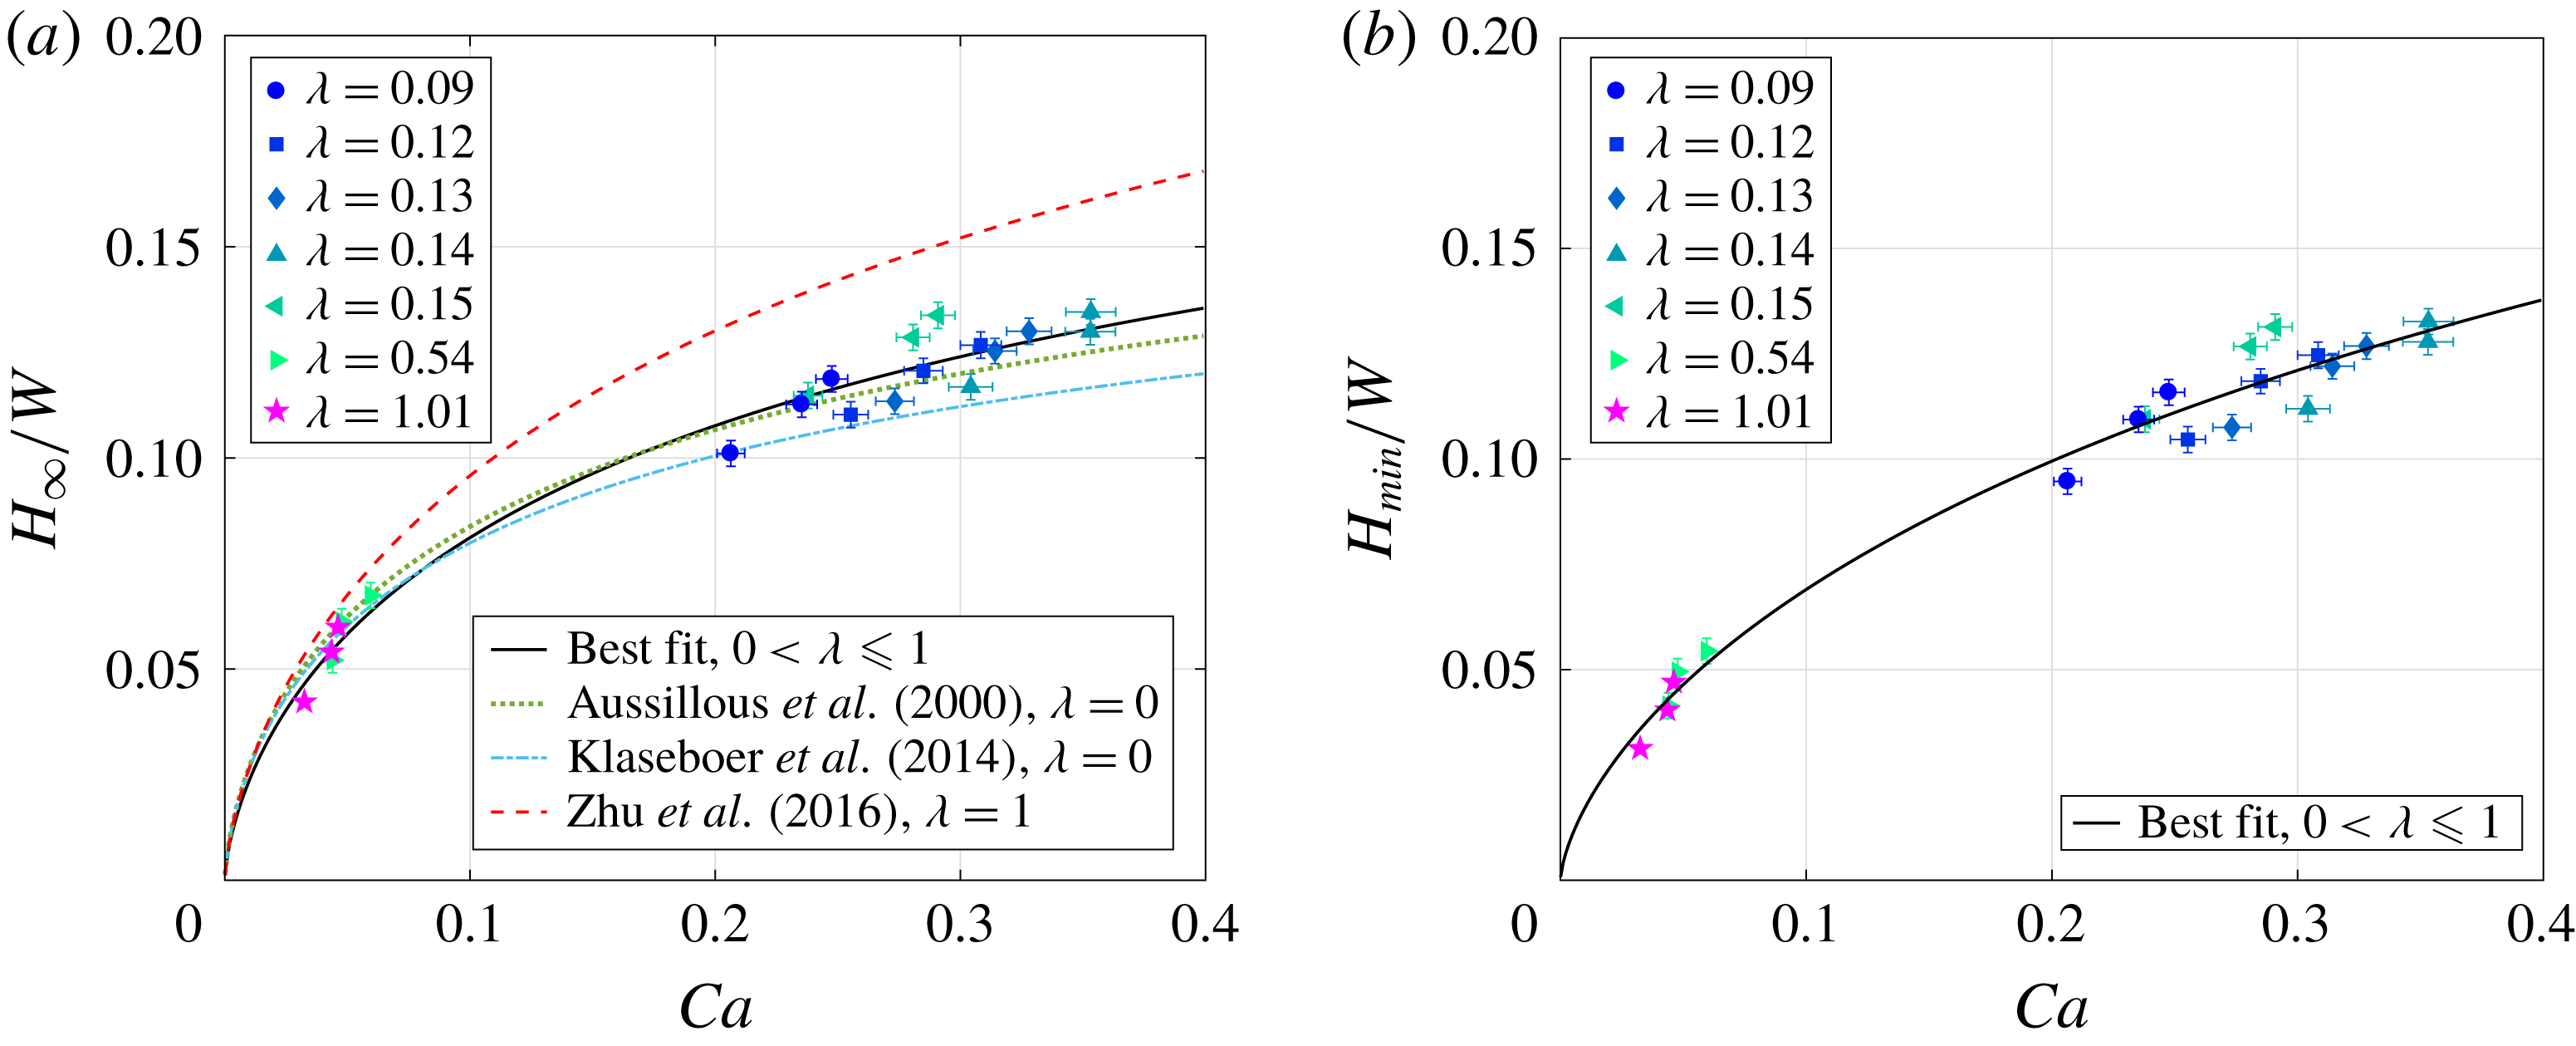
Reference Reichert, Huerre, Theodoly, Valignat, Cantat and Jullien2018). Non-dimensionalizing the mean and minimum values along the centreline using the cell gap
 $W$
and plotting them as a function of
 $Ca$
shows a saturating trend for higher
 $Ca$
(figure 4). The experimental data are fitted based on the Taylor’s law model (Taylor Reference Taylor1961; Aussillous & Quéré Reference Aussillous and Quéré2000), according to which, apart from the static and dynamic meniscus regions, the lubrication film has a constant thickness of
 $H_{\infty }$
given as
 $$\begin{eqnarray}\frac{H_{\infty }}{W}=\frac{1}{2}\,\frac{P(3Ca)^{2/3}}{1+PQ(3Ca)^{2/3}},\end{eqnarray}$$
where the coefficients
 $P=0.544$
and
 $Q=2.061$
are obtained from the best-fitting curve for the experimental data. The nonlinear equation (3.4) is fitted using the MATLAB function sseval such that the objective function, defined as the sum of squared errors between the real data of
 $H_{\infty }/W$
and those predicted by (3.4), using any pair of parameters
 $P$
and
 $Q$
, is the minimum. The
 $L2$
error norm for
 $H_{\infty }/W$
between the fitted and actual data is
 $0.02$
.
The fitting coefficients compare well with those of Aussillous & Quéré (Reference Aussillous and Quéré2000) and Klaseboer et al. (Reference Klaseboer, Gupta and Manica2014), where the mean film thickness model for bubbles (
 $\unicode[STIX]{x1D706}=0$
) is based on the Taylor’s law with coefficient
 $P=0.643$
, and
 $Q=2.5$
and
 $2.79$
, respectively. Fitting coefficients obtained from a 3-D BIM simulation of Zhu & Gallaire (Reference Zhu and Gallaire2016) for pressure-driven flows and
 $\unicode[STIX]{x1D706}=1$
show the same order of magnitude as the experimental ones, with
 $P=0.6$
and
 $Q=1.5$
.
In figure 4(a), we see that our experimental data for mean film thickness are bounded by the predicted values for the two extreme viscosity ratios of
 $\unicode[STIX]{x1D706}=0$
and
 $\unicode[STIX]{x1D706}=1$
. Comparing the thickness predictions by Klaseboer et al. (Reference Klaseboer, Gupta and Manica2014) and Zhu & Gallaire (Reference Zhu and Gallaire2016) for
 $Ca=0.1$
, we see that the thickness variation is
 $20\,\%$
as
 $\unicode[STIX]{x1D706}$
increases from 0 to 1. This is consistent with the
 $18\,\%$
(approximately) increase as reported in Martinez & Udell (Reference Martinez and Udell1990) for pressure-driven drops in an axisymmetric tube. Further, this variation in thickness reduces to a merely
 $11\,\%$
for
 $Ca=0.05$
, as
 $\unicode[STIX]{x1D706}$
changes from 0 to 1.
The same model when used for fitting the minimum film thickness profile
 $H_{min}/W$
gives fitting coefficients
 $P=0.372$
and
 $Q=1.247$
with an
 $L2$
error norm between the fitted and actual data as
 $0.025$
.
(a) Dimensionless mean (
 $H_{\infty }/W$
) and (b) minimum (
 $H_{min}/W$
) film thickness, as functions of Ca. The black curve represents the best-fitting curve obtained using the Taylor’s law model with
 $P=0.544$
and
 $Q=2.061$
for
 $H_{\infty }/W$
and with
 $P=0.372$
and
 $Q=1.247$
for
 $H_{min}/W$
. For the mean film thickness, predictions based on the coefficients
 $P$
and
 $Q$
from the Taylor’s law (Aussillous & Quéré Reference Aussillous and Quéré2000; Klaseboer et al.
Reference Klaseboer, Gupta and Manica2014; Zhu & Gallaire Reference Zhu and Gallaire2016) are also shown.

Motivated by the qualitative agreement for the mean film thickness value between the experimental data and the 3-D BIM simulations for pressure-driven droplets (figure 4 a), we perform a 3-D BIM simulation using the solver developed in Zhu & Gallaire (Reference Zhu and Gallaire2016), suitably adapted for gravity-driven droplets. The reader is referred to that paper for details of the numerical scheme.
3.3 Comparison with 3-D simulations
The current numerical simulations only address the cases where the inner and outer viscosities are the same, namely
 $\unicode[STIX]{x1D706}=1$
. To realize it experimentally, three different drop volumes, 0.44 ml, 1 ml and 1.5 ml, were injected into the Hele-Shaw cell, resulting in
 $Ca=0.032$
, 0.043 and 0.046, with the corresponding
 $Bo=1.81$
, 4.04 and 6.2. The error in volume injected decreased from
 $10\,\%$
to
 $3\,\%$
as we moved from the smallest to the largest drop volume.
The experimental film thickness maps for the chosen
 $Ca$
range show that the precise shape of the pancake in-plane shape is close to an oval. Hence, the experimental in-plane drop shape is obtained by fitting the following equation
 $$\begin{eqnarray}\frac{x^{2}}{(L/2)^{2}}+\frac{y^{2}}{(T/2)^{2}}\text{e}^{cx}=0,\end{eqnarray}$$
on an instantaneous image of the drop, where
 $c$
is a fitting parameter (figure 3
a).
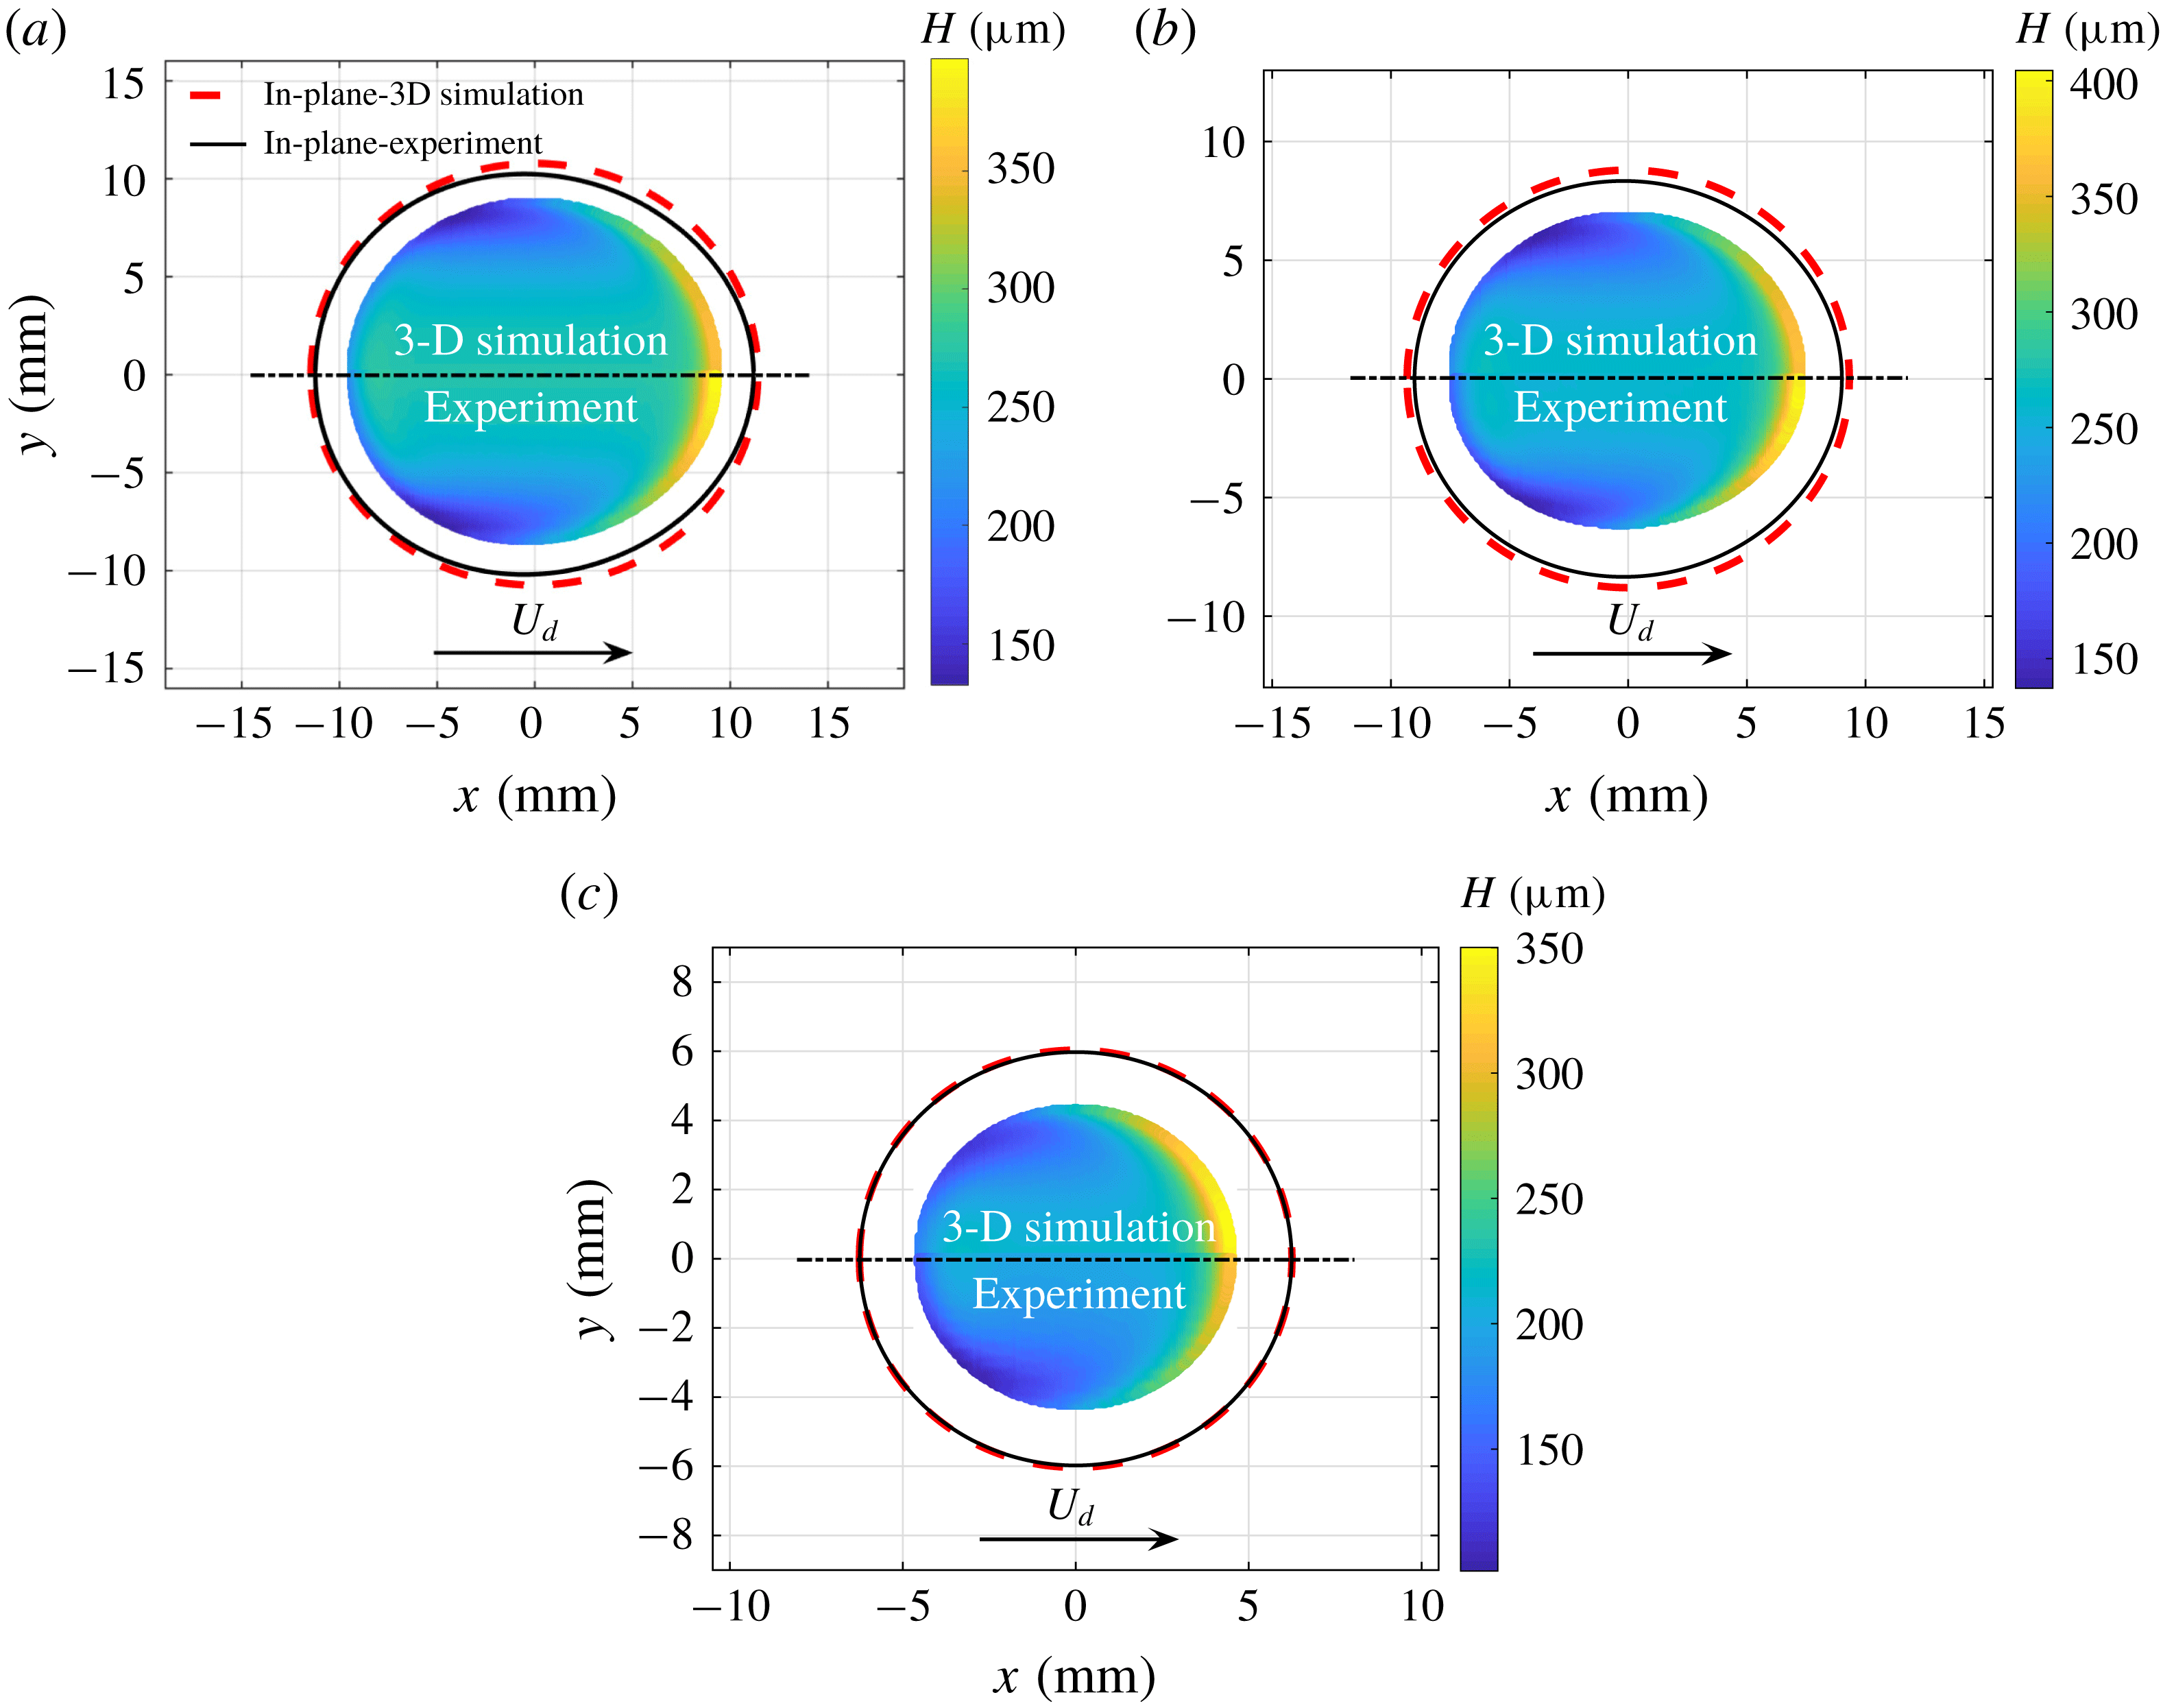
Film thickness map whose top (respectively bottom) half corresponds to the 3-D BIM (experimental) data for three drop volumes: (a) 1.5 ml (
 $Ca=0.046,~Bo=6.2$
); (b) 1 ml (
 $Ca=0.043,~Bo=4.04$
); and (c) 0.44 ml (
 $Ca=0.032,~Bo=1.81$
). The viscosity ratio
 $\unicode[STIX]{x1D706}\approx 1$
. The experimental and numerical in-plane shapes are represented by black and red dashed curves, respectively. The numerical results for
 $H_{\infty }$
along the centreline deviate from the experimental data by 2 %, 3 % and 5 %, respectively, for the three cases.

Experimentally, due to the large thickness gradient along the drop edges, the CCI sensor fails to capture the thickness in these regions. Thus the map is obtained for an area smaller than the in-plane shape of the drop (black curve in figure 5). In contrast, the numerical simulations are capable of retrieving the complete film thickness map; however, to make a visually effective comparison between the experiments and numerics, only the part of the numerical result with the same area as the experimental data is shown in figure 5. Its top (bottom) half corresponds to the numerical (experimental) data, respectively. The red dashed curve refers to the numerical in-plane shape of the drop.
Both the experiments and simulations capture the formation of catamarans at the lateral transition regions, a uniform film thickness in the centre and a very high film thickness at the front edge of the drop. The agreement is almost quantitative. The relative error in the uniform film thickness
 $H_{\infty }$
for drop volumes 0.44 ml, 1 ml and 1.5 ml is 5 %, 3 % and 2 %, with absolute values of
 $12~\unicode[STIX]{x03BC}\text{m}$
,
 $7~\unicode[STIX]{x03BC}\text{m}$
and
 $6~\unicode[STIX]{x03BC}\text{m}$
, respectively.
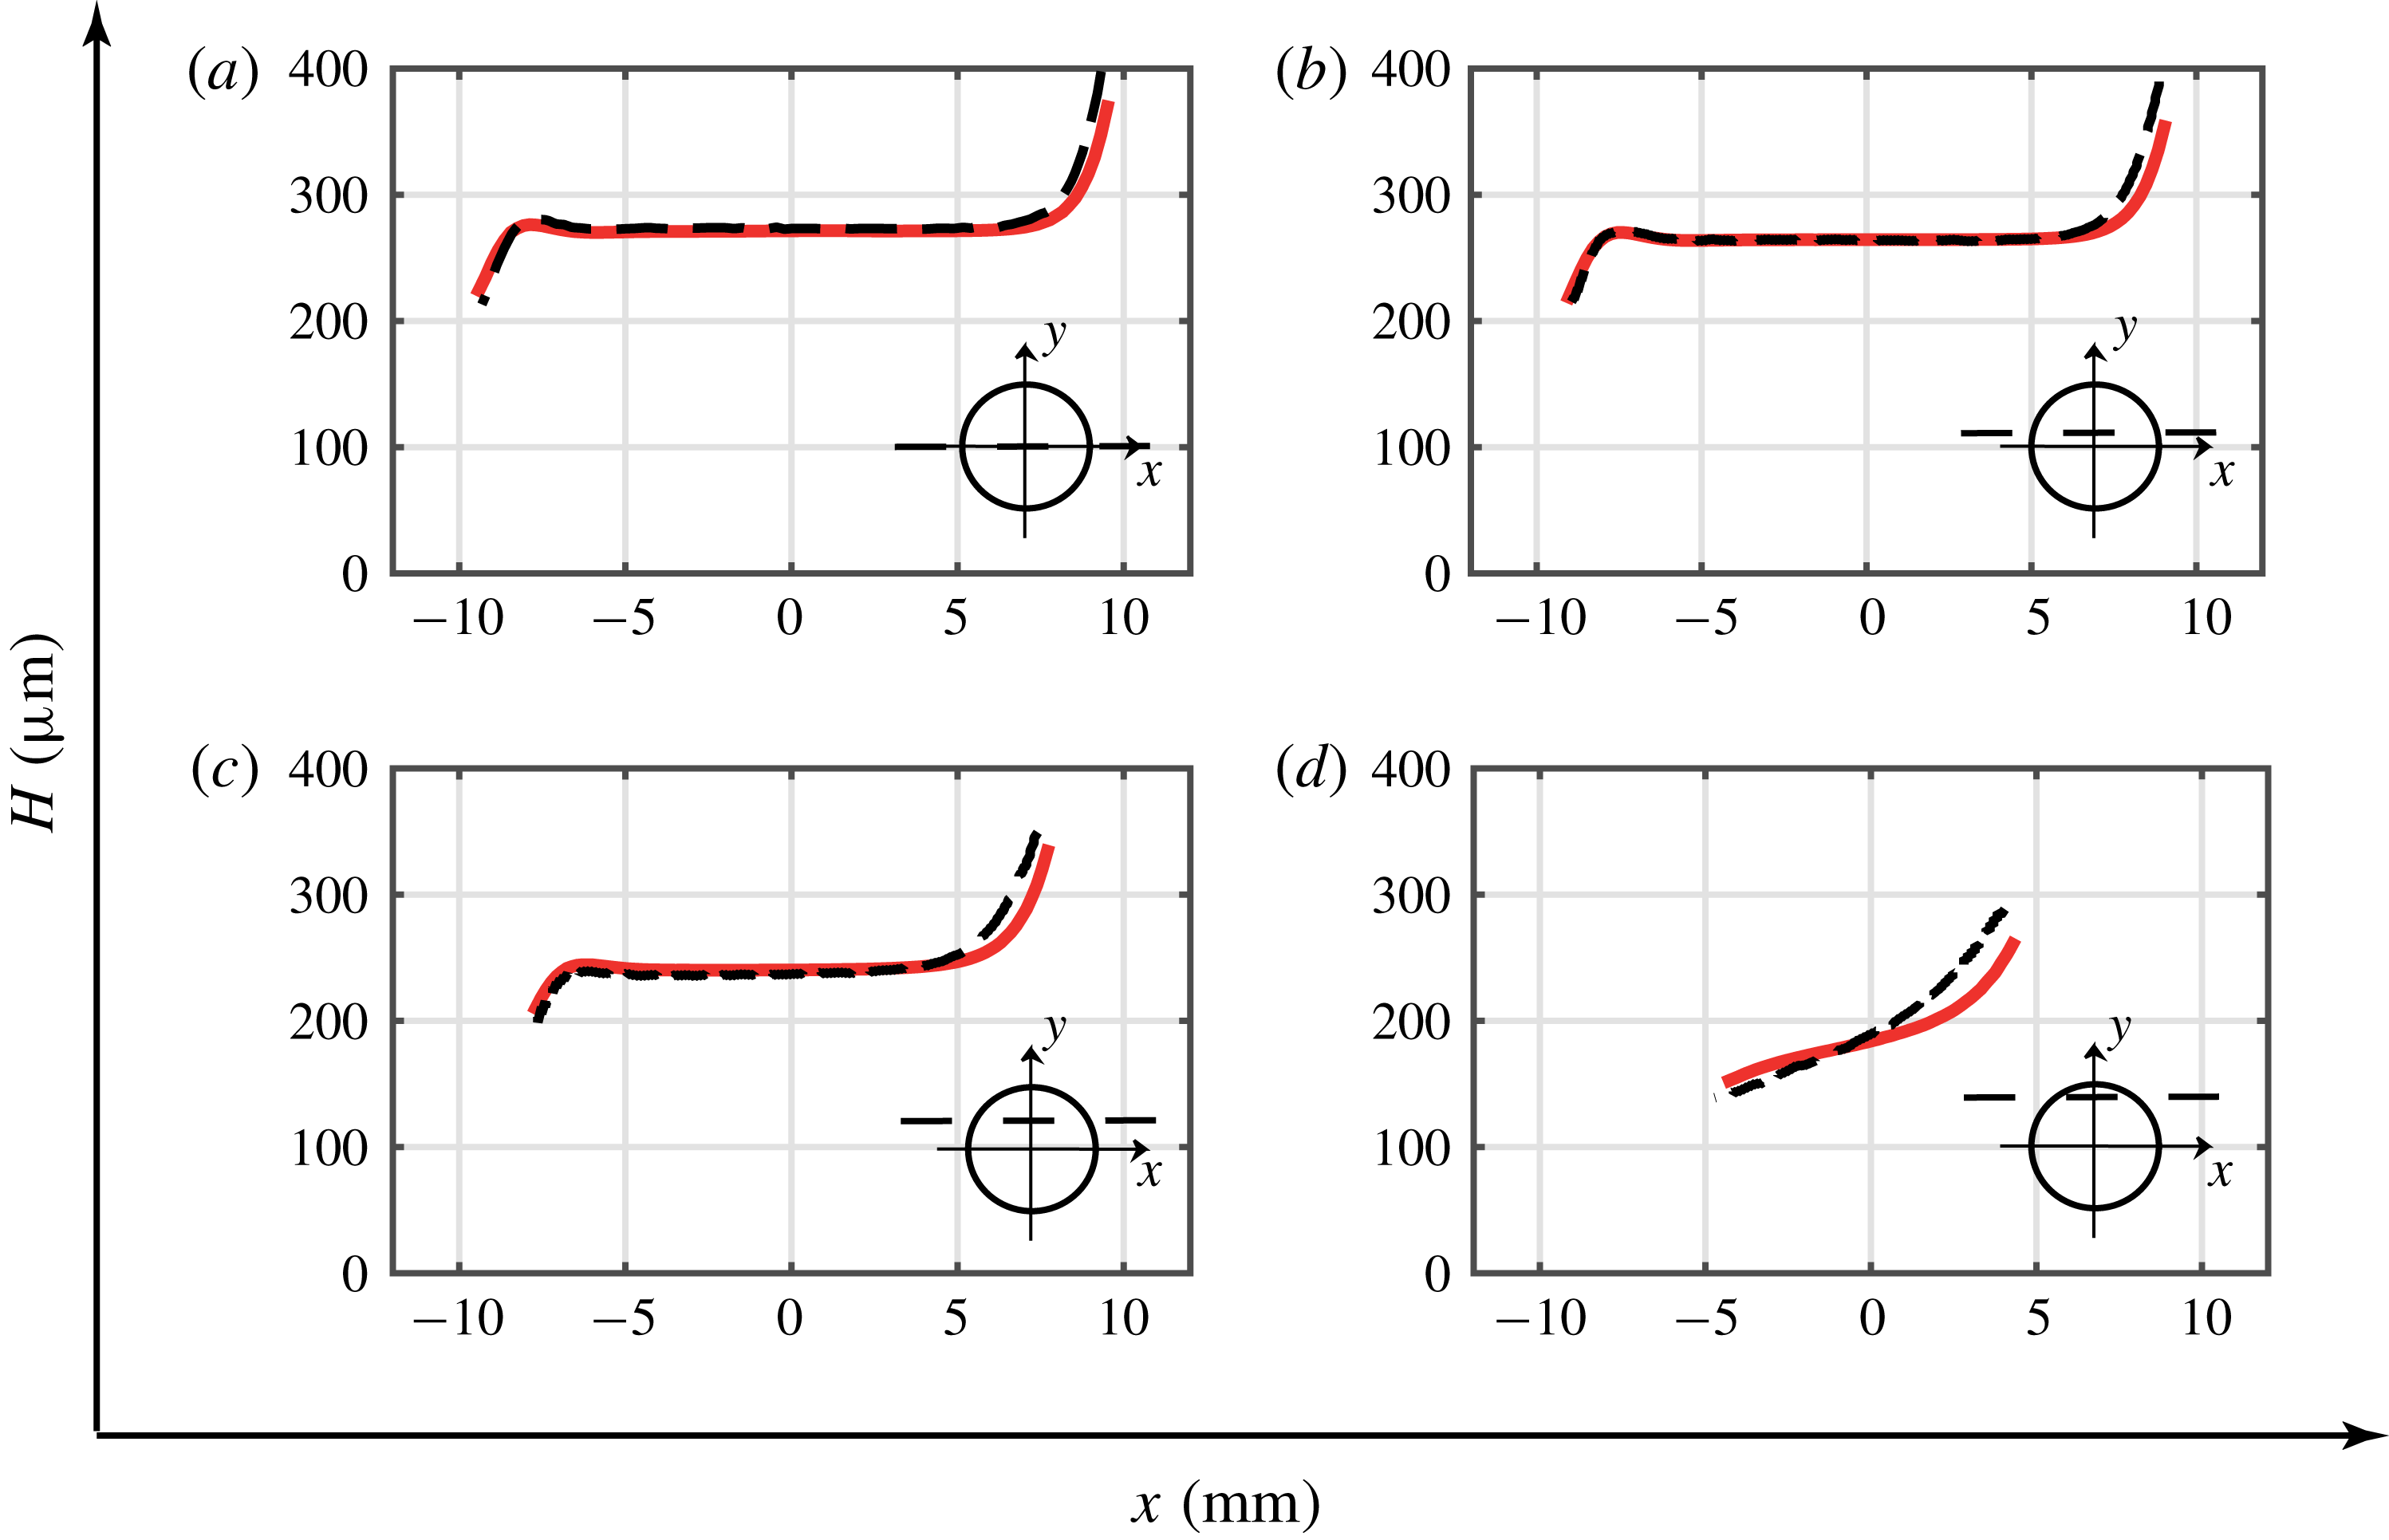
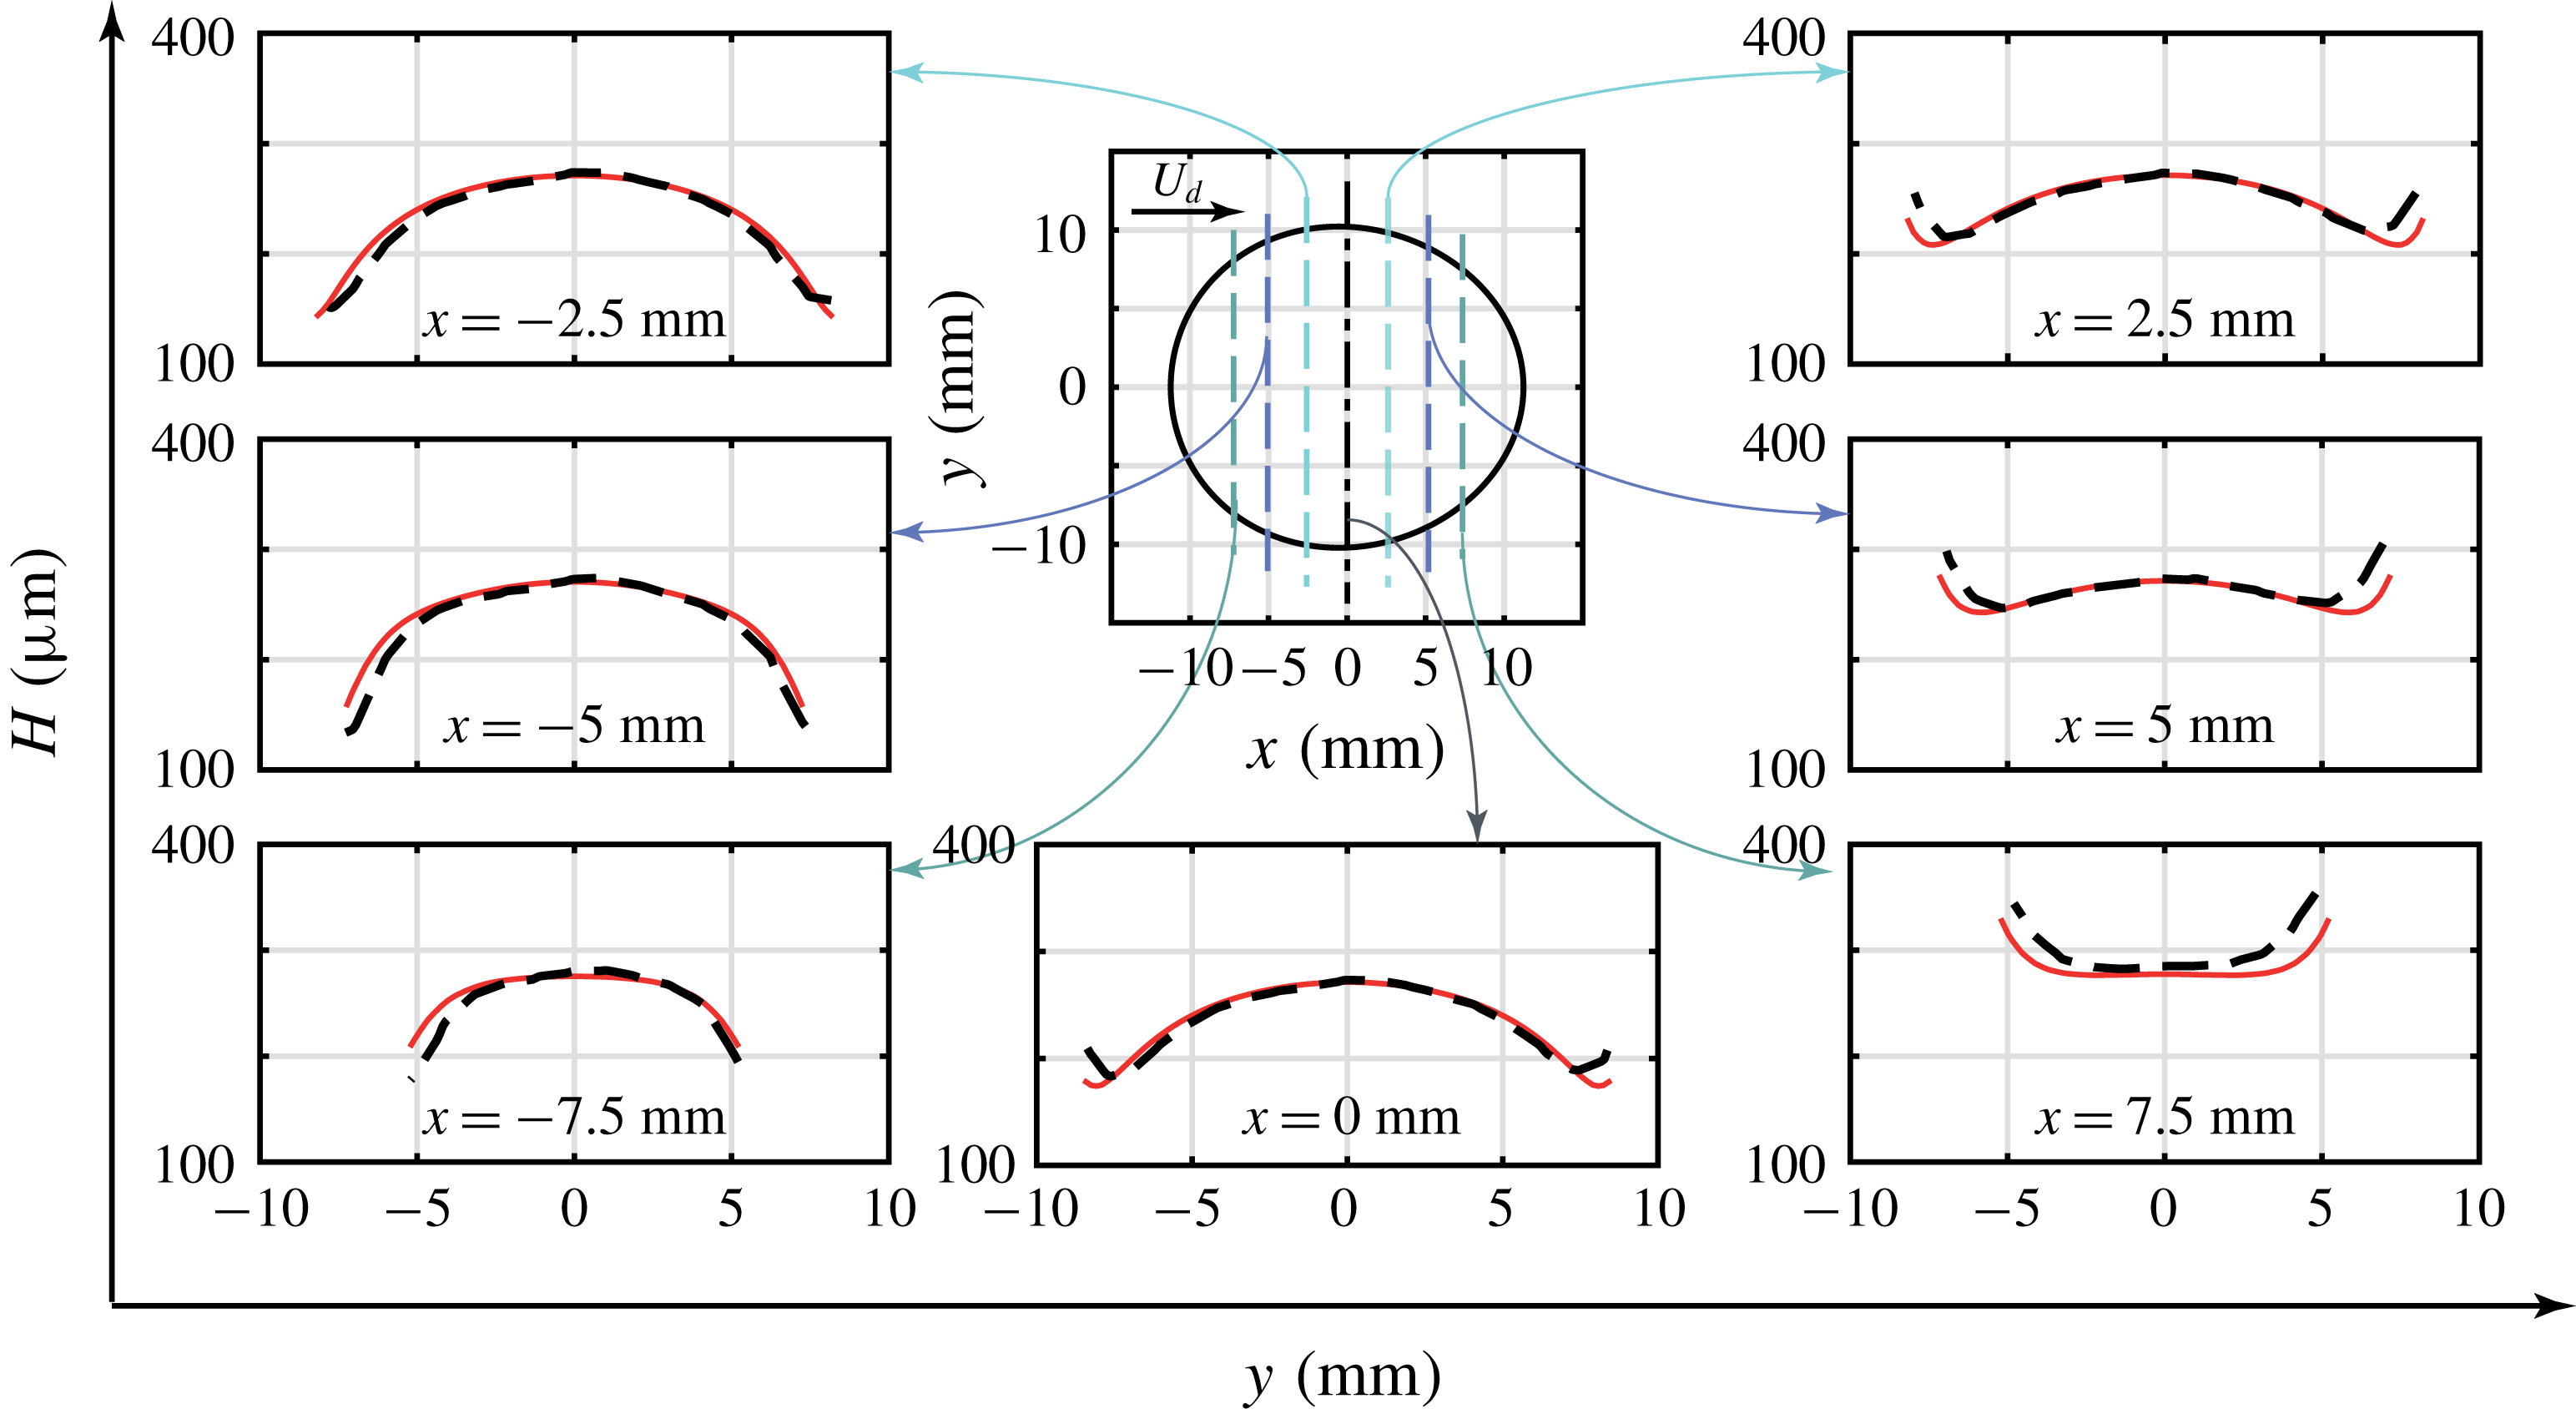
The numerical solution is further validated by making several streamwise (figure 6) and spanwise (figure 7) cuts along the largest drop of volume 1.5 ml. Along the centreline, the 3-D BIM simulation captures precisely the lubrication film variation: large film thickness at the front edge, followed by a constant thickness profile, ending in a small oscillation before posing an increasing trend at the rear edge. There is a good quantitative comparison between the experiments and numerics, with a slight variation in the film thickness along the advancing meniscus.
Film thickness cuts made along the streamwise directions at (a)
 $y=0$
, (b)
 $y=2.5$
mm, (c)
 $y=5$
mm and (d)
 $y=7.5$
mm, where
 $Ca=0.046$
and
 $Bo=6.2$
. Black dashed lines represent the experimental results and red lines the numerical predictions. The decrease in the film thickness towards the lateral edges can be observed by comparing panels (a) and (d), where the mean film thickness decreases by around
 $30\,\%$
signifying the appearance of catamarans close to
 $(x,y)\approx (-4,7.5)$
mm.

Film thickness variation along the spanwise directions at
 $x=0$
,
 $x=\pm 2.5$
mm,
 $x=\pm 5$
mm and
 $x=\pm 7.5$
mm, where
 $Ca=0.046$
and
 $Bo=6.2$
. Black dashed lines represent the experimental results and red lines the numerical results. Transverse cuts enclosed by the region
 $x=-2.5$
mm to
 $x=-5$
mm highlight the minima in the lubrication film along the lateral edges.

4 Analysis of the film thickness pattern
In order to rationalize the film thickness pattern observed in § 3.3, hereafter we model the problem using a lubrication approach. For simplicity, we formulate the 2-D lubrication equation assuming the drop dynamic viscosity
 $\unicode[STIX]{x1D707}_{i}=0$
.
4.1 Formulating the nonlinear 2-D lubrication equation
Applying the long-wavelength assumption (Oron, Davis & Bankoff Reference Oron, Davis and Bankoff1997) and by neglecting inertia, the 2-D nonlinear lubrication equation (see details in appendix B) for the film thickness
 $H$
separating the interface from the wall, in the reference frame moving at the drop velocity
 $U_{d}$
, can be derived. Using the pancake radius
 $a$
as the characteristic length and
 $a/U_{d}$
as the characteristic time, the dimensionless lubrication equation for the steady profile in the dimensionless coordinate system
 $\bar{x},\bar{y}$
is written as
 $$\begin{eqnarray}\frac{\unicode[STIX]{x2202}}{\unicode[STIX]{x2202}\bar{x}}\left[\bar{H}^{3}\left(\frac{1}{3Ca}\bar{\unicode[STIX]{x1D705}}_{x}-\frac{Bo}{3Ca}\right)-\bar{H}\right]+\frac{\unicode[STIX]{x2202}}{\unicode[STIX]{x2202}\bar{y}}\left(\bar{H}^{3}\frac{1}{3Ca}\bar{\unicode[STIX]{x1D705}}_{y}\right)=0,\end{eqnarray}$$
where
 $\bar{\unicode[STIX]{x1D705}}$
is the mean curvature of the interface, given by
 $\bar{\unicode[STIX]{x1D705}}=\unicode[STIX]{x1D735}\boldsymbol{\cdot }\boldsymbol{n}$
, where the unit normal vector
 $\boldsymbol{n}$
on the interface is given by
 $$\begin{eqnarray}\boldsymbol{n}=\frac{(-\bar{H}_{x},-\bar{H}_{y},1)^{\text{T}}}{\sqrt{1+\bar{H}_{x}^{2}+\bar{H}_{y}^{2}}}.\end{eqnarray}$$
Note the anisotropy of the fluxes in (4.1): both the buoyancy and the motion in the
 $\bar{x}$
direction do not affect the flux in the
 $\bar{y}$
direction, breaking the isotropy induced by the capillary pressure gradient.
The nonlinear equation (4.1) together with the equation for the interface curvature
 $\bar{\unicode[STIX]{x1D705}}$
are solved numerically by the commercial finite element solver COMSOL Multiphysics. The two variables for this coupled system of partial differential equations are
 $\bar{H}$
and
 $\bar{\unicode[STIX]{x1D705}}$
. As boundary conditions we impose the film thickness
 $\bar{H}=W/2a$
and the mean curvature
 $\bar{\unicode[STIX]{x1D705}}=\bar{\unicode[STIX]{x1D705}}_{f,r}$
at the droplet mid-height. The mean curvature boundary condition in the static meniscus is composed by a component in the
 $(\bar{r},\unicode[STIX]{x1D703})$
plane and a component in the
 $(\bar{r},\bar{z})$
plane. In the spirit of Meiburg (Reference Meiburg1989) and Nagel (Reference Nagel2014), we consider the local capillary number defined with the normal velocity to the static cap for the mean curvature boundary condition model:
 $$\begin{eqnarray}\bar{\unicode[STIX]{x1D705}}_{f,r}(\bar{r},\unicode[STIX]{x1D703})=\underbrace{\frac{2a}{W}\left(\frac{1+T_{f,r}(3Ca\,|\cos \unicode[STIX]{x1D703}|)^{2/3}}{1+Z_{f,r}(3Ca\,|\cos \unicode[STIX]{x1D703}|)^{2/3}}\right)}_{(\bar{r},\bar{z})\,plane}+\underbrace{\frac{\unicode[STIX]{x03C0}}{4}\frac{1}{\bar{r}}}_{(\bar{r},\unicode[STIX]{x1D703})\,plane},\end{eqnarray}$$
where coefficients with subscript
 $f$
have to be used for
 $\unicode[STIX]{x1D703}\in [-\unicode[STIX]{x03C0}/2,\unicode[STIX]{x03C0}/2]$
and those with subscript
 $r$
for
 $\unicode[STIX]{x1D703}\in [\unicode[STIX]{x03C0}/2,3\unicode[STIX]{x03C0}/2]$
, where
 $\unicode[STIX]{x1D703}$
and
 $\bar{r}$
are defined as
 $\unicode[STIX]{x1D703}=\arctan (\bar{y}/\bar{x})$
and
 $\bar{r}=(\bar{x}^{2}+\bar{y}^{2})^{1/2}$
, respectively. The values of the coefficients are
 $T_{f}=2.285$
,
 $T_{r}=-0.5067$
,
 $Z_{f}=0.4075$
and
 $Z_{r}=-0.1062$
. The curvature boundary condition model in the
 $(\bar{r},\bar{z})$
plane is inspired by the equivalent model of Balestra, Zhu & Gallaire (Reference Balestra, Zhu and Gallaire2018), which has been developed by an extensive study for the 2-D planar Stokes problem. The validity of this model has recently been corroborated by Atasi et al. (Reference Atasi, Haut, Dehaeck, Dewandre, Legendre and Scheid2018) for pancake bubbles. The correction
 $\unicode[STIX]{x03C0}/4$
for the in-plane curvature
 $1/\bar{r}$
in the
 $(\bar{r},\unicode[STIX]{x1D703})$
plane, where
 $\bar{r}=1$
for a circular geometry, has been derived asymptotically by Park & Homsy (Reference Park and Homsy1984). Note that a more involved model could be used to describe the out-of-plane curvature ((
 $\bar{r},\bar{z}$
) plane) in the lateral transition regions (Burgess & Foster Reference Burgess and Foster1990).
In the present work we extract the pancake shape from the results of the 3-D BIM simulations for
 $\unicode[STIX]{x1D706}=1$
. As explained in § 3.3, the in-plane boundaries of the deformed pancake in the
 $(\bar{r},\unicode[STIX]{x1D703})$
plane can be well described by (3.5).
It has to be stressed that the used lubrication equation should not, a priori, be used in the static meniscus region close to the boundary, where the interface slope is large. However, we have found that such an approach gives surprisingly good results if one uses the model for the static rim curvature (4.3) for the curvature boundary condition (see Balestra (Reference Balestra2018) for a discussion of the axisymmetric case), which directly sets the film thickness profile in that region. Hence, such an approach can be used to numerically obtain the film thickness profile over the entire domain, also behind its validity range.
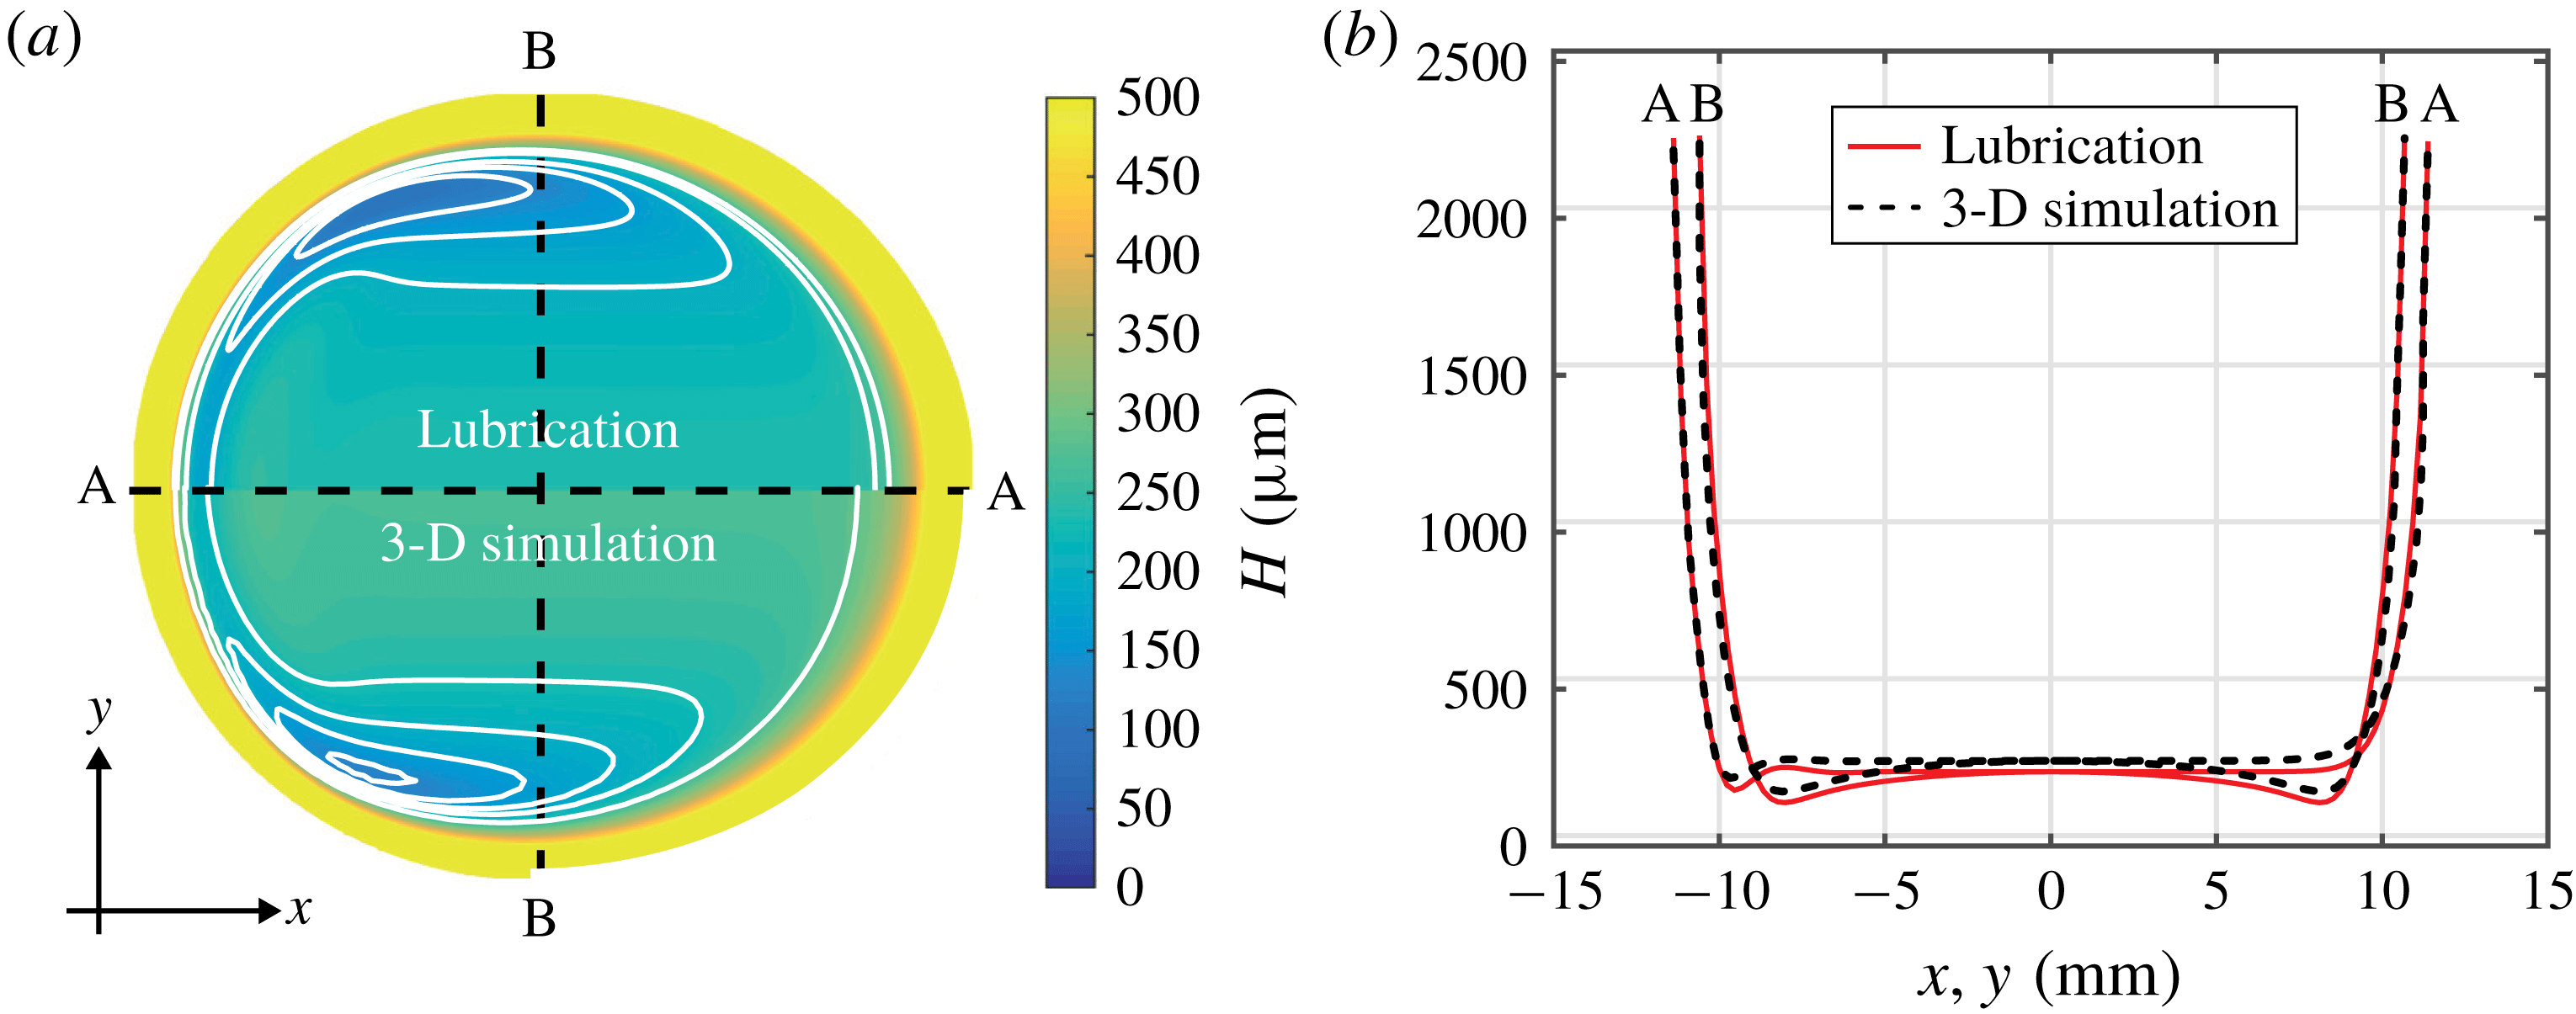
The comparison between the film thickness profile obtained by the solution of the nonlinear lubrication equation using the model equation (4.3) for the static cap mean curvature
 $\bar{\unicode[STIX]{x1D705}}_{f,r}(r,\unicode[STIX]{x1D703})$
, with the one obtained by the 3-D BIM simulations, is shown in figure 8. One can observe that both methods predict the formation of catamarans at the lateral transition regions, a uniform film thickness in the centre and oscillations at the back. In spite of the strong assumptions made for this model, the agreement is surprisingly good, even with an iso-viscous drop (
 $\unicode[STIX]{x1D707}_{i}=\unicode[STIX]{x1D707}_{o}$
). The relative error in the uniform film thickness is
 $10\,\%$
and its absolute value is
 $30~\unicode[STIX]{x03BC}$
m. The thin-film pattern shown by both approaches, as well as by the experiments, is therefore indeed a robust feature. Supported by this agreement, we investigate the thin-film pattern using the linearized version of this simple 2-D lubrication model, which is computationally much cheaper than the 3-D Stokes simulations.
4.2 Qualitative analysis of thickness pattern using the linearized 2-D lubrication equation
The qualitative nature of the film thickness pattern can be inferred by performing a linear analysis of the 2-D lubrication equation (4.1). With the use of the film thickness decomposition
 $\bar{H}=\bar{H}_{\infty }+\unicode[STIX]{x1D700}h$
, where
 $\bar{H}_{\infty }=H_{\infty }/a$
, the linear equation for the first-order film thickness correction reads:
 $$\begin{eqnarray}\frac{\bar{H}_{\infty }^{3}}{3Ca}(\underbrace{h_{\bar{x}\bar{x}\bar{x}\bar{x}}+2h_{\bar{x}\bar{x}\bar{y}\bar{y}}+h_{\bar{y}\bar{y}\bar{y}\bar{y}}}_{\unicode[STIX]{x0394}^{2}h})-\left(1+\frac{\bar{H}_{\infty }^{2}Bo}{Ca}\right)h_{\bar{x}}=0.\end{eqnarray}$$
The film thickness
 $\bar{H}_{\infty }$
is expressed using the empirical model (3.4) (Taylor Reference Taylor1961; Aussillous & Quéré Reference Aussillous and Quéré2000; Balestra et al.
Reference Balestra, Zhu and Gallaire2018), with
 $P=0.643$
and
 $Q=2.2$
.
Equation (4.4) for the film thickness correction around the uniform film thickness
 $\bar{H}_{\infty }$
can be solved as a boundary-value problem, as recently conducted by Atasi et al. (Reference Atasi, Haut, Dehaeck, Dewandre, Legendre and Scheid2018). In contrast to the nonlinear solution of § 4.1, here we only solve the lubrication equation from the thin-film region up to the beginning of the dynamic meniscus region. This is equivalent to looking at the first-order correction of the uniform thin-film region due to the matching of the film thickness in the dynamic meniscus region to a larger value. In the present context, we impose a film thickness correction
 $h=A$
and a mean curvature of the order
 $\unicode[STIX]{x0394}h=1/A+1/\bar{r}$
on the perimeter, with
 $A$
as a constant value of
 $10^{-3}\times \bar{H}_{\infty }$
. This boundary condition does not have to be understood as a rigorous matching approach, but rather as a way to find the structure of the film thickness profile in the region where it is close to being uniform. A rigorous matching for the limit
 $Ca\ll 1$
can be found in Park & Homsy (Reference Park and Homsy1984). The maps of the film thickness correction
 $h$
, together with some profiles along the streamwise and spanwise directions, are shown in figure 9.
(a) Comparison between the solution of the nonlinear lubrication equation assuming
 $\unicode[STIX]{x1D706}=0$
(top half) and that of the 3-D BIM simulations assuming
 $\unicode[STIX]{x1D706}=1$
(bottom half), where
 $Ca=4.6\times 10^{-2}$
and
 $Bo=6.2$
. (b) Comparison for cuts made along the streamwise direction A–A and spanwise direction B–B.

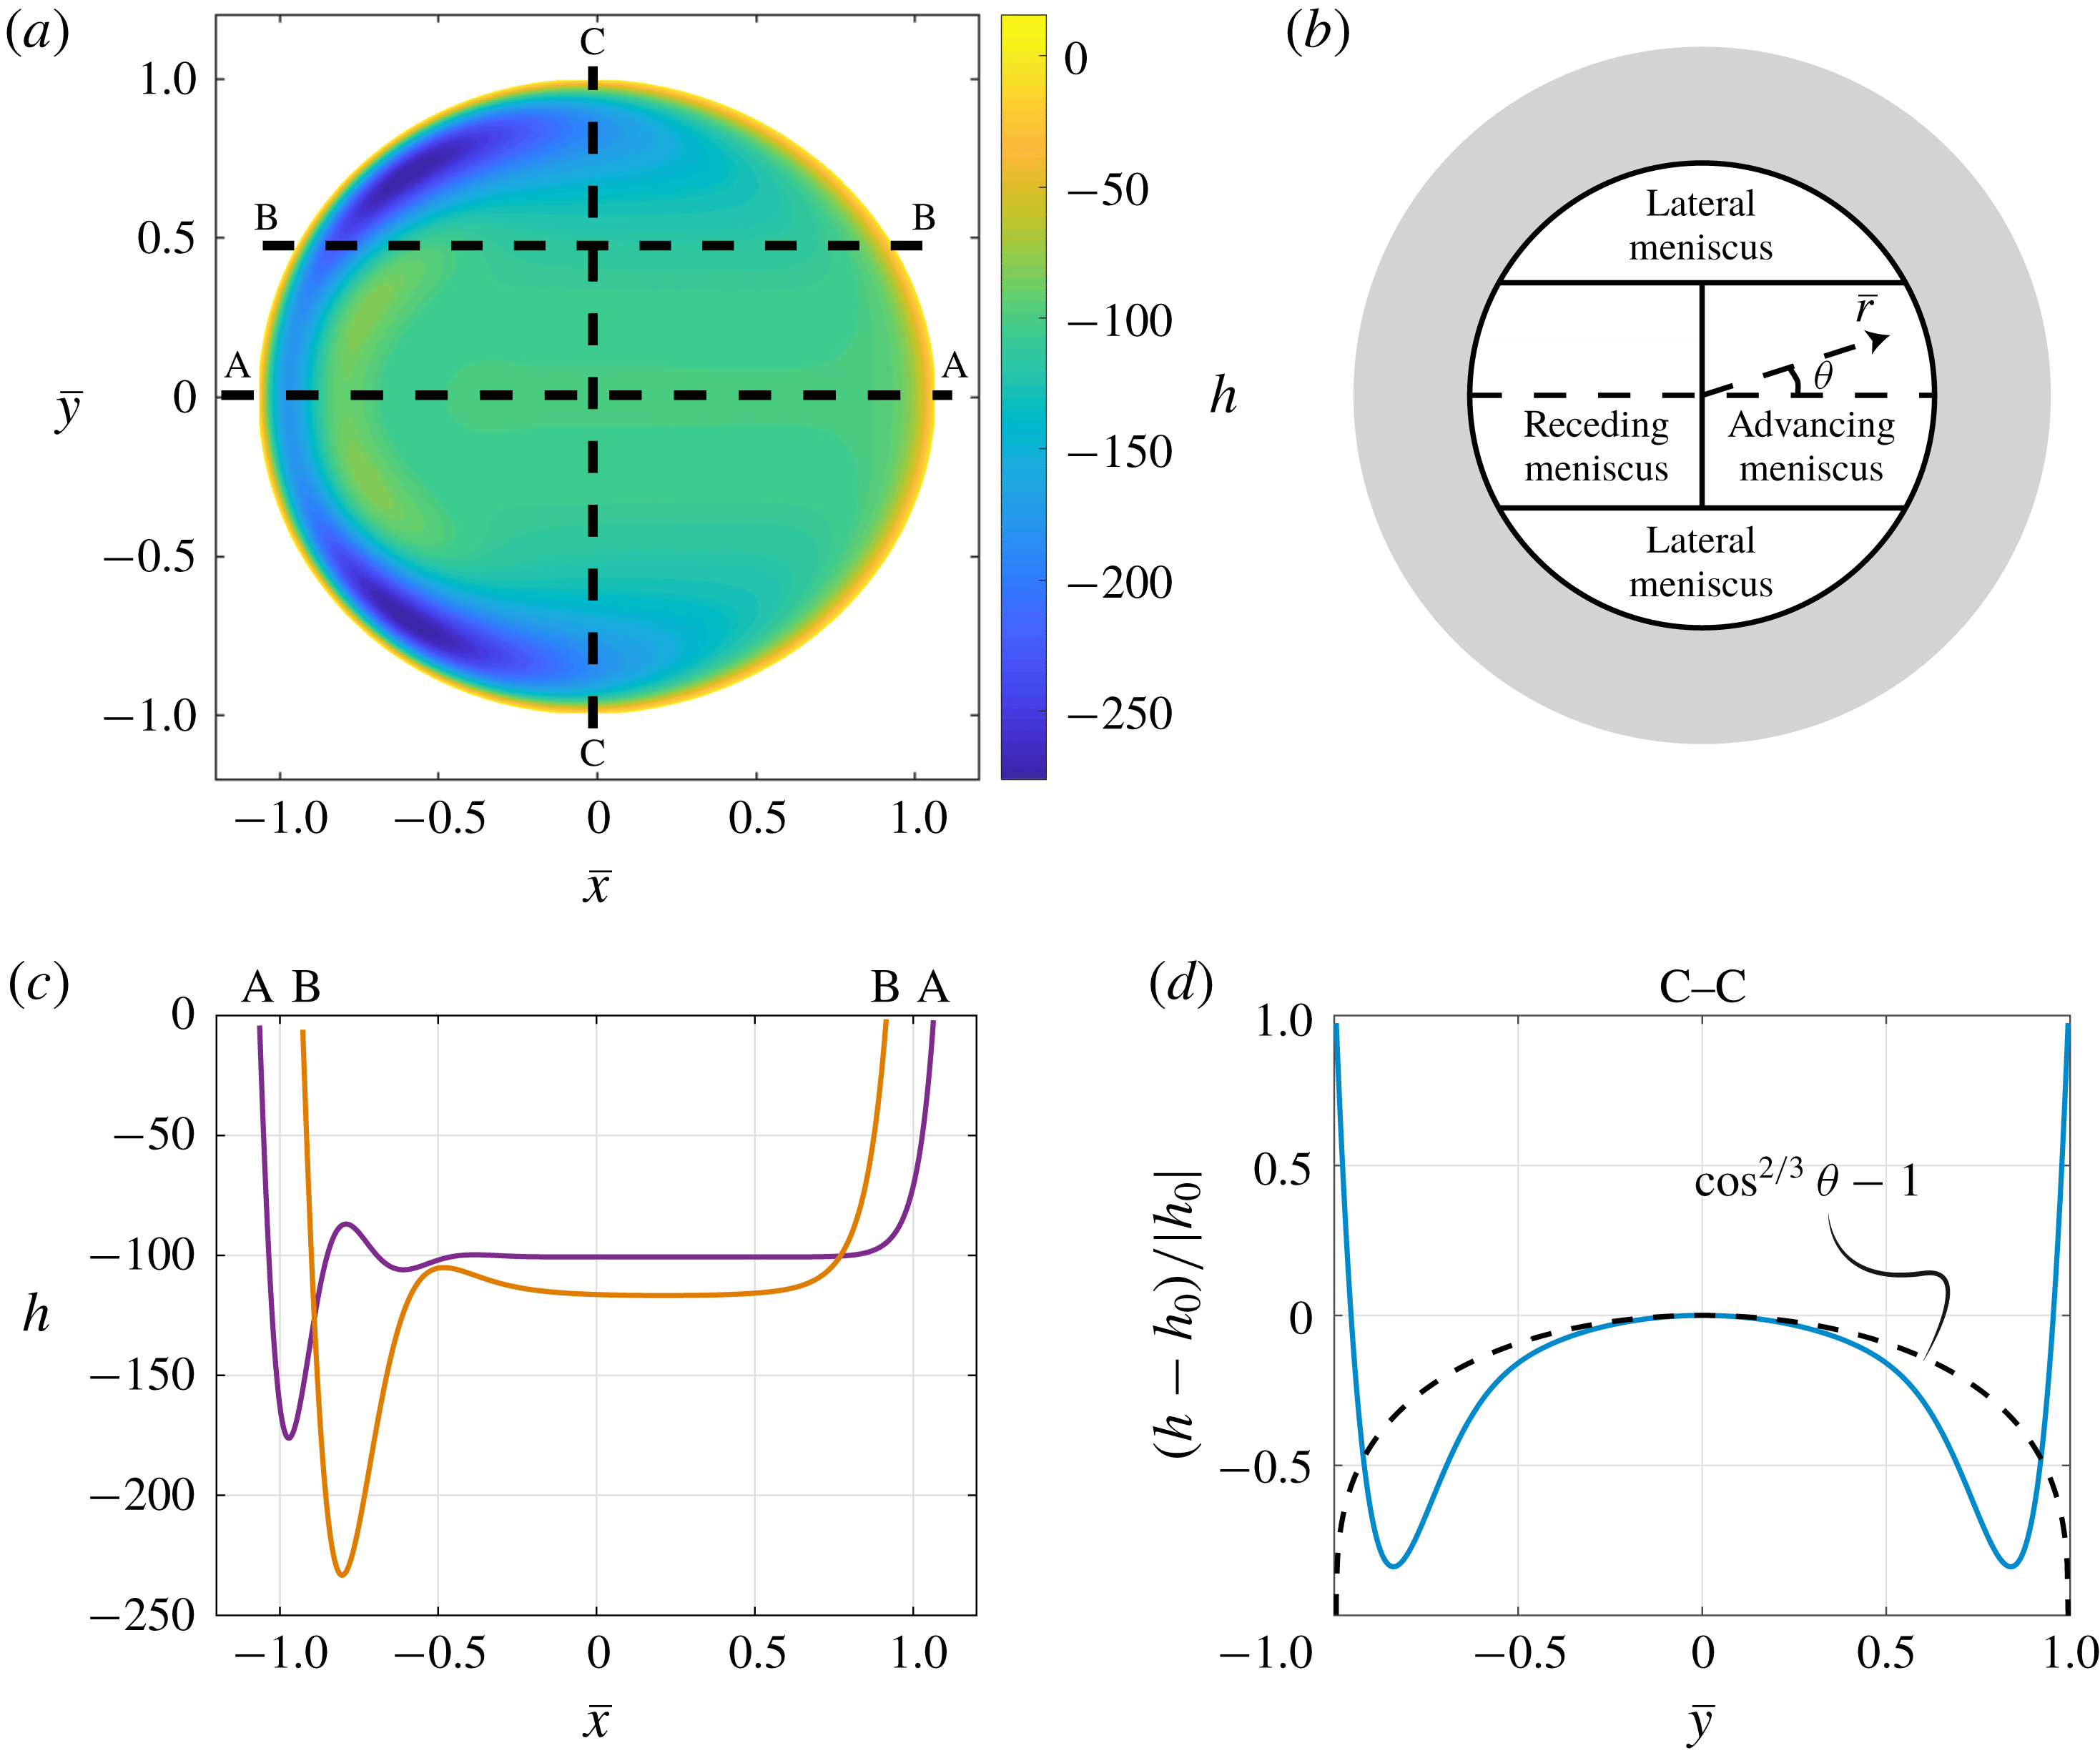
Linear film thickness correction
 $h$
around the uniform film thickness
 $\bar{H}_{\infty }$
for a pancake droplet (a,c,d). The film thickness correction map is shown in (a), the cuts along the streamwise direction at two different
 $\bar{y}$
locations are plotted in (c) and the normalized difference of the film thickness correction along the spanwise cut C–C with respect to
 $h_{0}=h(\bar{y}=0)$
along this cut is shown in (d), where the law
 $(\cos \unicode[STIX]{x1D703})^{2/3}$
is indicated by the black dashed line. Here
 $A=10^{-3}\times \bar{H}_{\infty }$
,
 $Ca=4.6\times 10^{-2}$
,
 $Bo=6.2$
and
 $\unicode[STIX]{x1D6FC}=2.2$
. The polar coordinates
 $(\bar{r},\unicode[STIX]{x1D703})$
are introduced and the boundaries are highlighted by the grey area in panel (b).

First, it can be clearly observed that the linear lubrication equation with a perturbed film thickness and curvature along the domain boundary is able to reproduce the catamaran-like pattern observed in pancake droplets as seen in §§ 4.1 and 3.3. The film thickness is the smallest in the lateral part of the pancake (see figure 9 a), so that its 3-D shape resembles the hull of a catamaran. Therefore, we can conclude that this pattern is the generalization of the 1-D oscillations found by Bretherton (Reference Bretherton1961) at the rear of an axisymmetric bubble for a 2-D concave structure, like a pancake droplet, and is intrinsically related to the anisotropy of the equation.
Second, the film thickness correction along the streamwise direction
 $\bar{x}$
(see figure 9
c) deviates from a uniform profile as expected from Bretherton’s theory (Bretherton Reference Bretherton1961). The film thickness oscillates at the rear meniscus and increases monotonically at the front meniscus. Note that the film thickness correction in the uniform film region of a pancake is not vanishing, as the base film thickness
 $\bar{H}_{\infty }$
is given by (3.4), which is an asymptotic estimate for
 $Bo=0$
but not an exact solution of the lubrication equation with
 $Bo\neq 0$
. Furthermore, it can be observed that the more one moves away from
 $\bar{y}=0$
, the more the thickness of the film is reduced. Therefore, the thickness of the film left by the front meniscus is not uniform.
To better highlight this crucial point, we show in figure 9(d) the normalized difference between the film thickness correction and its value at
 $\bar{y}=0$
. The film thickness decreases as
 $|\bar{y}|$
increases, before increasing again close to the edge to match the boundary condition.
These qualitative observations can be rationalized by simplifying the linear lubrication equation (4.4) for the different regions of the domain (see figure 9 b). The lubrication equation (4.4) in polar coordinates can be simplified to
 $$\begin{eqnarray}\frac{\bar{H}_{\infty }^{3}}{3Ca}h_{\bar{r}\bar{r}\bar{r}\bar{r}}-\left(1+\frac{\bar{H}_{\infty }^{2}Bo}{Ca}\right)\left(\cos \unicode[STIX]{x1D703}\,h_{\bar{r}}-\frac{\sin \unicode[STIX]{x1D703}}{\bar{r}}h_{\unicode[STIX]{x1D703}}\right)=0.\end{eqnarray}$$
For small polar angles
 $\unicode[STIX]{x1D703}$
, the contribution
 $(\sin \unicode[STIX]{x1D703}/\bar{r})h_{\unicode[STIX]{x1D703}}$
, which corresponds to the flux in the tangential direction, can be neglected so that the linear lubrication equation becomes, after integration along
 $\bar{r}$
,
 $$\begin{eqnarray}h_{\bar{r}\bar{r}\bar{r}}=K_{p}h,\end{eqnarray}$$
with
 $$\begin{eqnarray}K_{p}=\left(\frac{3Ca}{\bar{H}_{\infty }^{3}}+\frac{3Bo}{\bar{H}_{\infty }}\right)\cos \unicode[STIX]{x1D703},\end{eqnarray}$$
which is the linearized 1-D equation for the Landau–Levich–Derjaguin–Bretherton problem (Landau & Levich Reference Landau and Levich1942; Derjaguin Reference Derjaguin1943; Bretherton Reference Bretherton1961) in the radial direction
 $\bar{r}$
projected on the streamwise direction. Therefore, we know from the solution of Bretherton (Reference Bretherton1961) that the film thickness is oscillating at the rear meniscus and monotonically increasing at the front one. Focusing for now on
 $Bo=0$
, we know that the thickness deposited by a front meniscus depends on the velocity normal to the interface. In this case, one has therefore
 $\bar{H}_{\infty }\sim Ca_{p}^{2/3}$
with
 $Ca_{p}=Ca\cos \unicode[STIX]{x1D703}$
as the local capillary number at a given polar angle
 $\unicode[STIX]{x1D703}$
. Hence, the film thickness in the central region of the pancake varies like
 $(Ca\cos \unicode[STIX]{x1D703})^{2/3}$
. Similar results have been reported for a pressure-driven red blood cell traversing a non-axisymmetric passage (Halpern & Secomb Reference Halpern and Secomb1992) and in pancake droplets by Reichert et al. (Reference Reichert, Huerre, Theodoly, Valignat, Cantat and Jullien2018). Once a given film thickness is set by the front meniscus, the same thickness will be present over the entire thin-film region at the corresponding spanwise location
 $\bar{y}$
. The good agreement between the dependence on
 $(\cos \unicode[STIX]{x1D703})^{2/3}$
of the film thickness and the profile along the spanwise direction obtained by resolving the 2-D lubrication equation is shown in figure 9(d).
Similarly, the oscillations at the rear meniscus depend on the polar angle. For a pancake droplet, due to the film thickness non-uniformity resulting from the non-uniform deposition at the front, the wavelength of the oscillations at the back scales as
 $\unicode[STIX]{x1D706}_{osc}\sim (Ca\cos \unicode[STIX]{x1D703})^{1/3}$
. Given the
 $1/3$
power-law dependence, the wavelength is almost unchanged, before rapidly reducing to
 $0$
when
 $\unicode[STIX]{x1D703}\rightarrow \pm \unicode[STIX]{x03C0}/2$
(see figure 9
a).
It is important to note that a plane cut of the film thickness at a given angle
 $\unicode[STIX]{x1D703}$
does not present a region of constant film thickness. A pancake droplet cannot be seen just as the collection of different 1-D profiles obtained by the solution to (4.6) for different polar angles
 $\unicode[STIX]{x1D703}$
. In fact, the film thickness at any spanwise location
 $\bar{y}$
is set by the front meniscus at the corresponding polar angle
 $\unicode[STIX]{x1D703}$
and (4.6) only indicates the scaling of this film thickness as well as the oscillations at the back.
For
 $\unicode[STIX]{x1D703}\rightarrow \pm \unicode[STIX]{x03C0}/2$
, which corresponds to the lateral meniscus region (see figure 9
b), the tangential flux term
 $(\sin \unicode[STIX]{x1D703}/\bar{r})h_{\unicode[STIX]{x1D703}}$
in (4.5) can no longer be neglected. Burgess & Foster (Reference Burgess and Foster1990) performed an involved analysis of the lubrication equation in this region for a pancake droplet at low capillary numbers and found that the local film thickness in the so-called lateral transition regions scales as
 $Ca^{4/5}$
rather than as
 $Ca^{2/3}$
. Therefore, for
 $Ca\ll 1$
, the film thickness in these lateral regions is much smaller than that in the other regions. This explains why one observes catamaran-like structures in the lateral regions of pancake droplets. Note that, for the
 $Ca$
range considered in the present study, the film thickness in the lateral transition regions is still sufficiently large so that the viscous dissipation can be neglected also in these regions, as confirmed by the results of § 3. Furthermore, Burgess & Foster (Reference Burgess and Foster1990) have also shown that the polar extent of these lateral regions scales as
 $Ca^{1/5}$
, whereas their radial extent scales as
 $Ca^{2/5}$
instead of as
 $Ca^{1/3}$
that one has for the length of the rear and front dynamic menisci of axisymmetric droplets (see also Hodges, Jensen & Rallison Reference Hodges, Jensen and Rallison2004).
5 Conclusions and perspectives
We report the velocity, mean film thickness and thickness map for a droplet moving due to buoyancy in a vertical Hele-Shaw cell. The mean drop velocity compares well with the leading-order velocity expression of Gallaire et al. (Reference Gallaire, Meliga, Laure and Baroud2014). This signifies that buoyancy and viscous drag force are the dominant forces in our experimental parameter range, with the viscous dissipation in the film thickness and in the dynamical meniscus having a negligible effect on the droplet velocity. On the contrary, the dimensionless mean film thickness data were dependent on the dimensionless droplet velocity, expressed as
 $Ca$
, and were fitted with the Taylor’s law model (Aussillous & Quéré Reference Aussillous and Quéré2000).
We also obtained the complete film thickness maps using a CCI optical pen mounted on a linear translation stage. Based on a boundary integral method, 3-D Stokes equations were solved. These numerical results for
 $\unicode[STIX]{x1D706}=1$
were in very good agreement with our experimental results. The thickness pattern had a distinct catamaran-like shape as experimentally observed for pressure-driven flows in Huerre et al. (Reference Huerre, Theodoly, Leshansky, Valignat, Cantat and Jullien2015) and Reichert et al. (Reference Reichert, Huerre, Theodoly, Valignat, Cantat and Jullien2018).
To understand the nature of the thickness patterns observed experimentally and numerically, the problem was approached using a lubrication equation, which was solved as a boundary-value problem, rather than as an initial-value problem, as recently conducted by Atasi et al. (Reference Atasi, Haut, Dehaeck, Dewandre, Legendre and Scheid2018). In spite of all the crude assumptions made in developing the model, its nonlinear solution for the film thickness profile of a pancake bubble compared surprisingly well with the results of 3-D BIM simulations, evidencing the robustness of the thin-film pattern.
In order to unravel the structure of the film thickness profile, we linearized the lubrication model and solved for the linear thickness corrections around a uniformly thick film. We have been able to show that not only the oscillations at the rear meniscus, but also the catamaran-like pattern, can be directly retrieved by solving the linear 2-D lubrication equation when perturbing the film thickness at the boundaries, which mimics the presence of a meniscus of greater film thickness. In particular, the catamaran-like structure results from the anisotropic flux induced by the motion of the walls with respect to the pancake and the need to match the film thickness to larger values in the dynamic meniscus region surrounding the region where the thin film is rather uniform. This pattern is therefore independent of the force driving the motion. In fact, in totally different contexts, the same pattern is also found in drops levitating on a moving substrate (Hodges et al.
Reference Hodges, Jensen and Rallison2004; Lhuissier et al.
Reference Lhuissier, Tagawa, Tran and Sun2013) as well as in oleoplaning drops (Daniel et al.
Reference Daniel, Timonen, Li, Velling and Aizenberg2017). In the central part of the pancake droplet, the thickness left by the front meniscus scales as
 $(Ca\cos \unicode[STIX]{x1D703})^{2/3}$
, and depends therefore on the velocity normal to the interface. This scaling no longer holds in the lateral transition region, where the component of the flux tangential to the interface becomes important and the thickness of the film is much smaller, resulting in the formation of the catamaran-like structure.
Finally, we would like to highlight a contrasting feature seen between drops moving in a cylindrical tube and that in a Hele-Shaw cell. In cylindrical tubes the main difference between the pressure-driven and buoyancy-driven bubble motion, as found by Bretherton (Reference Bretherton1961), is that buoyant bubbles may remain stuck if the capillary radius is less than
 $0.918l_{c}$
, where the capillary length
 $l_{c}=\sqrt{\unicode[STIX]{x1D6FE}/\unicode[STIX]{x0394}\unicode[STIX]{x1D70C}g}$
. This failure results from the impossibility to match the static gravity-corrected meniscus shape with the flat thin-film region. A similar result was obtained recently in the planar geometry by Lamstaes & Eggers (Reference Lamstaes and Eggers2017) with a prefactor of
 $0.847$
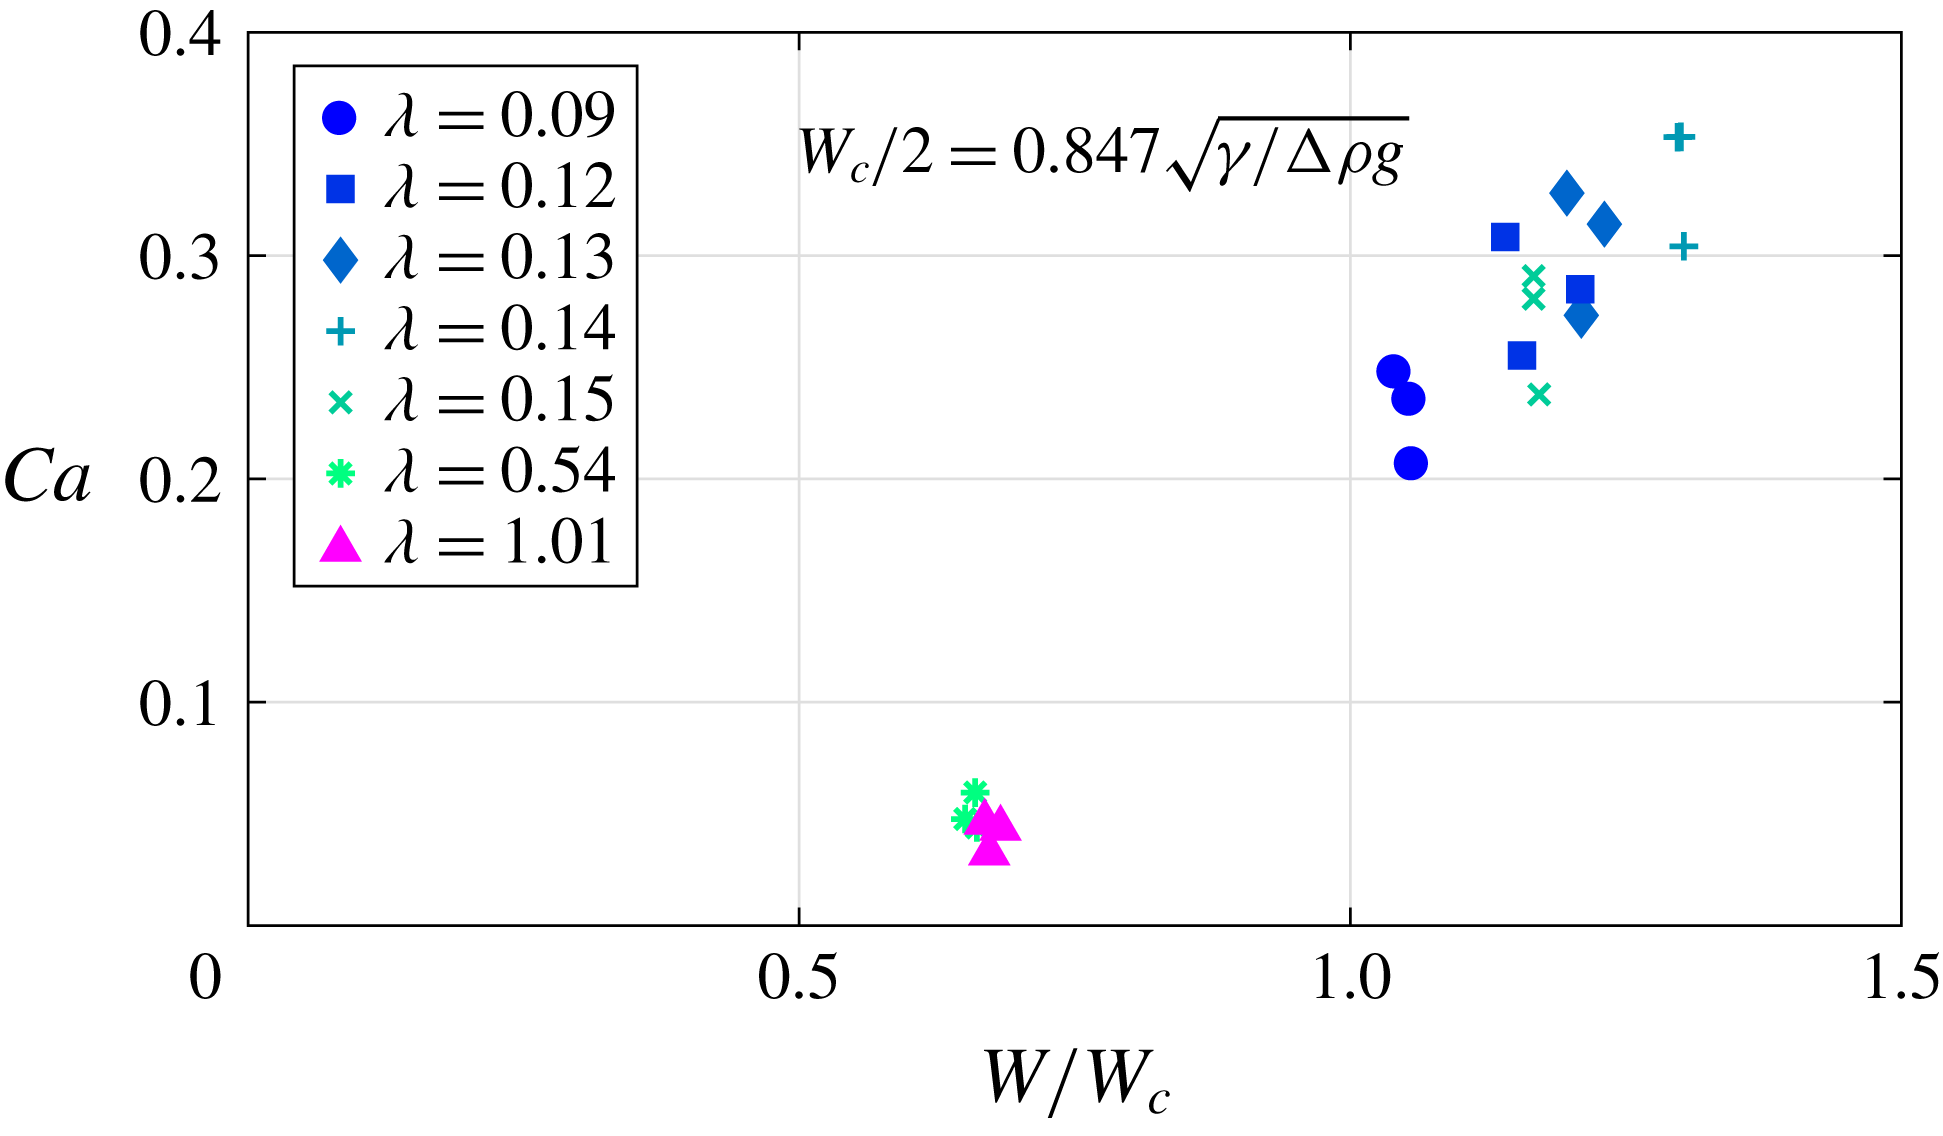
. Interestingly enough, we suspect that there is no such bubble arrest in Hele-Shaw cells, as a consequence of the additional direction which adds a degree of freedom in the curvature. As shown in figure 10, our experimental results show marked drop motion when the half cell gap is below
 $0.847l_{c}$
.
As stated by Lamstaes & Eggers (Reference Lamstaes and Eggers2017), for a planar geometry the drops should get stuck when
 $W<W_{c}$
. Our experiments show that the pancake-shaped drops continue to move beyond this limitation.

Acknowledgements
I.S. thanks the Swiss National Science Foundation (grant no. 200021-159957). The computer time was provided by the Swiss National Supercomputing Centre (CSCS) under project ID s603. An ERC starting grant ‘SimCoMiCs 280117’ is gratefully acknowledged. L.Z. is grateful for a VR International Postdoc Grant ‘2015-06334’ from the Swedish Research Council. We thank Ludovic Keiser for fruitful discussions.
Appendix A. CCI working principle
We hereby describe the principle of the confocal chromatic imaging (CCI) technique. An achromatic lens decomposes the incident white light into a continuum of monochromatic images, which constitutes the measurement range. The light reflected by a sample surface put inside this range is collected by a beam splitter. A pinhole then allows one to block the defocused light that does not come from the sample surface. Eventually, the spectral repartition of the collected light is analysed by a spectrometer. The wavelength of maximum intensity is detected and the distance value is deduced from a calibration curve. Several reflecting interfaces can be detected at the same time, allowing thickness measurement of thin transparent layers.
Appendix B. Derivation of 2-D nonlinear lubrication equation for pancake droplets
The derivation of the model equation presented in § 4.2 is briefly outlined here. Considering the same physical properties for the droplet and the outer medium as outlined in § 1, and under the assumption of negligible inertia (Oron et al.
Reference Oron, Davis and Bankoff1997) with
 $\unicode[STIX]{x1D70C}_{i}\ll \unicode[STIX]{x1D70C}_{o}$
and
 $\unicode[STIX]{x1D707}_{i}\ll \unicode[STIX]{x1D707}_{o}$
, the 3-D momentum equations reads
 $$\begin{eqnarray}\displaystyle & \displaystyle 0=-\frac{\unicode[STIX]{x2202}p}{\unicode[STIX]{x2202}x}+\unicode[STIX]{x1D707}_{o}\left(\frac{\unicode[STIX]{x2202}^{2}u}{\unicode[STIX]{x2202}x^{2}}+\frac{\unicode[STIX]{x2202}^{2}u}{\unicode[STIX]{x2202}y^{2}}+\frac{\unicode[STIX]{x2202}^{2}u}{\unicode[STIX]{x2202}z^{2}}\right)-\unicode[STIX]{x1D70C}_{o}g, & \displaystyle\end{eqnarray}$$
 $$\begin{eqnarray}\displaystyle & \displaystyle 0=-\frac{\unicode[STIX]{x2202}p}{\unicode[STIX]{x2202}y}+\unicode[STIX]{x1D707}_{o}\left(\frac{\unicode[STIX]{x2202}^{2}v}{\unicode[STIX]{x2202}x^{2}}+\frac{\unicode[STIX]{x2202}^{2}v}{\unicode[STIX]{x2202}y^{2}}+\frac{\unicode[STIX]{x2202}^{2}v}{\unicode[STIX]{x2202}z^{2}}\right), & \displaystyle\end{eqnarray}$$
 $$\begin{eqnarray}\displaystyle & \displaystyle 0=-\frac{\unicode[STIX]{x2202}p}{\unicode[STIX]{x2202}z}+\unicode[STIX]{x1D707}_{o}\left(\frac{\unicode[STIX]{x2202}^{2}w}{\unicode[STIX]{x2202}x^{2}}+\frac{\unicode[STIX]{x2202}^{2}w}{\unicode[STIX]{x2202}y^{2}}+\frac{\unicode[STIX]{x2202}^{2}w}{\unicode[STIX]{x2202}z^{2}}\right). & \displaystyle\end{eqnarray}$$
Using
 $L$
as the characteristic length scale in the
 $x$
and
 $y$
directions and the film thickness
 $H$
as the characteristic length scale in the
 $z$
direction, the film aspect ratio
 $\unicode[STIX]{x1D716}$
is defined as
 $\unicode[STIX]{x1D716}=H/L$
. The long-wavelength approximation is employed since
 $\unicode[STIX]{x1D716}\ll 1$
. Mass conservation indicates that the characteristic velocity in the
 $z$
direction (
 $W$
) is much smaller than the other two components (
 $U$
in
 $x$
and
 $V$
in
 $y$
direction),
 $W\sim \unicode[STIX]{x1D716}U\ll U$
and
 $W\sim \unicode[STIX]{x1D716}V\ll V$
. The Stokes equation simplifies as
 $$\begin{eqnarray}\displaystyle & \displaystyle 0=-\frac{\unicode[STIX]{x2202}p}{\unicode[STIX]{x2202}x}+\unicode[STIX]{x1D707}_{o}\frac{\unicode[STIX]{x2202}^{2}u}{\unicode[STIX]{x2202}z^{2}}-\unicode[STIX]{x1D70C}_{o}g, & \displaystyle\end{eqnarray}$$
 $$\begin{eqnarray}\displaystyle & \displaystyle 0=-\frac{\unicode[STIX]{x2202}p}{\unicode[STIX]{x2202}y}+\unicode[STIX]{x1D707}_{o}\frac{\unicode[STIX]{x2202}^{2}v}{\unicode[STIX]{x2202}z^{2}}, & \displaystyle\end{eqnarray}$$
 $$\begin{eqnarray}\displaystyle & \displaystyle 0=-\frac{\unicode[STIX]{x2202}p}{\unicode[STIX]{x2202}z}. & \displaystyle\end{eqnarray}$$
Integrating equation (B 6) in
 $z$
and applying dynamic boundary conditions yields
 $p=p_{0}-\unicode[STIX]{x1D6FE}\unicode[STIX]{x1D705}$
, where
 $\unicode[STIX]{x1D705}$
is the mean curvature of the interface. Integrating equations (B 4) and (B 5) twice in
 $z$
and considering
 $u(z=0)=-U_{d}$
and the zero-slip boundary condition
 $v(z=0)=0$
, as well as the zero-shear-stress interface
 $\unicode[STIX]{x2202}u(z=H)/\unicode[STIX]{x2202}z=0$
and
 $\unicode[STIX]{x2202}v(z=H)/\unicode[STIX]{x2202}z=0$
, yields the velocity components
 $$\begin{eqnarray}\displaystyle & \displaystyle u=\frac{(\unicode[STIX]{x1D6FE}\unicode[STIX]{x1D705}_{x}-\unicode[STIX]{x0394}\unicode[STIX]{x1D70C}g)}{\unicode[STIX]{x1D707}_{o}}\left(H-\frac{z}{2}\right)z-U_{d}, & \displaystyle\end{eqnarray}$$
 $$\begin{eqnarray}\displaystyle & \displaystyle v=\frac{\unicode[STIX]{x1D6FE}\unicode[STIX]{x1D705}_{y}}{\unicode[STIX]{x1D707}_{o}}\left(H-\frac{z}{2}\right)z. & \displaystyle\end{eqnarray}$$
Since the inner medium density
 $\unicode[STIX]{x1D70C}_{i}\ll \unicode[STIX]{x1D70C}_{o}$
, we replace
 $\unicode[STIX]{x1D70C}_{o}$
by
 $\unicode[STIX]{x0394}\unicode[STIX]{x1D70C}$
in (B 7), where
 $\unicode[STIX]{x0394}\unicode[STIX]{x1D70C}=\unicode[STIX]{x1D70C}_{o}-\unicode[STIX]{x1D70C}_{i}$
represents the density difference between the inner and outer fluids. Integrating equations (B 7) and (B 8) in
 $z$
from
 $0$
to
 $H$
yields the flux in
 $x$
and
 $y$
directions as
 $$\begin{eqnarray}\displaystyle & \displaystyle Q^{u}=\frac{H^{3}}{3\unicode[STIX]{x1D707}_{o}}(\unicode[STIX]{x1D6FE}\unicode[STIX]{x1D705}_{x}-\unicode[STIX]{x0394}\unicode[STIX]{x1D70C}g)-U_{d}H, & \displaystyle\end{eqnarray}$$
 $$\begin{eqnarray}\displaystyle & \displaystyle Q^{v}=\frac{H^{3}}{3\unicode[STIX]{x1D707}_{o}}\unicode[STIX]{x1D6FE}\unicode[STIX]{x1D705}_{y}. & \displaystyle\end{eqnarray}$$
Finally, integrating the continuity equation and applying the Leibniz integral rule and the kinematic boundary condition at the interface yields the mass conservation equation expressed as
 $$\begin{eqnarray}\frac{\unicode[STIX]{x2202}H}{\unicode[STIX]{x2202}t}+\frac{\unicode[STIX]{x2202}Q^{u}}{\unicode[STIX]{x2202}x}+\frac{\unicode[STIX]{x2202}Q^{v}}{\unicode[STIX]{x2202}y}=0.\end{eqnarray}$$
Introducing equations (B 9) and (B 10) in (B 11) finally yields the lubrication equation
 $$\begin{eqnarray}\frac{\unicode[STIX]{x2202}H}{\unicode[STIX]{x2202}t}+\frac{\unicode[STIX]{x2202}}{\unicode[STIX]{x2202}x}\left[\frac{H^{3}}{3\unicode[STIX]{x1D707}_{o}}(\underbrace{\unicode[STIX]{x1D6FE}\unicode[STIX]{x1D705}_{x}}_{\text{I}}-\underbrace{\unicode[STIX]{x0394}\unicode[STIX]{x1D70C}g}_{\text{II}})-\underbrace{U_{d}H}_{\text{III}}\right]+\frac{\unicode[STIX]{x2202}}{\unicode[STIX]{x2202}y}\left[\frac{H^{3}}{3\unicode[STIX]{x1D707}_{o}}\underbrace{\unicode[STIX]{x1D6FE}\unicode[STIX]{x1D705}_{y}}_{\text{I}}\right]=0.\end{eqnarray}$$
The terms I in the spatial variation of the flux correspond to the surface tension effects, term II to the variation due to the buoyancy force, and term III accounts for the reference frame moving with the drop. Note the anisotropy of the fluxes: both the buoyancy and the motion in the
 $x$
direction do not affect the flux in the
 $y$
direction, breaking the isotropy induced by the capillary pressure gradient.
Using the pancake radius
 $a$
as the characteristic length and
 $a/U_{d}$
as the characteristic time, the dimensionless lubrication equation for the steady profile in the dimensionless coordinate system
 $\bar{x},\bar{y}$
is written as (4.1).