I. INTRODUCTION
In recent years, polymer electrolyte fuel cells (PEFCs) have attracted increasing interest because they can provide clean energy with high efficiency. Pt has long been considered to be the most effective electroanode catalyst for PEFCs. However, Pt is a precious metal and can be easily poisoned by carbon monoxide (CO), which exists as an impurity in the fuel used in PEFCs. Reference Gasteiger, Markovic and Ross1–Reference Petrii and Tsirlina3 The catalytic properties of a metal can be markedly changed by alloying with a second metal. Reference Ponce and Bond4 Alloys provide a means by which the strength of bonds between metal and adsorbates can be modified, thus opening a mechanism by which catalytic chemistry can be controlled. Pt–Ru alloys are known to substantially improve the catalytic performance in the electrochemical oxidation of CO from CO contaminated hydrogen fuels or to suppress CO adsorption on the catalyst. The reason for these improvements has been a subject of many studies but still remains an unresolved issue. Within the ligand effect approximation, the addition of Ru increases the CO tolerance via electronic interactions that may reduce the Pt–CO bond strength, which may facilitate CO oxidation Reference Krausa and Vielstich5–Reference Tong, Kim, Babu, Waszczuk, Wieckowski and Oldfield7 or decrease CO adsorption. In the popular bi-functional mechanism, Reference Watanabe and Motoo8,Reference Yajima, Wakabayashi, Uchida and Watanabe9 it is assumed that Ru provides an oxygenated surface species by dissociating water at the Ru sites at lower potentials against the pure Pt catalyst, leading to accelerated CO2 formation and thus improving the tolerance of CO. The addition of Ru Reference Watanabe and Motoo8,Reference Watanabe and Motoo10 lowers the overpotential depending on the composition and atomic structure of the alloy.
Han et al. reported a density functional theory (DFT) that showed that alloying Pt with Ru on the surface only slightly enhances the adsorption energy of CO relative to that of pure Pt; after O or OH oxidized Ru, the adsorption energy of CO on neighboring Pt is dramatically reduced. Reference Hanand and Ceder11 Babu et al. have reported a series of electrochemical 195Pt and 13C nuclear magnetic resonance (NMR) experiments on commercial Pt–Ru alloy nanoparticles and Pt-black; their NMR and electrochemical data led to a novel configuration of Pt–Ru alloy nanoparticles having a Ru–rich core and a Pt–Ru alloy overlayer. Reference Babu, Kim, Oldfield and Wieckowski12,Reference Babu, Kim, Kuk, Chung, Oldfield, Smotkin and Wieckowski13 Takeguchi et al. reported a Pt2Ru3 nanoparticle alloy for anode catalysis with high CO tolerance. Reference Takeguchi, Yamanaka, Asakura, Muhamad, Uosaki and Ueda14 Due to the improvement of the catalytic reactivity of the alloy, it is of fundamental importance to understand the relationship between the alloy conformation and its role in the catalytic activity.
The ability to control the composition, shape, Reference Bratlie, Lee, Komvopoulos, Yang and Somorjai15–Reference Park, Jang, Kim and Son17 and architecture Reference Zhou, Varughese, Eichhorn, Jackson and McIlwrath18–Reference Park, Kim, Jun, Lee and Lee20 of multicomponent nanoparticle systems is of increasing importance in tailoring their properties. Bimetallic nanoparticle catalysts are prepared by impregnation/deposition methods that often yield well-dispersed, highly active systems; however, the details of their structure and local composition are difficult to ascertain and often remain ill-defined. Reference Hills, Nashner, Frenkel, Shapley and Nuzzo21,Reference Nashner, Frenkel, Adler, Shapley and Nuzzo22 For example, the structure and oxidation states of Pt and Ru in Pt–Ru alloy for active electrocatalysts remain a contentious topic. Reference Long, Stroud, Swider-Lyons and Rolison23 Monte Carlo (MC) and molecular dynamics simulations are useful to study the atomistic structure and thermodynamics of metal particles with sizes of up to several thousand atoms. Yuge et al. investigated the energetic stability, ground-state structures, and segregation behavior, including ordering effects, of Pt28Rh27 nanoparticles using first-principles calculations combined with the cluster expansion technique Reference Yuge24 and MC simulations. Alayoglu et al. differentiated the structural details of Ru–Pt core and Pt–Ru alloy nanoparticles based on a combination of transmission electron microscopy (TEM), energy dispersive spectroscopy (EDS), extended X-ray absorption fine structure spectroscopy (EXAFS), X-ray absorption near edge spectroscopy (XANES), and X-ray diffraction (XRD) studies that provided cumulative evidence for two different architectures. Reference Alayoglu, Zavalij, Eichhorn, Wang, Frenkel and Chupas25 Several groups have discussed the effect of CO on the kinetics of CO electro-oxidation using MC simulations. Reference Koper, Jansen, van Santen, Lukkien and Hilbers26–Reference Saravanan, Koper, Markovic, Head-Gordon and Ross32 To accelerate CO electro-oxidation on Pt–Ru alloy, two important issues are the ratio of the alloying atoms in the alloy composition and the determination of the conformation of Pt and Ru atoms on the active sites on the surface of the metal catalysts.
Surface segregation refers to the phenomenon by which the chemical composition at the surface of multicomponent materials differs from the composition in the bulk. Surface segregation has drawn much attention because it influences such material properties as adsorption, wetting, oxidation, and catalysis. Reference Dowben and Miller33–Reference Polak and Rubinovich35 Some theoretical groups have investigated the segregation tendency of Pt atoms to surfaces using DFT based potential parameters combined with MC simulations of Pd–Au, Reference Shan, Wang, Yang, Hyun, Kapur, Zhao, Nicholas and Cho36 Pt–Ni, Reference Wang, Van Hove and Ross37 and Pt–Rh Reference Yuge, Seko, Kuwabara, Oba and Tanaka38 nanoparticles. Recently, some experimental studies predicted that Pt2Ru3 nanoparticles can be a good candidate for highly CO tolerant anode catalysts for PEFCs, Reference Sato, Okaya, Kunimatsu, Yano, Watanabe and Uchida39,Reference Sato, Kunimatsu, Okaya, Yano, Watanabe and Uchida40 and the structures of the anode catalysts were analyzed by EXAFS. Reference Takeguchi, Yamanaka, Asakura, Muhamad, Uosaki and Ueda14 However, the detailed conformation of Pt and Ru atoms in Pt2Ru3 alloy particles is still obscure. Therefore, a greater understanding of the atomic conformation in Pt2Ru3 alloy is required to improve the catalytic performance of Pt2Ru3.
In the present study, we concentrate on the study of the atomic conformation of Pt and Ru atoms in Pt2Ru3 alloy particles to discuss the segregation behavior of Pt and Ru; we also discuss the effects of particle size and temperature. We have combined quantum chemical calculations with MC simulations to investigate the energetic equilibrium conformation of alloy systems. DFT calculations were conducted and analyzed by quantitative structure–property relationship (QSPR) to correlate the structural information and total binding energy of the system. Furthermore, MC simulations were carried out for particle configurations of Pt2Ru3 of different sizes at different temperatures to elucidate the equilibrium conformation of atoms in the nanoparticles.
II. METHODS
A. DFT
DFT calculations were performed to calculate the binding energy of alloys and their optimized geometry using DMol3 implemented in Materials Studio (BIOVIA Inc., San Diego, California). Reference Delley41,Reference Delley42 The physical wave functions were expanded in terms of the accurate numerical basis sets. The effective core potential and double numerical basis with polarization functions were chosen for all calculations. The generalized gradient approximation functional developed by Perdew–Burke–Ernzerhof Reference Perdew, Burke and Ernzerhof43 was used. The convergence tolerances for energy, maximum force, and maximum displacement were less than 1.0 × 10⁻⁵ Ha, 0.002 Ha/Å, and 0.005 Ha/Å, respectively. The k-point was set to 2 × 2 × 1. The dipole slab correction was applied.
We configured the periodic slab to represent the Pt2Ru3 alloy surface (111) as being ordered face-centered cubic (fcc) or hexagonally close-packed (hcp). We chose a number of configurations for different conformations of Pt and Ru atoms while maintaining Pt:Ru = 2:3. For the slab configurations, a 2 × 2 unit cell was used. The cell parameters were a = b = 5.5492 Å, c = 19.05 Å, α = β = 90°, and γ = 120° for the Pt-based fcc structures and a = b = 5.4116 Å, c = 19.05 Å, α = β = 90°, and γ = 120° for the Ru-based hcp structures. Vacuum spaces above the slab surface were created in these two unit cells with a thickness of about 10 Å. During geometry optimization, all atoms were allowed to be relaxed; however, the cell size was fixed. The calculated nearest neighbor bond distances of Pt–Ru for our systems after geometry optimization are 2.759 Å for Pt-based fcc and 2.741 Å for Ru-based hcp, which are in good agreement with previously reported theoretical values, Reference Alam, Saito and Takaba44–Reference Shubina and Koper46 although the mixing ratio of Pt and Ru in our system is slightly different.
The binding energy (E b) of the Pt2Ru3 configurations was calculated using Eq. (1)
 $${E_{\rm{b}}} = {E_{{\rm{total}}}} - M\left( {{E_{{\rm{Pt}}}}} \right) - N\left( {{E_{{\rm{Ru}}}}} \right)\quad ,$$
where E total is the total energy of the system, E Pt is the energy of one Pt atom, and E Ru is the energy of one Ru atom. M and N are the numbers of Pt and Ru atoms in the system, respectively. The calculated binding energies for various slab configurations were used in the QSPR analysis to construct a regression equation representing a binding energy as a function of structural descriptors.
B. MC simulations
MC is a useful theoretical method to study chemical reaction kinetics. Reference Lee, Yang and Parr47,Reference Hansen and Neurock48 In this study, MC simulations based on the Metropolis algorithm Reference Reuter, Frenkel and Scheffler49,Reference Allen and Tildesley50 were used to investigate the stable conformations of Pt and Ru atoms in Pt2Ru3 alloy nanoparticles at certain temperatures.
According to the Boltzmann distribution, the probability q of the configuration transformation is given by a Boltzmann factor for the change in energy ΔE,
 $$q = \exp \left( {{{\Delta E} \mathord{\left/ {\vphantom {{\Delta E} {{k_{\rm{B}}}T}}} \right. \kern-\nulldelimiterspace} {{k_{\rm{B}}}T}}} \right)\quad ,$$
where k B is the Boltzmann constant and T is the temperature. If q ≧ 1 (decrease in energy) the new configuration is always retained, while if q < 1 (increase in energy), the new configuration is retained with probability q. After repeating the above procedures for multimillion MC steps, the equilibrium position of atoms is obtained by averaging over the resulting configurations. In this study, ΔE is the difference of binding energy between two different conformations of Pt and Ru atoms. In an MC step, one atom in the configuration was randomly chosen; its atomic position was then exchanged with that of a neighboring atom. The binding energy difference was calculated for these new and old atomic conformations. To repeat this procedure, the binding energy should be calculated quickly. We used a regression Eq. (3) to calculate the binding energy from the descriptors that are easily evaluated only from the conformation of Pt and Ru atoms in the nanoparticle. In our MC simulations, the activation energy for the displacement of atoms is not considered. Therefore, the obtained conformation of atoms from our MC simulations is the equilibrium conformation.
MC simulations were carried out for configurations of nm-sized nanoparticles of Pt2Ru3 alloy with random mixing of Pt and Ru atoms where the atoms of same element were arranged not to be the next. Four types of nm sized particles were prepared with number of atoms, 60, 309, 923, and 1241, corresponding to the diameters of 1.0, 2.0, 3.0, and 3.5 nm, respectively. All the particle shapes were fcc polyhedron, which was obtained from the Pt-based fcc lattice. The surfaces were composed of (111) and (100) surfaces. The temperatures of the MC simulations were in the range from 150 to 373 K.
C. QSPR
QSPR is used to quantify and relate determining factors for a particular measured property with molecular features of a given system of chemical compounds. Building a QSPR configuration is an inductive process that depends on a set of compounds with predetermined properties. The key step in developing comprehensive configurations is the selection of an informative and representative data set, i.e., training set data. Reference Eriksson, Johansson, Muller and Wold51–Reference Consonni, Ballabio and Todeschini55 In this study, we used the DFT results as the data set and multilinear regression (MLR) in QSPR modeling as the generation of the regression coefficients. MLR is an extension of simple linear regression including more than one dependent variable. As with simple linear regression, the regression coefficients of MLR for each independent variable are determined so that the sum of the squares of the errors is minimized. Thus, the general multilinear equation can be written in the following form:
 $$Y = {b_0} + {b_1}{x_1} + {b_2}{x_2} + \ldots \ldots + {b_p}{x_p}\quad ,$$
where Y is the dependent variable, which is the binding energy of the system in this study. Additionally, x p represents the descriptors, b 1 to b p are the regression coefficients, and b 0 is the intercept.
We have considered the most common parameters (denoted as R 2), which are often referred to as configuration fitness and internal validation (Q 2), which predicts Y using the regression equation calculated from the data for all remaining compounds of the QSPR configuration. The predictive squared correlation coefficient Q 2 was calculated by methods based on a form of sample reuse, such as leave-one-out and leave-more-out cross validation, as defined using the equation,
 $${Q^2} = 1 - {{\sum\limits_{i = 1}^n {{{\left( {\widehat {{y_i}} - {y_i}} \right)}^2}} } \over {\sum\limits_{i = 1}^n {{{\left( {{y_i} - \bar y} \right)}^2}} }} = 1 - {{{\rm{PRESS}}} \over {{\rm{TSS}}}}\quad ,$$
where n is the total number of objects in the entire data set, TSS is the total sum of squares, that is, the sum of squared deviations from the data set mean, and PRESS is the sum of squares of the prediction errors.
III. RESULTS AND DISCUSSION
A. Binding energy
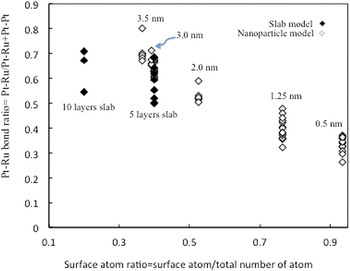
The binding energies of Pt2Ru3 alloy were calculated by DFT using periodic slab configurations. In Pt2Ru3 alloy, the Pt–Ru bond is considered to be an important factor in the removal of CO from Pt to achieve high CO tolerance PEFCs. Reference Takeguchi, Yamanaka, Asakura, Muhamad, Uosaki and Ueda14 This is probably because the number of Pt atoms exposed on the nanoparticle surface has a relationship to the number of Pt–Ru bonds in the nanoparticle. In this study, we focus on the number of Pt–Ru bonds for constructing slab configurations. Figure 1 shows the Pt–Ru bond ratio versus surface atom ratio in Pt2Ru3 alloy. Here, we have configured different sizes of nanoparticles and slabs of Pt2Ru3 alloy. A number of configurations have been analyzed for each size of the clusters and slabs for different conformations of Pt and Ru atoms, of 0.5–3.5 nm cluster size, as shown in Fig. 1. For the slab configuration, we considered a number of slab configurations of five layers, as shown in Figs. 2(a) and 2(b); 10 layer slab configurations are not shown here. From Fig. 1, it can be noted that in the particle configurations, the Pt–Ru bond ratio increased with the increasing particle size. The values of the Pt–Ru bond ratio also show a broader distribution because of their different Pt–Ru atomic conformations, even though the surface atom ratio was the same. In this study, the surface structures of the nanoparticles are configured as five layer slabs because the Pt–Ru bond ratio of the slab is comparable to a cluster size of Pt2Ru3 of about 3.0 nm, as shown in Fig. 1.

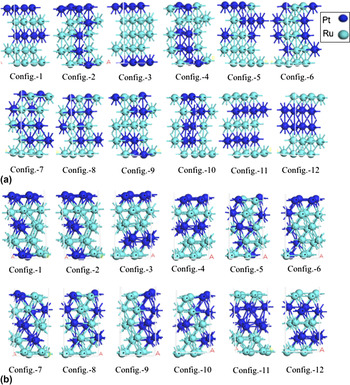
(a) Slab configurations of Pt2Ru3 alloy based on Pt-based fcc structures for different conformations of Pt and Ru atoms. (b) Slab configurations of Pt2Ru3 alloy based on Ru-based hcp structures for different conformations of Pt and Ru atoms.

Figure 2(a) shows the typical arrangement of atoms in a five layer slab of Pt-based (fcc) Pt2Ru3 alloy, and Fig. 2(b) is the typical arrangement of atoms of Ru-based (hcp) Pt2Ru3 alloy. In the Pt-based structures, Pt atoms were randomly substituted by Ru atoms while maintaining a ratio of 2:3 for Pt and Ru atoms, respectively; 12 configurations were prepared with different conformations, as shown in Fig. 2(a). In the Ru-based structures, we followed the same procedure; here, Ru atoms were substituted by Pt atoms, and twelve different configurations were prepared which maintained the same Pt:Ru ratio of 2:3 with different conformations [Fig. 2(b)].
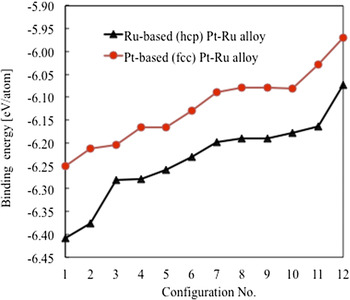
In Fig. 3, we plotted calculated binding energies for both fcc and hcp structures of Pt2Ru3 alloys for all configurations shown in Figs. 2(a) and 2(b). The results shown in Fig. 3 indicate that the relative position of the alloying atoms affects the stability of the system. The binding energy change indicates that the Pt-based fcc structures show higher stability than the Ru-based hcp structures. Among the slab structures of Pt2Ru3 alloys, configurations 1 to 3 for both Pt- and Ru-based structures showed relatively stable conformations. In both cases, we noticed that the top surfaces of these structures are fully covered with Pt atoms, and the second layer of these structures is mainly positioned with the Ru atoms or a higher ratio of Ru atoms, as shown in Fig. 2. In less stable structures (configurations 11 and 12) for both the Pt-and Ru-based configurations, the top surfaces are fully covered with Ru atoms, while the 2nd layers are positioned with the Pt atoms. The other structures were obtained by randomly mixing the Pt and Ru atoms whose top surface and 2nd layer are composed of both Pt and Ru atoms; their stability lies between the most and least stable structures. This energy change sequence indicated that surface coverage with Pt or a higher ratio of Pt atoms would exhibit high stability compared with other mixing conformations as shown in Fig. 3. In Pt2Ru3 alloys, Pt has an fcc structure, while Ru has an hcp structure Reference Antolini, Giorgi, Cardellini and Passalacqua56,Reference Yamamoto, Kageyama, Seino, Nitani, Nakagawa, Horioka, Honda, Ueno and Daimon57 ; hence, bonds between like atoms (Pt–Pt, Ru–Ru bonds) were preferentially formed over bonds between unlike atoms (Pt–Ru bonds). Reference Cheng, Huang and Wang58,Reference Cheng, Huang and Wang59
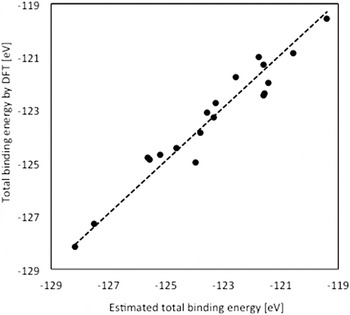
Comparison of the calculated total binding energies from DFT and a regression equation for slab configurations of the Pt-based fcc (circle) and Ru-based hcp (triangle) structure of Pt2Ru3.

B. Regression equation
To estimate binding energy in the MC simulations, a regression equation was constructed using the results of DFT. As descriptors, structural factors estimated from the atomic coordination were considered. We selected two structural factors: the number of neighboring atoms and the type of bonding between the target atom and its neighboring atoms. The regression coefficients of MLR were determined so that the sum of the squares of the errors in the binding energy of the investigated slab configurations, which have different conformations of Pt and Ru atoms (Fig. 2), is a minimum.
Consequently, 9 descriptors were selected for representing the regression equation. The regression coefficients for selected 9 descriptors are summarized in Table I. Herein, the b i–j indicates the coefficient for the descriptor that is the number of bonds between atoms i and j (i = Pt or Ru, j = Pt or Ru or S). When i atom locates on the top or bottom layer, j should be S and one is added to the descriptors of x i–S . The b i–j– represents the number of bonds between targeted atom i and neighboring atom j located outside the layer. A negative value of a regression coefficient lowers a binding energy of the system. The positive small value of b Pt–Pt, 0.0048, seems to be inconsistent with the fact that segregation of Pt atoms is favorable conformation as suggested by DFT calculations. The absolute value of b Pt–Pt is, however, negligible compared to that of b Ru–Ru. This means that the effect of conformation stability induced by a segregation of Pt atoms on binding energy is included in the negative coefficient of b Ru–Ru. Figure 4 represents the correlation of the predicted binding energy with the binding energy from DFT for the considered configurations. The calculated values of R 2 and Q 2 from our regression equation are 0.930 and 0.921, which are acceptable values. Reference Consonni, Ballabio and Todeschini55,Reference Roy, Paul, Mitra and Roy60,Reference Katritzky, Kuanar, Slavov and Dennis Hall61
Estimated regression coefficients of MLR for the calculation of binding energy.

Correlation between the calculated total binding energy by DFT and the estimated total binding energy from MLR for the investigated slab configurations.

C. Equilibrium conformation
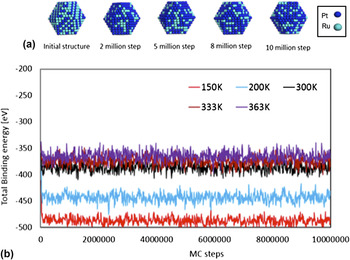
To determine a stable conformation of atoms in Pt2Ru3 alloy particles, we performed MC simulations on a 3.0 nm nanoparticle configuration by randomly mixing Pt and Ru atoms. ∆E in Eq. (2) are calculated using the regression equation with the coefficients shown in Table I. MC simulations were performed up to 10 million steps. Some snapshots and energy change diagrams of the total binding energy are shown in Figs. 5(a) and 5(b), respectively. The initial structure of the Pt2Ru3 alloy particle surface is randomly covered with Pt or Ru atoms, and their amounts are almost equal (slightly Ru rich). From the snapshots of the MC simulations, which were carried out at 300 K, it can be seen that the number of Pt atoms on the surface increased with the increasing simulation time. The systems seem to reach the equilibrium position even after 2 million of the simulation, which is confirmed by the total binding energy diagram shown in Fig. 5(b).
(a) Snapshots of 3.0 nm nanoparticle configuration at each MC steps from MC simulations at 300 K. (b) Change in the total binding energies of 3.0 nm nanoparticles during Monte Carlo simulations at different temperatures (150–363 K).

MC simulations were carried out for the same initial structure configuration at different temperatures (150, 200, 300, 333, and 363 K). From Fig. 5(b), it can be seen that the total binding energies increase with the increasing temperature. The analysis of the atomic conformation of the Pt2Ru3 nanoparticle indicated that the Pt atoms were segregated and rose to the surface, while the Ru atoms were mainly positioned at subsurface or core sites, which is consistent with experimental findings. Reference Sato, Okaya, Kunimatsu, Yano, Watanabe and Uchida39,Reference Nitani, Nakagawa, Daimon, Kurobe, Ono, Honda, Koizumi, Seino and Yamamoto62
To elucidate the size effect on the equilibrium atomic conformation of Pt2Ru3 nanoparticles, we considered atomic conformations with different sizes (1.0, 2.0, 3.0, and 3.5 nm). We considered that as the initial atomic conformation in Pt2Ru3 alloys the Pt ratios on the surface were set at around 0.45 for all the nanoparticles. Four snapshots were taken for each configuration from the MC simulations at 300 K, as shown in Fig. 6(a). As can be seen in this figure, the Pt ratio on the surface increases with increasing simulation time; it reaches around 0.55 to 0.65 in the equilibrium conformations. In Fig. 6(b), for the 1.0 nm particle, it appears that the Pt ratio on the surface was almost constant around 0.5 during the simulation because in the initial structure, all the Pt atoms located on the surface persisted throughout the simulations. It is also indicated that the structural changes depend on the initial positions of Pt and Ru atoms on the surface. However, in the randomly mixed conformations of Pt and Ru atoms of larger nanoparticles (2.0, 3.0, and 3.5 nm), the tendencies of Pt atoms to segregate to the surface before reaching the equilibrium position are similar. This tendency is consistent with our DFT results in that the structure, where Pt atoms are positioned on the top surface while Ru atoms are positioned on the subsurface, is energetically stable. Other MC studies have been also reported where Pt segregation behavior on the surface of Pt-based nanoparticles (Pt–Ni, Pt–Re, and Pt–Mo) was observed. Reference Wang, Hove, Ross and Baskes63 Figure 6(b) shows that there are some differences in the Pt ratio on the surface between different sizes of nanoparticles; the ratio increases with increasing particle size. Therefore, our study demonstrates that controlling the nanoparticle size can tailor the surface ratio of the alloying elements, which will affect the overall catalytic performance. Reference Wang, Hove, Ross and Baskes64
(a) Snapshots of nanoparticle configurations at each MC steps at 300 K. (b) Pt ratio against total number of atoms on the surface for different sizes of nanoparticles with MC simulation steps.

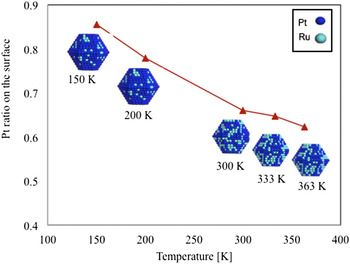
The temperature dependency of the Pt ratio on the surface was investigated by MC simulations. Figure 7 shows the temperature dependency of Pt ratio on the surface for the nanoparticles with a size of 3.5 nm. As shown in this figure, the Pt/Ru ratio on the surface increases with decreasing temperature. This means that a more energetically unstable conformation appears at higher temperatures. This temperature dependency may require more careful investigation because the slope of the Pt ratio depends on the accuracy of the binding energy used in MC simulation although the qualitative temperature dependency can be discussed based on our simulations.
Change in the Pt ratio on the surface of Pt2Ru3 nanoparticle with a size of 3.5 nm with temperature 150 K–363 K.

IV. CONCLUSIONS
In our study, we have applied the combined DFT and MC to investigate the equilibrium conformation of Pt2Ru3 alloy particles used as anode catalysts in PEFCs. We have investigated the stability of Pt2Ru3 alloys for both periodic and non-periodic structures. From the DFT study, it is shown that in the Pt2Ru3 alloy slab configuration, a top surface covered with Pt atoms or a higher ratio of Pt resulted in higher stability than the other atomic conformations, and for stable structures, the second layer was preferentially composed of Ru atoms or a higher ratio of Ru atoms. The number of Pt–Ru bonds in a nanoparticle of Pt2Ru3 increases with the increasing particle size. MC simulations were conducted to investigate the segregation behavior of atoms for particle configurations with different particles sizes and at different temperatures. The segregation behavior indicated that most of the Pt atoms must be exposed to the surface to reach the equilibrium state. We also noticed from the simulations that the Pt ratio on the surface increased with increasing particle size, and that most of the Pt atoms were located on the surface, whereas most of the Ru atoms were located at the subsurface or core sites. It is demonstrated that the Pt ratio on the surface increases with the decreasing temperature. This may imply that the catalytic activity of Pt2Ru3 in fuel cells is influenced by elevating the temperature.