1. Introduction
In de Finetti’s optimal dividend problem, the aim is to maximize the total expected discounted dividends accumulated until ruin. Intuitively, as the risk of ruin must be considered, dividends should be paid only when there is a sufficient amount of surplus available. With this conjecture and under the assumption of stationary increments of the underlying process (in the Lévy cases), the optimality of a barrier strategy that pays out any amount above a certain barrier has been pursued in various papers. Because the resulting controlled process becomes a classical reflected process, existing fluctuation theoretical results have been efficiently applied to solve explicitly the problem, at least under suitable conditions. See, among others, Avram et al. [Reference Avram, Palmowski and Pistorius2] for the spectrally negative case and Bayraktar et al. [Reference Bayraktar, Kyprianou and Yamazaki4] for the spectrally positive (dual) case.
Despite these important works, there are several disputes about the classical model in the sense that the set of admissible strategies is too large and contains those that are in reality impossible to implement. For example, under the barrier strategy that is shown to be optimal, ruin must occur almost surely, and this is rather an undesirable conclusion. In addition, companies in reality cannot focus on dividend maximization and instead need to take into account the impacts of bankruptcy to themselves and also to the market. For these reasons, in the past decade, several extensions have been considered so as to obtain a more realistic model, by considering more restricted sets of admissible strategies.
Motivated by these, in this paper we focus on the model with the absolutely continuous condition on the dividend strategy and additional condition on the time of ruin. We consider both cases driven by spectrally negative and positive Lévy processes.
Regarding the absolutely continuous condition, it is assumed that the rate at which dividends are paid is bounded. More specifically, the dividend strategy must be absolutely continuous with respect to the Lebesgue measure with its density bounded by a given constant. Under some assumptions on the jump measure (e.g. the completely monotone Lévy density assumption as in the current paper), analogously to the barrier strategy that is optimal in the classical case, the threshold strategy—that pays dividends at the maximal rate as long as the surplus is above a certain fixed level—is optimal in this case. For a spectrally negative Lévy surplus process, Kyprianou et al. [Reference Kyprianou, Loeffen and Pérez12] showed the optimality of the threshold strategy under a completely monotone assumption on the Lévy measure. The spectrally positive Lévy model has been solved by Yin et al. [Reference Yin, Wen and Zhao22]. In both cases, the optimally controlled process becomes the refracted Lévy process of Kyprianou and Loeffen [Reference Kyprianou and Loeffen11], and the fluctuation identities for this process can be used efficiently to solve de Finetti’s problem under the absolutely continuous condition.
Following the recent work of Hernández et al. [Reference Hernández, Junca and Moreno-Franco8], we study the case in which the longevity feature is added to the problem by considering a constraint on the time of ruin. The longevity aspect of the firm remained as a separate problem; see [Reference Schmidli20] for a survey on this matter. Despite efforts to integrate both features [Reference Grandits6], [Reference Paulsen17], [Reference Thonhauser and Albrecher21], it was not until very recently a successful solution to a model that actually accounts for the trade-off between performance and longevity was presented. Hernández and Junca [Reference Hernández and Junca7] considered de Finetti’s problem in the setting of Cramér–Lundberg reserves with i.i.d. exponentially distributed jumps adding a constraint to the expected time of ruin of the firm.
The contribution of this paper is twofold.
1. We first solve the optimal dividend problem with a terminal value at ruin under the absolutely continuous assumption. We solve this problem for the spectrally negative Lévy case under the assumption that the Lévy measure has a completely monotone density and also for the general spectrally positive Lévy case. In both models we show that a threshold strategy is optimal (see Theorems 4.1 and 6.1). The optimal refraction level as well as the value function are concisely expressed in terms of the scale function.
Its optimality is confirmed by a verification lemma.
2. We then use these results to solve the constrained dividend maximization problem over the set of strategies that satisfy a particular constraint on the ruin time. This is an extension of [Reference Hernández, Junca and Moreno-Franco8] under the absolutely continuous assumption. Theorem 5.1 shows the result when the reserves are modeled by a spectrally negative Lévy process with a completely monotone Lévy density and Theorem 6.2 for the general dual model.
The rest of the paper is organized as follows. In Section 2, we formulate the problem. In Section 3, we present an overview of scale functions and some fluctuation identities related to spectrally negative Lévy processes and their respective refracted processes. In Section 4, we solve the optimal dividend problem with a terminal cost and the absolutely continuous assumption for the case of a spectrally negative Lévy process with a completely monotone Lévy density. In Section 5, we extend the results to solve the constrained dividends problem. In Section 6, we solve the same problems for the spectrally positive case. Finally, in Section 7, we give some numerical results.
2. Formulation of the problem
In this section, we formulate the constrained de Finetti problem driven by a spectrally negative Lévy process. The spectrally positive Lévy process is its dual and a slight modification is only needed to formulate the spectrally positive case (see Section 6).
2.1. Spectrally negative Lévy processes
Recall that a spectrally negative Lévy process is a stochastic process, which has càdlàg paths and stationary and independent increments such that there are no positive discontinuities. To avoid degenerate cases in the forthcoming discussion, we shall additionally exclude from this definition the case of monotone paths. This means that we are not interested in the case of a deterministic increasing linear drift or the negative of a subordinator. Henceforth, we assume that  $X=\{X_t\colon t \ge 0\}$ is a spectrally negative Lévy process defined on a probability space
 $ (\Omega,\mathcal{F},\mathbb{P})$ with Lévy triplet given by
 $ (\gamma, \sigma, \Pi)$, where
 $\gamma \in {\mathbb{R}}$,
 $\sigma\ge 0,$ and
 $\Pi$ is a measure concentrated on
 $ (0,\infty)$ satisfying
 \begin{equation} \int_{(0,\infty)}(1\wedge z^2)\Pi({\rm d}z)\lt\infty.\end{equation}
The Laplace exponent of X is given by
 \begin{equation}\psi(\lambda)= \log \mathbb{E} [ {\rm{e}}^{\lambda X_1} ] = \gamma \lambda+\frac12\sigma^2\lambda^2 - \int_{(0,\infty)} ( 1-{\rm{e}}^{-\lambda z}-\lambda z\mathbf{1}_{\{0<z\leq1\}} )\Pi(\mathrm{d}z),\end{equation}
which is well defined for  $\lambda\geq0$. Here
 $\mathbb{E}$ denotes the expectation with respect to
 $\mathbb{P}$. In addition, the reader should note that, for convenience, we have arranged the representation of the Laplace exponent in such a way that the support of the Lévy measure is positive even though the process experiences only negative jumps. As a strong Markov process, we shall endow X with probabilities
 $\{\mathbb{P}_x \colon x\in\mathbb{R}\}$ such that, under
 $\mathbb{P}_x,$ we have
 $X_0 = x$ with probability 1. Note that
 $\mathbb{P}_0=\mathbb{P}$ and
 $\mathbb{E}_0= \mathbb{E}$.
The spectrally negative Lévy process X has paths of bounded variation if and only if  $\sigma=0$ and
 $\smash{\int_{(0,1]}z\Pi(\mathrm{d}z)} \lt \infty$, in which case, X can be written as
 \begin{equation}X_t=ct-S_t, \qquad t\geq 0,\end{equation}
where  $c\ :\!=\gamma+\smash{\int_{(0,1]}z\Pi(\mathrm{d}z)}$ and
 $\{S_t\colon t \ge 0\}$ is a drift-less subordinator. Note that we must have
 $c \gt 0$, since it is assumed that X does not have monotone paths.
In the classical model of the wealth of an insurance company, premium is received at a constant rate c whereas F-distributed claims arrive at the jump times of a Poisson process with rate  $\mu$. The corresponding surplus process is called the Cramér–Lundberg risk process and is a special case of the spectrally negative Lévy process with
 $\gamma=c-\smash{\mu\int_{(0,1]}z F({\rm d} z)}$,
 $\sigma=0$, and
 $\Pi = \mu F$.
2.2. Admissible strategies
Let  $D=\{ D_t\colon t \ge q 0 \}$ be a dividend strategy, meaning that it is a nonnegative and nondecreasing process adapted to the completed and right continuous filtration
 $\mathbb{F}\ :\!=\{\mathcal{F}_t \colon t\ge q 0\}$ of X. Here, for each fixed
 $t\geq0$, the quantity
 $D_t$ represents the cumulative dividends paid out up to time t by the insurance company whose risk process is modeled by X. The controlled Lévy process becomes
 $U^D=\{\smash{U^D_t}= X_t - D_t \colon t\ge q 0\}$ and we write
 \begin{align}\tau^D\ :\!= \inf\{t \gt 0\colon U^D_t \lt 0 \}\end{align}
for the time at which ruin occurs when the dividend payments are taken into account.
In this work, we are interested in adding a constraint to the dividend processes. Specifically, we will only work with absolutely continuous strategies of bounded rate, i.e.
 \begin{equation}D_t=\int_0^{t}d(s){{\rm{d}}}s,\qquad t\geq0,\end{equation}
such that the dividend rate d satisfies  $0\leq d(t)\leq\delta$ for
 $t\geq0$, where
 $\delta>0$ is a ceiling rate. We will denote by
 $\Theta$ the family of admissible strategies satisfying the conditions mentioned above.
2.3. Constrained de Finetti’s problem and its dual
The expected net present value under the dividend policy  $D\in\Theta$ with discounting at rate
 $q>0$ and initial capital
 $x\geq 0$ is given by
 \begin{equation}v^{D}(x) = \mathbb{E}_x\bigg[\int_0^{\tau^{D}} {\rm{e}}^{-qt}\mathrm{d}D_t\bigg].\end{equation}
The dividend problem, originally considered by de Finetti, asks to maximize the expected net present value of dividend payments over the set of strategies  $\Theta$.
Now, as studied in [Reference Hernández, Junca and Moreno-Franco8], we are interested in addressing a modification of this problem by adding a restriction to the dividend process D, which is given by the constraint
 \begin{equation}\mathbb{E}_x[{\rm{e}}^{-q\tau^D}]\leq K,\qquad 0 \leq K\leq 1\text{ fixed.}\end{equation}
Strategies in  $\Theta$ satisfying this constraint are called feasible, and are called infeasible otherwise.
Remark 2.1. By this constraint, we consider only strategies that avoid early ruin of the company. The classical problem corresponds to the case with  $K=1$. By selecting the constraint written in terms of the expectation of
 $\smash{{\rm{e}}^{-q\tau^D}}$, the Lagrangian subproblem (considered in Section 5) can be solved explicitly using the scale function and hence the constrained case as well. It is also of interest to consider other constraints, e.g.
 $\smash{\mathbb{E}x_x[{\rm{e}}^{-p \tau^D}]\leq K}$ for
 $p \neq q$ and
 $\mathbb{E}x_x[\tau^D ]\leq K$. However, in these cases, the techniques in this paper cannot be directly applied, and the optimality of a threshold strategy may not hold.
We want to maximize the expected net present value of dividend payments over the set of feasible strategies. That is, we aim to solve the optimization problem, for  $x\geq0$ and
 $0 \leq K \leq 1$,
 \begin{equation}V(x;\ K)\ :\!=\sup_{D\in\Theta}v^D(x)\quad\text{such that}\quad\mathbb{E}_x[{\rm{e}}^{-q\tau^D}]\leq K,\end{equation}
where, in the case  $\smash{\mathbb{E}_x [{\rm{e}}^{-q\tau^D} ] \gt K}$ for all
 $D \in \Theta$, we set
 $V(x;\ K)= -\infty$ and call problem (2.2) infeasible.
Proceeding as in [Reference Hernández, Junca and Moreno-Franco8], we use Lagrange multipliers to reformulate the problem. For  $\Lambda\geq0,$ we define the function
 \begin{equation}v_{\Lambda}^D(x;\ K)\ :\!=v^D(x)+\Lambda(K-\mathbb{E}_x[{\rm{e}}^{-q\tau^D}]).\end{equation}
Note that we can write problem (2.2) as  $V(x;\ K)=\smash{\sup_{D\in\Theta}\inf_{\Lambda\geq0}v_{\Lambda}^D}(x;\ K)$ since any infeasible strategy D will make
 $\smash{\inf_{\Lambda\geq0}v_{\Lambda}^D(x;\ K)}=-\infty$, and any feasible strategy D will make
 $\smash{\inf_{\Lambda\geq0}v_{\Lambda}^D(x;\ K)=v^D_0 (x;\ K)=v^D(x)}$.
The dual problem of (2.2) is obtained by interchanging the  $\sup$ with the
 $\inf$ in the expression above, yielding an upper bound,
 \begin{equation}V(x;\ K)=\sup_{D\in\Theta}\inf_{\Lambda\geq0}v_{\Lambda}^D(x;\ K) \leq\inf_{\Lambda\geq0} V_{\Lambda}(x;\ K),\end{equation}
where
 \begin{align}V_{\Lambda}(x;\ K)\ :\!= \sup_{D\in\Theta} v_{\Lambda}^D(x;\ K).\end{align}
Therefore, the main goal is to prove that  $V(x;\ K)=\inf_{\Lambda\geq0}\displaystyle V_{\Lambda}(x;\ K)$ and to find, if it exists, an optimal
 $\Lambda$ (Lagrange multiplier) with which the infimum is attained. In order to do this, we will first solve (2.5).
We remark that if we set
 \begin{align}V_\Lambda(x)\ :\!=V_\Lambda(x;\ 0) \quad\textrm{and}\quad v_\Lambda^D(x) :\!=v_\Lambda^D(x;\ 0), \quad D \in \Theta,\end{align}
then  $\smash{v_\Lambda^D(x;\ K) = v_\Lambda^D(x) + \Lambda K}$ and hence,
 $V_\Lambda(x;\ K) =V_\Lambda(x) + \Lambda K$. Therefore, solving (2.5) is equivalent to solving
 \begin{equation}V_{\Lambda}(x)\ :\!=\sup_{D\in\Theta}v_{\Lambda}^D(x).\end{equation}
3. Review of scale functions
In this section, we review the scale function of spectrally negative Lévy processes. First, we define the process  $Y=\{Y_t=X_t-\delta t \colon t \ge 0\}$ with its Laplace exponent
 \begin{align}\psi_Y(\theta)\ :\!= \psi(\theta) - \delta \theta, \qquad \theta \geq 0.\end{align}
We assume here that Y is a spectral negative Lévy process and not the negative of a subordinator (see Assumption 4.3).
Fix  $q \gt 0$. Following the same notation as in [Reference Kyprianou and Loeffen11], we use
 $\smash{W^{(q)}}$ and
 $\smash{\mathbb{W}^{(q)}}$ for the scale functions of X and Y, respectively. These are the mappings from
 $\mathbb{R}$ to
 $[0,\infty)$ that are 0 on the negative half-line, while on the positive half-line they are strictly increasing functions that are defined by their Laplace transforms,
 \begin{align}\begin{split}\int_0^\infty {\rm{e}}^{-\theta x} W^{(q)}(x) {\rm{d}} x = \frac 1{\psi(\theta)-q}, \qquad \theta \gt \Phi(q),\\\int_0^\infty {\rm{e}}^{-\theta x} \mathbb{W}^{(q)}(x) {\rm{d}} x = \frac 1{\psi_Y(\theta) -q}, \qquad \theta \gt \varphi(q),\end{split}\end{align}
where
 \begin{align}\Phi(q)\ :\!= \sup \{ \lambda \geq 0\colon \psi(\lambda) = q\}\quad\textrm{and}\quad \varphi(q) :\,= \sup \{ \lambda \geq 0\colon\psi_Y(\lambda) = q\}.\end{align}
By the strict convexity of  $\psi$ on
 $[0, \infty)$, we derive the strict inequality
 $\varphi(q) \gt \Phi(q) \gt 0$.
We also define, for  $x \in \mathbb{R}$,
 \begin{align}\overline{W}^{(q)}(x)\ &:\!= \int_0^x W^{(q)}(y) {\rm{d}}y,\\Z^{(q)}(x)\ &:\!= 1 + q \overline{W}^{(q)}(x),\\\overline{Z}^{(q)}(x)\ &:\!= \int_0^x Z^{(q)} (z) {\rm{d}}z = x + q \int_0^x\int_0^z W^{(q)} (w) {\rm{d}}w {\rm{d}}z.\end{align}
Noting that  $\smash{W^{(q)}(x) }= 0$ for
 $-\infty \lt x \lt 0$, we have
 \begin{align}\overline{W}^{(q)}(x) = 0, \qquad Z^{(q)}(x) = 1, \quad\textrm{and}\quad\overline{Z}^{(q)}(x) = x, \quad x \leq 0.\end{align}
In addition, we define  $\smash{\overline{\mathbb{W}}^{(q)},\mathbb{Z}^{(q)}},$ and
 $\smash{\overline{\mathbb{Z}}^{(q)}}$ analogously for Y. The scale functions of X and Y are related for
 $x \in \mathbb{R}$ by the equality
 \begin{align}&\delta\int_0^x\mathbb{W}^{(q)}(x-y)W^{(q)}(y){\rm{d}}y=\overline{\mathbb{W}}^{(q)}(x)-\overline{W}^{(q)}(x).\end{align}
This can be confirmed by showing that the Laplace transforms on both sides are equal.
Regarding their asymptotic behaviors, we have, as in Lemmas 3.1 and 3.2 of [Reference Kuznetsov, Kyprianou and Rivero9],
 \begin{align}\begin{split}W^{(q)} (0) &=\begin{cases}0 & {\rm{if}} \, X \, {\rm{is \, of \, unbounded \, variation}},\\c^{-1} & {\rm{if}} \, X \, {\rm{is \, of \, bounded \, variation}},\end{cases}\\\mathbb{W}^{(q)} (0) &=\begin{cases}0 & {\rm{if}} \, Y \, {\rm{is \, of \, unbounded \, variation}},\\(c-\delta)^{-1} & {\rm{if}} \, Y \, {\rm{is \, of \, bounded \, variation}},\end{cases}\end{split}\end{align}
and
 \begin{align}\begin{split}W^{(q)\prime} (0+)\ &:\!=\lim_{x \downarrow 0}W^{(q) \prime} (x) =\begin{cases}\displaystyle{\frac{2}{\sigma^2}} & \textrm{if }\sigma \gt 0,\\\infty & \textrm{if }\sigma = 0 \; \textrm{and} \; \Pi(0, \infty) =\infty,\\\displaystyle{\frac{q + \Pi(0, \infty)} {c^2}} & \textrm{if }\sigma = 0 \;\textrm{and} \; \Pi(0, \infty) \lt \infty,\end{cases}\\\mathbb{W}^{(q) \prime }(0+)\ &:\!= \lim_{x \downarrow0}\mathbb{W}^{(q)\prime} (x) =\begin{cases}\displaystyle{\frac {2}{\sigma^2}} & \textrm{if }\sigma \gt 0,\\\infty & \textrm{if }\sigma = 0 \; \textrm{and} \; \Pi(0,\infty) =\infty,\\\displaystyle{\frac {q + \Pi(0, \infty)} {(c-\delta)^2}} & \textrm{if }\sigma = 0\; \textrm{and} \; \Pi(0,\infty) \lt \infty.\end{cases}\end{split}\end{align}
On the other hand, as in Lemma 3.3 of [Reference Kyprianou, Rivero and Song13], as  $x\rightarrow \infty$,
 \begin{align}{\rm{e}}^{-\Phi(q) x}W^{(q)} (x) \nearrow \psi'(\Phi(q))^{-1}\quad\textrm{and}\quad {\rm{e}}^{-\varphi(q) x}\mathbb{W}^{(q)} (x) \nearrow\psi_Y'(\varphi(q))^{-1}.\end{align}
4. Optimal dividend problem with a terminal value
In this section, we solve problem (2.7). The obtained results will be applied to the constrained case in the next section. In this and next sections where we deal with the spectrally negative case, we assume the following.
Assumption 4.1. The Lévy measure  $\Pi$ of the process X has a completely monotone density. That is,
 $\Pi$ admits a density
 $\pi$ whose nth derivative
 $\smash{\pi^{(n)}}$ exists for all
 $n \geq 1$ and satisfies
 \begin{align}(-1)^n \pi^{(n)} (x) \geq 0, \qquad x \gt 0.\end{align}
Remark 4.1. Under Assumption 4.1, the scale functions  $\smash{W^{(q)}}$ and
 $\smash{\mathbb{W}^{(q)}}$ defined in Section 3 are infinitely continuously differentiable on
 $ (0, \infty)$. For more details, see Lemma A.1.
This assumption is known to be a sufficient optimality condition for threshold strategies in the classical spectrally negative case by Loeffen [Reference Loeffen15], for the absolutely continuous case (with  $\Lambda=0$) by Kyprianou et al. [Reference Kyprianou, Loeffen and Pérez12], and for the periodic case by Noba et al. [Reference Noba, Pérez, Yamazaki and Yano16] (with
 $\Lambda=0$).
In this section, we allow  $\Lambda$ to be negative (in which case a positive payoff is collected at ruin time), but need to assume the following in order to avoid the trivial case (see Remark 4.2).
Assumption 4.2. We assume that  $q \Lambda + \delta \gt 0$.
Remark 4.2. Suppose that Assumption 4.2 does not hold (i.e.  $q\Lambda + \delta \leq 0$). Because the dividend rate is bounded by
 $\delta$, for any dividend policy
 $D\in\Theta$ and
 $x\geq 0$,
 \begin{align}v^D_{\Lambda}(x) &\leq \delta \mathbb{E}x_x \bigg[\int_0^{\tau^D} {\rm{e}}^{-qt }{\rm d} t\bigg] - \Lambda \mathbb{E}x_x [{\rm{e}}^{-q \tau^D}]\\& \leq \frac{\delta}{q}-\frac{q\Lambda+\delta}{q}\mathbb{E}_x[{\rm{e}}^{-q\tau^D}]\\&\leq \frac{\delta}{q}-\frac{q\Lambda+\delta}{q} \sup_{D' \in\Theta}\mathbb{E}_x[{\rm{e}}^{-q\tau^{D'}}].\end{align}
This implies that  $\smash{v^D_{\Lambda}}$ is maximized by taking the strategy that pays dividends at the ceiling rate
 $\delta$ for all
 $t\geq0$ because it maximizes
 $\smash{\mathbb{E}_x[{\rm{e}}^{-q\tau^{D'}}]}$ over
 $\Theta$.
Finally, we make the following assumption.
Assumption 4.3. If X has paths of bounded variation then  $\delta \lt c$.
This assumption is commonly used in the literature (see, for instance, [Reference Kyprianou, Loeffen and Pérez12] and [Reference Pérez, Yamazaki and Yu18])—without this assumption, the techniques used in this paper are not capable of giving a complete solution.
For the case when Assumption 4.3 is not satisfied, as long as the starting value is below the barrier, a reflection strategy—which is optimal when the absolutely continuous condition is relaxed—is feasible in the considered problem and is therefore optimal as well. On the other hand, when the starting value is above the barrier, the optimal (reflection) strategy in the classical case pushes the process instantaneously to the barrier, whereas this is not feasible in our problem setting. The optimal strategy in this case cannot be directly obtained by the methods used in this paper, and it is out of scope of this paper. The reader is referred to Azcue and Muler [Reference Azcue and Muler3] for complete results for the Cramér–Lundberg case when Assumption 4.3 is violated in a related problem.
4.1. Threshold strategies
The objective of this section is to show that the optimal strategies for (2.7) are of the threshold type. Under the threshold strategy  $D^b$ for
 $b \geq 0$, the resulting controlled process
 $U^b$ is known as a refracted Lévy process of [Reference Kyprianou and Loeffen11], which is the unique strong solution to
 $$U_t^b = {X_t} - D_t^b,\quad {\rm{where}}\quad D_t^b\;: = \delta \int_0^t {{{\mathbf{1}}_{\{ U_s^b > b\} }}} {\rm{d}}s,\quad t \ge 0.$$
Let its ruin time be
 \begin{align}\tau_{b}\ :\!=\inf\{t \gt 0 \colon U^{b}_t \lt 0 \}.\end{align}
The next identities are lifted from Theorems 5(ii) and 6(ii) of [Reference Kyprianou and Loeffen11]. For  $x \in \mathbb{R}$ and
 $b \geq 0$, we have
 \begin{align}\mathbb{E}_x\bigg[\int_0^{\tau_{b}} {\rm{e}}^{-qt} {\rm d} D^b_t\bigg]=-\delta\overline{\mathbb{W}}^{(q)}(x-b)+\frac{1}{h(b)}\biggl(W^{(q)}(x)+\delta\int_b^x {\mathbb{W}}^{(q)}(x-y)W^{(q)\prime}(y){\rm{d}}y\biggr)\end{align}
and
 \begin{align}\Psi_{x}(b)\ &:\!= \mathbb{E}_{x}[{\rm{e}}^{-q\tau_{b}}]\notag\\&=Z^{(q)}(x)+\delta q\int_b^x\mathbb{W}^{(q)}(x-y)W^{(q)}(y){\rm{d}}y\notag\\&-\frac{q\varphi(q){\rm{e}}^{\varphi(q)b}\int_b^{\infty}{\rm{e}}^{-\varphi(q)y}W^{(q)}(y) {\rm{d}}y}{h(b)} \bigg(\!W^{(q)}(x)+\delta\int_b^x\!\!\!\mathbb{W}^{(q)}(x-y)W^{(q)\prime}(y){\rm{d}}y\!\bigg),\end{align}
where
 \begin{equation}h(b)\ :\!=\varphi(q){\rm{e}}^{\varphi(q)b}\int_{b}^{\infty}{\rm{e}}^{-\varphi(q)y}W^{(q)\prime}(y){\rm{d}}y.\end{equation}
Under the threshold strategy  $D^b$, the expected net present value is denoted by
 \begin{equation}v_{\Lambda}^{b}(x)\ :\!=\mathbb{E}_x\bigg[\int_0^{\tau_{b}} {\rm{e}}^{-qt} {\rm d}D^b_t\bigg]-\Lambda\Psi_{x}(b) \quad\text{for } x\geq0.\end{equation}
Using (4.1) and (4.2), we have the following result.
Proposition 4.1. The function  $\smash{v_{\Lambda}^{b}}$, with
 $b\geq 0$, is given by
 \begin{align}v_{\Lambda}^{b}(x)&=\xi_{\Lambda}(b)\bigg(W^{(q)}(x)+\delta\int_b^x\mathbb{W}^{(q)}(x-y)W^{(q)\prime}(y){\rm{d}}y\bigg)\notag\\&-\Lambda\bigg(Z^{(q)}(x)+\delta q\int_b^x\mathbb{W}^{(q)}(x-y)W^{(q)}(y){\rm{d}}y\bigg)-\delta\overline{\mathbb W}^{(q)}(x-b) \quad\text{for $x\geq 0$,}\end{align}
where
 \begin{align}\xi_{\Lambda}(b)\ :\!=\frac{1}{h(b)}\biggl(1+ \varphi(q) q\Lambda {\rm{e}}^{\varphi(q)b}\displaystyle\int_{b}^{\infty}{\rm{e}}^{-\varphi(q)y}W^{(q)}(y) {\rm{d}}y\biggr).\end{align}
In particular, for  $x \leq b$, we have
 \begin{align}v_{\Lambda}^{b}(x)=\xi_{\Lambda}(b) W^{(q)}(x) -\Lambda Z^{(q)}(x).\end{align}
Remark 4.3. From (4.3) and integration by parts,
 \begin{align}\varphi(q){\rm{e}}^{\varphi(q)b}\int_b^\infty {\rm{e}}^{-\varphi(q) y} W^{(q)} (y){\rm{d}}y = W^{(q)} (b) + \frac{h(b)}{\varphi(q)}, \qquad b \geq 0.\end{align}
Hence, the function  $\xi_{\Lambda}$, given in (4.6), can be rewritten as
 \begin{equation}\xi_{\Lambda}(b)=\frac{1}{h(b)}\biggr(1+q\Lambda\bigg(W^{(q)}(b)+\frac{h(b)}{\varphi(q)}\bigg)\biggl), \qquad b \geq 0.\end{equation}
In particular, for the case  $b = 0$, these expressions can be simplified as follows; the proof is deferred to Appendix A.1.
Lemma 4.1. We have
 \begin{equation}\begin{gathered}h(0)=\varphi(q) \int_{0}^{\infty}{\rm{e}}^{-\varphi(q)y}W^{(q)\prime}(y){\rm{d}}y= \varphi(q) ( - W^{(q)}(0) + \delta^{-1} ),\\\xi_{\Lambda}(0)=\frac{1}{h(0)}\biggl(1+ \frac {q \Lambda} \delta\biggr)= \dfrac{\delta+q\Lambda}{\varphi(q)(1-\delta W^{(q)}(0))},\end{gathered}\end{equation}
and, for  $x\geq0$,
 \begin{align}v_{\Lambda}^{0}(x)&=\xi_{\Lambda}(0) \mathbb{W}^{(q)}(x) (1 - \delta W^{(q)}(0)) -\Lambda \mathbb{Z}^{(q)}(x) -\delta \overline{\mathbb{W}}^{(q)}(x).\end{align}
4.2. Selection of the optimal threshold  $b_\Lambda$

Focusing on the set of threshold strategies, we now select our candidate optimal threshold, which we call  $b_\Lambda$. In view of (4.7), such
 $b_\Lambda$ must maximize
 $\xi_\Lambda$. Motivated by this fact, we pursue
 $b_\Lambda$ such that
 $\smash{\xi'_\Lambda(b_{\Lambda})}$ vanishes if such a value exists.
First, we rewrite the form of  $\smash{\xi_{\Lambda}'(b)}$ as follows. Fix
 $b \gt 0$. Taking a derivative in (4.9) and using the fact that
 $h'(b)=\varphi(q) (h(b) - \smash{W^{(q)\prime}(b)})$ (by (4.3)),
 \begin{align}\xi_{\Lambda}'(b) & = q\Lambda-\dfrac{h'(b)}{h(b)}\xi_{\Lambda}(b)\notag\\& =q\Lambda-\frac{\varphi(q)} {h(b)}\biggr(1+q\Lambda\bigg(W^{(q)}(b)+\dfrac{h(b)}{\varphi(q)}\bigg)\biggl)+\dfrac{\varphi(q)W^{(q)\prime}(b)}{h(b)}\xi_{\Lambda}(b) \notag\\& =\dfrac{\varphi(q)W^{(q)\prime}(b)}{h(b)}(\xi_{\Lambda}(b)-g_{\Lambda}(b)),\end{align}
where
 \begin{equation}g_{\Lambda}(b):\,=\dfrac{1+q\Lambda W^{(q)}(b)}{W^{(q)\prime}(b)}.\end{equation}
In view of (4.12), we now define the (candidate) optimal threshold level for (2.7) by
 \begin{equation}b_\Lambda\ :\!= \inf \{ b \gt 0\colon \xi_\Lambda'(b) \leq 0 \} = \inf \{ b \gt 0\colon \xi_\Lambda(b) - g(b) \le 0 \}.\end{equation}
Here, we set  $\inf \emptyset = \infty$ for convenience, but we will see in Proposition 4.2 that
 $b_\Lambda$ is necessarily finite.
Remark 4.4. Following the proof of Lemma 3 of [Reference Kyprianou, Loeffen and Pérez12], the function h as in (4.3) has the following properties.
(i) As a special case with
$\Lambda = 0$, $b_{0}$ is the point where $b\mapsto h(b)$ attains its global minimum. Hence, $h'(b)<0$ for $b<b_0$ and $h'(b)>0$ for $b>b_0$.(ii) We have
$\lim_{b\to\infty}h(b)=\infty$.


Remark 4.5. Note that the function  $g_\Lambda$ plays a key role in [Reference Loeffen14] and satisfies the following assertions.
(i)
$g_{\Lambda}(0+)=\smash{{(1+q\Lambda W^{(q)}(0))}/{W^{(q)\prime}(0 +)}}$ and $g_{\Lambda}(b)\rightarrow{q \Lambda}/{\Phi(q)}$ as $b\rightarrow\infty$ by (3.7).(ii) If we define
we know that\begin{align}a_{\Lambda}\ :\!= \sup\{b\geq0\colon g_{\Lambda}(b)\geq g_{\Lambda}(x)\text{ for all } x\geq0\},\end{align}$a_{\Lambda}$ is finite (see [14, Proposition 3]) and is the unique point where $g_{\Lambda}$ has a global maximum; see [14, proof of Theorem 1]. Moreover if $a_{\Lambda}=0$ then $\smash{g'_{\Lambda} (b)}<0$ for $b \in (0,\infty)$, and if $a_{\Lambda}>0$ then $\smash{g'_{\Lambda}(a_{\Lambda})}=0$, $\smash{g'_{\Lambda}(b)}>0$ for $b<a_{\Lambda}$ and $\smash{g'_{\Lambda}(b)}<0$ for $b>a_{\Lambda}$.


We will now prove an auxiliary result which describes the asymptotic behavior of the function  $\xi_{\Lambda}$.
Lemma 4.2. We have
 \begin{equation}\lim_{b\to\infty}\xi_{\Lambda}(b)=\lim_{b\to\infty}g_{\Lambda}(b)=\dfrac{q\Lambda}{\Phi(q)}.\end{equation}
Proof. Recall from Remark 4.5 the convergence of  $g_\Lambda$. Now, letting
 $b\rightarrow\infty$ in (4.9), we observe that
 \begin{equation}\lim_{b\rightarrow\infty}\xi_{\Lambda}(b)=q\Lambda\biggl(\frac{1}{\varphi(q)}+\lim_{b\rightarrow\infty}\frac{ W^{(q)}(b)}{h(b)}\biggr),\end{equation}
since  $h(b)\rightarrow\infty$ as
 $b\rightarrow\infty$. On the other hand, by the dominated convergence theorem and using (3.7), it follows that
 \begin{align}\dfrac{W^{(q)}(b)}{h(b)} &= \biggr(\varphi(q)\int_{0}^{\infty}{\rm{e}}^{-(\varphi(q)-\Phi(q)) y} \frac {W^{(q)\prime}(y+b)} {W^{(q)}(y+b)}\dfrac{{\rm{e}}^{-\Phi(q)[y+b]}W^{(q)}(y+b)}{{\rm{e}}^{-\Phi(q)b}W^{(q)}(b)} {\rm{d}}y \biggl)^{-1}\notag\\&\xrightarrow{b \uparrow \infty} \biggl( \varphi(q)\Phi(q) \int_0^\infty {\rm{e}}^{-(\varphi(q)-\Phi(q)) y} {\rm d} y \biggr)^{-1} \nonumber\\&= \dfrac{\varphi(q)-\Phi(q)}{\varphi(q)\Phi(q)},\end{align}
where we recall that  $\varphi(q)>\Phi(q)$. Now, applying (4.17) in (4.16), we get (4.15).☐
(i) Under Assumption 4.1, we have
$b_{\Lambda}\in[0,a_\Lambda]$.(ii) Moreover,
$b_{\Lambda}=0$ if and only if one of the following two cases holds:
(1)
$\sigma=0$, $\Pi(0,\infty) \lt \infty$, and $\varphi(q)\geq{(\delta+q\Lambda)(q+\Pi(0,\infty))}/{(c+q\Lambda)(c-\delta)} =:\phi_1(\Lambda)$, or(2)
$\sigma>0$ and $\varphi(q)\geq{2(\delta+q\Lambda)}/{\sigma^{2}} =:\phi_2(\Lambda)$.


Proof. (i) By the definition of  $b_\Lambda$ as in (4.14) and the continuity of
 $\xi_\Lambda$ and
 $g_\Lambda$, in order to show that
 $b_\Lambda \le a_\Lambda,$ it is sufficient to show that
 $\xi_{\Lambda}'(b) \le 0$ (or, equivalently,
 $\xi_\Lambda(b) - g_\Lambda(b) \le 0$) on
 $[a_\Lambda,\infty)$. To show this, suppose that there exists
 $\bar{b} \gt a_\Lambda$ such that
 $\xi_\Lambda(\bar{b}) - g_\Lambda (\bar{b})> 0$. Then, since
 $g_{\Lambda}$ is decreasing on
 $ (a_\Lambda, \infty)$ as in Remark 4.5(ii), it follows by (4.12) that
 $\xi_\Lambda(b) - g_\Lambda(b)$ is increasing on
 $ (\bar{b}, \infty)$. However, this contradicts (4.15). Hence,
 $\xi_{\Lambda}'(b) \le 0$ on
 $[a_\Lambda, \infty)$.
(ii) Using (4.12) and the definition of  $b_{\Lambda}$ given in (4.14), we obtain
 $b_{\Lambda}=0$ if and only if
 $g_{\Lambda}(0+)\geq \xi_{\Lambda}(0+)$. This is equivalent, by Lemma 4.1 and Remark 4.5(i), to
 $$\varphi \left( q \right) \ge {{\left( {\delta + q\Lambda } \right){W^{\left( q \right)'}}\left( {0 + } \right)} \over {\left( {1 + q\Lambda {W^{\left( q \right)}}\left( 0 \right)} \right)\left( {1 - \delta {W^{\left( q \right)}}\left( 0 \right)} \right)}}.$$
From here, using (3.5) and (3.6), we obtain the two cases announced in the proposition.
Remark 4.6. For the case  $\sigma=0$ and
 $\Pi(0,\infty) \lt \infty$ and the case
 $\sigma >0$, the functions
 $\phi_1$ and
 $\phi_2$, respectively, are both strictly increasing (since
 $c>\delta$ in the bounded variation case by Assumption 4.3), with
 $\phi_1(-\delta/q) =\phi_2(-\delta/q) = 0$. Hence, there exists
 $\bar{\Lambda} \in(-\delta/q, \infty]$ such that
 $b_{\Lambda}=0$ for all
 $- \delta/q \lt \Lambda \le \bar{\Lambda}$ and
 $b_{\Lambda}>0$ for all
 $\Lambda>\bar{\Lambda}$.
(i) Suppose that
$\sigma=0$ and $\Pi(0,\infty) \lt \infty$. Define
\begin{align}\phi_{1}(\infty)\ :\!= \lim_{\Lambda\to\infty}\phi_{1}(\Lambda)=\frac{q+\Pi(0,\infty)}{c-\delta}.\end{align}If
$\varphi(q)\geq \phi_1(\infty)$ then, by Proposition 4.2(ii), $\bar{\Lambda} = \infty$. Otherwise, we must have $\bar{\Lambda} \lt \infty$ and $\phi_1(\bar{\Lambda}) = \varphi(q)$.(ii) Suppose that
$\sigma \gt 0$. Because $\lim_{\Lambda\to\infty}\phi_{2}(\Lambda)= \infty$, we must have $\bar{\Lambda} \lt \infty$. This also implies that $\phi_2(\bar{\Lambda}) =\varphi(q)$.(iii) Suppose that
$\sigma = 0$ and $\Pi(0,\infty)=\infty$. Then, we can set $\bar{\Lambda} = - \delta /q$.


4.3. Verification
For the case  $b_\Lambda \gt 0$, by how
 $b_\Lambda$ is selected as in (4.14), together with (4.5) and (4.12), we can write
 \begin{align}\begin{split}v_{\Lambda}^{b_\Lambda}(x) &= g_{\Lambda}(b_\Lambda)\bigg(W^{(q)}(x)+\delta\int_{b_\Lambda}^x\mathbb{W}^{(q)}(x-y)W^{(q)\prime}(y){\rm{d}}y\bigg)\\& -\Lambda\bigg(Z^{(q)}(x)+\delta q\int_{b_\Lambda}^x\mathbb{W}^{(q)}(x-y)W^{(q)}(y){\rm{d}}y\bigg)-\delta\overline{\mathbb W}^{(q)}(x-b_\Lambda) \quad\text{for$x\geq 0$.}\end{split}\end{align}
For the case  $b_\Lambda = 0$, the function
 $\smash{v_{\Lambda}^{b_\Lambda} \equiv v_{\Lambda}^{0}}$ is given in (4.11).
Given the spectrally negative Lévy process X, we call a function  $F\colon \mathbb{R} \to \mathbb{R}$ sufficiently smooth if F is continuously differentiable on
 $ (0,\infty)$ when X has paths of bounded variation and is twice continuously differentiable on
 $ (0,\infty)$ when X has paths of unbounded variation. We let
 $\Gamma$ be the operator acting on a sufficiently smooth function F, defined by
 \begin{equation}\Gamma F(x)\ :\!= \gamma F'(x)+\frac{\sigma^2}{2}F''(x)+\int_{(0,\infty)}(F(x-z)-F(x)+F'(x)z\mathbf{1}_{\{0 \lt z\le 1\}})\Pi(\mathrm{d}z), \qquad x \gt 0.\end{equation}
The following lemma constitutes standard technology as far as optimal control is concerned. For its proof we refer the reader to that of Lemma 1 in [Reference Loeffen14].
Lemma 4.3. Suppose that  $\smash{\hat{D}\in\Theta}$ is an admissible dividend strategy such that
 $\smash{v^{\hat{D}}_{\Lambda}}$ is sufficiently smooth on (
 $0,\infty$),
 $\smash{v_\Lambda^{\hat{D}}(0)}\geq -\Lambda$, and, for all
 $x \gt 0$,
 \begin{equation}(\Gamma -q) v^{\hat{D}}_{\Lambda}(x)+\sup_{0\le r\le \delta}(r-rv^{\hat{D}\prime}_{\Lambda}(x))\le 0.\end{equation}
Then  $\smash{v^{\hat{D}}_{\Lambda}(x)}=V_{\Lambda}(x)$ for all
 $x\geq0$ and hence,
 $\smash{\hat{D}}$ is an optimal strategy.
We first show that our candidate value function  $\smash{v^{b_{\Lambda}}_{\Lambda}}$ is indeed sufficiently smooth on
 $ (0,\infty)$. The proof is given in Appendix A.2.
Lemma 4.4. Consider  $b_{\Lambda}\geq0$ given by (4.14). Then
 $\smash{v^{b_{\Lambda}}_{\Lambda}}$ is sufficiently smooth on
 $ (0,\infty)$.
In order to prove the HJB inequality (4.19), we use a more friendly sufficient condition. For the proof of the following result, we refer the reader to the proof of Lemma 7 in [Reference Kyprianou, Loeffen and Pérez12].
Lemma 4.5. The value function  $\smash{v^{b_{\Lambda}}_{\Lambda}}$ satisfies (4.19) if and only if
 \begin{equation}v^{b_{\Lambda}\prime}_{\Lambda}(x)\geq1 \quad\text{if $0<x\le b_{\Lambda}$}, \qquad v^{b_{\Lambda}\prime}_{\Lambda}(x)\le 1 \quad\text{if$x>b_{\Lambda}$}.\end{equation}
We now state the main theorem of this section. Its proof is provided in Appendix A.3.1.

5. Solution of the constrained de Finetti problem
In this section, we study the constrained de Finetti problem given in (2.2) under Assumptions 4.1 and 4.3. In order to solve this problem, we use the results in Section 4, noting that the optimal strategy for (2.5) for any  $K\in[0,1]$ is the same as the case
 $K=0$, i.e.
 $\smash{D^{b_{\Lambda}}}$, with
 $b_{\Lambda}$ as in (4.14), is the optimal strategy for (2.5). See the discussion at the end of Section 2.3.
Throughout this section, we assume the following (see Remark 5.2 for the case it does not hold).
Assumption 5.1. We assume that  $\bar{\Lambda} \lt \infty$, which, by Remark 4.6, is equivalent to
 \begin{equation}\varphi(q)< \phi_1(\infty) = \dfrac{q+\Pi(0,\infty)}{c-\delta}\quad\text{if } \sigma=0 \text{ and } \Pi(0,\infty) \lt \infty.\end{equation}
First we need to study the relationship between  $\Lambda$ and its corresponding optimal threshold level
 $b_{\Lambda}$, which will give us enough tools to see if problem (2.2) is feasible or not.
Recall Remark 4.6 and fix  $\Lambda \gt \bar{\Lambda}$ (then necessarily
 $b_\Lambda \gt 0$). Since
 $\xi'_{\Lambda}(b_{\Lambda})=0$ and by the first equality of (4.12), we observe that
 $\Lambda$ and
 $b_\Lambda$ satisfy the relation
 $\Lambda = \lambda(b_\Lambda),$ where
 \begin{align}\lambda(b)\ :\!= ( q H(b) )^{-1}\end{align}
with
 \begin{align}H(b)\ :\!= \frac {[h(b)]^{2}} {h'(b)}- \bigg( W^{(q)}(b)+ \frac {h(b)}{\varphi(q)} \bigg).\end{align}
The following results proved in Appendices A.4 and A.5 give properties of the functions defined above.
Lemma 5.1. The function H(b) given in (5.3) is positive and strictly decreasing for  $b\in(b_0,\infty)$, where we recall that
 $b_{0}$ is as in (4.14) when
 $\Lambda=0$.
Note that Lemma 5.1 implies that  $\lambda(b)$ is finite, positive, and strictly increasing for
 $b\in(b_0,\infty)$.
Proposition 5.1. Assume that (5.1) holds. Then, the function  $\lambda(b)$, given in (5.2), satisfies
(i)
$\lim_{b\downarrow b_{0}}\lambda(b)=\bar{\Lambda} \vee 0$,(ii)
$\lim_{b\rightarrow \infty}\lambda(b)=\infty,$ and(iii)
$b_{\lambda(b)}=b$ for all $b>b_{0}$.


Now, by (4.2) and (4.8), we see that
 \begin{align}\Psi_{x}(b)&=Z^{(q)}(x)+\delta q\int_b^x\mathbb{W}^{(q)}(x-y)W^{(q)}(y){\rm{d}}y \nonumber\\&-\frac{q(W^{(q)}(b)+h(b)/\varphi(q))}{h(b)}\bigg(W^{(q)}(x)+\delta\int_b^x\mathbb{W}^{(q)}(x-y)W^{(q)\prime}(y){\rm{d}}y\bigg),\end{align}
for all  $b\in[0,\infty)$.
Remark 5.1. Note that if  $x=0$ and X is of unbounded variation, we immediately obtain
 $\Psi_{0}(b)=1$ for all
 $b\geq0$. Hence, we obtain
 $V(0;\ K)=0$ if
 $K=1$, and the problem is infeasible otherwise.
The proof of the following result is deferred to Appendix A.6.
Lemma 5.2. Assume that  $x\geq0$ and in the case X is of unbounded variation that
 $x \gt 0$. Then the function
 $b \mapsto \Psi_{x}(b)$ defined in (5.4) is strictly decreasing on
 $[0,\infty)$ and
 \begin{equation}K_{x}\ :\!=\lim_{b\rightarrow\infty}\Psi_{x}(b)=Z^{(q)}(x)-\dfrac{q}{\Phi(q)}W^{(q)}(x).\end{equation}
By Remark 4.4(ii), the limit of (4.1) becomes
 \begin{align}\lim_{b\to\infty}\mathbb{E}_x\bigg[\int_0^{\tau_{b}} {\rm{e}}^{-qt}{\rm d}D^b_t\bigg]=0, \qquad x \geq 0.\end{align}
We will define, for  $K \geq 0$,
 \begin{equation}v_{\Lambda}^b(x;\ K)\ :\!=v^b_{\Lambda}(x)+\Lambda K.\end{equation}
Using (5.6) and Lemma 5.2 in (4.4), we obtain
 \begin{align}\lim_{b\to\infty}v_{\Lambda}^b(x;\ K)=\Lambda(K- K_x) \quad\text{for all$x>0$.}\end{align}
We are now ready to characterize the solution of (2.2). We define the do-nothing strategy as  $D^{\infty}=0$ uniformly in time and hence,
 $\smash{U_t^{D^\infty} }= X$. By Equation (8.9) of [Reference Kyprianou10], (5.7), and Lemma 5.2, we confirm the convergence results
 \begin{equation}\mathbb{E}x_{x}[{\rm{e}}^{-q\tau^{D^{\infty}}}]=K_{x}=\lim_{b\to\infty}\Psi_x(b)\quad\text{and}\quad v_{\Lambda}^{D^{\infty}}(x;\ K)=\Lambda(K-K_{x})=\lim_{b\to\infty}v_{\Lambda}^{D^{b}}(x;\ K),\end{equation}
where  $\tau^{D^{\infty}}\ :\!= \inf \{t \gt 0\colon X_{t} \lt 0\}$. From (2.4) and (5.8), we observe that if
 $K \geq K_x$ then
 $D^\infty$ is feasible for problem (2.2) and hence,
 \begin{equation}V(x;\ K) =\sup_{D\in\Theta}\inf_{\Lambda\geq0}v_{\Lambda}^{D}(x;\ K)\geq\inf_{\Lambda\geq0}v_{\Lambda}^{D^{\infty}}(x;\ K)=0 \quad\text{if }K\in[K_{x},1],\end{equation}
with  $\smash{v_{\Lambda}^{D}}$ as in (2.3).
Theorem 5.1. Let  $x\geq0$ be fixed. Assume that (5.1) and one of the following cases hold:
(i)
$x>0$ and X is of unbounded variation;(ii)
$x\geq0$ and X is of bounded variation.


Then
 \begin{equation}V(x;\ K)=\begin{cases}v^{{b_{0}}}_{0}(x;\ K) &\text{if}\ K\in\left[\Psi_{x}(b_{0 }),1\right],\\\inf_{\Lambda\geq0}V_{\Lambda}(x;\ K) &\text{if} \ K\in(K_{x},\Psi_{x}(b_{0})),\\0 &\text{if}\ K=K_{x},\\-\infty &\text{if}\ K\in[0,K_{x}).\end{cases}\end{equation}
Proof. We will only prove (i) since the other case is similar. Recall inequality (2.4) and that  $V_{\Lambda}(x;\ K)$ is defined as in (2.5).
(a) If  $K\in[\Psi_{x}(b_{0}),1]$ then the threshold strategy at level
 $b_0$ is feasible for problem (2.2) (see Section 2), and therefore,
 \begin{equation}v^{{b_{0}}}_{0}(x;\ K)\le V(x;\ K)\le\inf_{\Lambda\geq0}V_{\Lambda}(x;\ K)\le V_0(x;\ K)=v^{{b_{0}}}_{0}(x;\ K).\end{equation}
Here the second inequality holds by (2.4) and the last equality holds because the case  $\Lambda = 0$ is solved by the threshold strategy with
 $b_0$ in problem (2.5) (which is equivalent to (2.7)).
(b) If  $K\in(K_{x},\Psi_{x}(b_{0}))$, since
 $b \mapsto\Psi_{x}(b)$ is continuous and strictly decreasing, by Lemma 5.2, there exists a unique
 $b^{*}>b_{0}$ such that
 $K-\Psi_{x}(b^{*})=0$. Therefore,
 \begin{equation}V(x;\ K)\le\inf_{\Lambda\geq0}V_{\Lambda}(x;\ K)\le V_{\lambda(b^*)}(x;\ K)=\mathbb{E}_x\bigg[\int_0^{\tau_{b^*}} {\rm{e}}^{-qt}{\rm d}D^{b^{*}}_t\bigg] \le V(x;\ K).\end{equation}
Here the first inequality holds by (2.4). The equality follows from Proposition 5.1(iii) since  $D^{b^{*}}$ is the optimal strategy for (2.5) when
 $\Lambda=\lambda(b^{*})$. The last inequality follows since the threshold strategy at level
 $b^*$ is feasible for problem (2.2).
(c) If  $K=K_{x}$, by Lemma 5.2, we have
 $\lambda(b)(K-\Psi_{x}(b))\le0$ for all
 $b> b_{0}$. Hence,
 \begin{equation}0\le V(x;\ K)\le\inf_{\Lambda\geq0}V_{\Lambda}(x;\ K)\le \inf_{b>b_0}\bigg(\mathbb{E}_x\bigg[\int_0^{\tau_{b}} {\rm{e}}^{-qt}{\rm d}D^b_t\bigg]+\lambda(b)(K-\Psi_{x}(b))\bigg)\le 0.\end{equation}
Here the first inequality follows from (5.9), the second by (2.4), and the last by (5.6).
(d) Finally, if  $K\in[0,K_{x})$ then Lemma 5.2 gives
 $\lim_{b\rightarrow\infty}[K-\Psi_{x}(b)]=K-K_{x}<0$. Hence, we obtain
 \begin{equation}V(x;\ K)\le\inf_{\Lambda\geq0}V_{\Lambda}(x;\ K)\le \inf_{b>b_0}\bigg(\mathbb{E}_x\bigg[\int_0^{\tau_{b}} {\rm{e}}^{-qt}{\rm d}D^b_t\bigg]+\lambda(b)(K-\Psi_{x}(b))\bigg)=-\infty,\end{equation}
where the second inequality holds by equation (2.4) and the last equality follows from Proposition 5.1.☐
Remark 5.2. Consider the case when Assumption 5.1 is violated. By Remark 4.6, for all  $\Lambda \geq 0$, we must have
 $b_\Lambda = 0$ and hence,
 $V_{\Lambda}(x;\ K)=\smash{\mathbb{E}_x[\int_0^{\tau_{0}} {\rm{e}}^{-qt} {\rm d}D^{0}_{t}}]+\Lambda(K-\Psi_{x}(0))$. If
 $K\in[\Psi_{x}(b_{0}),1]$ then the threshold strategy at level 0 is feasible for problem (2.2) (see Section 2), and therefore,
 \begin{equation}v^{0}_{0}(x;\ K)\le V(x;\ K)\le\inf_{\Lambda\geq0}V_{\Lambda}(x;\ K)\le V_0(x;\ K)=v^{0}_{0}(x;\ K).\end{equation}
On the other hand, if  $K\in[0,\Psi_{x}(0))$, we obtain
 \begin{equation}V(x;\ K)\le \inf_{\Lambda\geq0}V_{\Lambda}(x;\ K)=\inf_{\Lambda\geq0}\bigg(\mathbb{E}_x\bigg[\displaystyle\int_0^{\tau_{0}} {\rm{e}}^{-qt} {\rm d}D^{0}_{t}\bigg]+\Lambda(K-\Psi_{x}(0))\bigg)=-\infty.\end{equation}
In sum, we have
 \begin{equation}V(x;\ K)=\begin{cases}v^{0}_{0}(x,K) &\text{if}\ K\in[\Psi_{x}(0),1],\\-\infty &\text{if}\ K\in[0,\Psi_{x}(0)).\end{cases}\end{equation}
6. Spectrally positive case
In this section, we solve analogous problems driven by a spectrally positive Lévy process  $\overline{Y}$. We assume that its dual process
 $Y= -\overline{Y}$ has its Laplace exponent
 $\psi_Y$ as in (3.1) so that its right inverse and scale function are given by
 $\varphi(q)$ and
 $\smash{\mathbb{W}^{(q)}}$, respectively. We also define the drift-changed process
 $\smash{\overline{X} =\{\overline{X}_t =\overline{Y}_t - \delta t;\ t \geq 0 \}}$ whose dual
 $X = - \overline{X}$ has its Laplace exponent
 $\psi$ as in (2.1), right inverse
 $\Phi(q),$ and scale function
 $\smash{W^{(q)}}$ described in Section 3. We denote by
 $\smash{\overline{\mathbb{E}}_x}$ the expectation with respect to the law of the process
 $\smash{\overline{Y}}$ when it starts at x.
In addition, for  $x\geq0$ and
 $0< K\le 1$, we define
 $\bar{v}(x;\ K)$,
 $\smash{\bar{v}_{\Lambda}^D(x;\ K)}$,
 $\bar{v}_\Lambda(x;\ K)$ and
 $\bar{v}_\Lambda(x)$ analogously to (2.2), (2.3), (2.5), and (2.6), respectively.
We first solve the optimal dividend problem with terminal payoff/penalty (2.7) with X replaced with  $\overline{Y}$. Similarly to the spectrally negative Lévy case, we define for
 $b \geq 0$ the threshold strategy
 $\smash{\overline{D}^b}$ and the resulting controlled surplus process, which is a refracted spectrally positive Lévy process defined as the unique strong solution to the stochastic differential equation
 $$\bar U_t^b\;: = {\bar Y_t} - \bar D_t^b\;: = {\bar Y_t} - \delta \int_0^t {{{\mathbf{1}}_{\{ \bar U_s^b > b\} }}} {\rm{d}}s,\qquad t \ge 0.$$
Let its ruin time be denoted by
 \begin{align}\bar{\tau}_{b}\ :\!=\inf\{t>0\colon \overline{U}^{b}_t \lt 0 \}.\end{align}
6.1. Scale functions under a change of measure
For each  $ \beta \ge 0$, we define the change of measure
 \begin{equation}\dfrac{{\rm d}\tilde{\mathbb{P}}^{\beta}_{x}}{{\rm d}\tilde{\mathbb{P}}_{x}}\biggr|_{\mathcal{F}_{t}}={\rm{e}}^{\beta(Y_{t}-x)-\psi_Y(\beta)t}, \qquad x\in\mathbb{R}, \, t\geq0,\end{equation}
where  $\smash{\tilde{\mathbb{P}}_x}$ is the law of the process Y when it starts at x. It is known that Y is still a spectrally negative Lévy process on
 $ (\Omega, \mathcal{F},\smash{\tilde{\mathbb{P}}^{\beta}})$ and the scale function of Y on this probability space can be written
 \begin{gather}\mathbb{W}_{ \beta }^{(u-\psi_Y( \beta ))}(x)={\rm{e}}^{-\beta x}\mathbb{W}^{(u)}(x),\\\mathbb{Z}_{ \beta}^{(u-\psi_{Y}(\beta))}(x)=1+(u-\psi_Y( \beta))\int_{0}^{x}{\rm{e}}^{- \beta z}\mathbb{W}^{(u)}(z) {\rm{d}}z,\end{gather}
with  $u-\psi_Y( \beta)\geq0$; see [2, Remark 4]. In particular, (3.1) and (3.3) give
 $q-\psi_{Y}(\Phi(q))=\delta\Phi(q)$ and hence,
 \begin{align}\mathbb{W}^{(\delta\Phi(q))}_{\Phi(q)}(x)={\rm{e}}^{-\Phi(q)x}\mathbb{W}^{(q)}(x) \quad\text{and}\quad\mathbb{Z}^{(\delta\Phi(q))}_{\Phi(q)}(x)=1+\delta\Phi(q)\int_{0}^{x}{\rm{e}}^{-\Phi(q)z}\mathbb{W}^{(q)}(z){\rm{d}}z.\end{align}
6.2. Optimal dividend problem with terminal value
As in the case of the spectrally negative Lévy process, we are first interested in solving problem (2.4) for the spectrally positive case. For this purpose, first we need to study the optimal dividend problem with a terminal value for the process  $\overline{Y}$. Using Theorems 5(i) and 6(iii) of [Reference Kyprianou and Loeffen11] we have the following result, whose proof is deferred to Appendix A.7.
Proposition 6.1. For  $x,b,q\geq0$, we have
 \begin{equation}\overline{\Psi}_{x}(b)\ :\!=\overline{\mathbb{E}}_x[{\rm{e}}^{-q\bar{\tau}_{b}};\bar{\tau}_{b} \lt \infty]={\rm{e}}^{-\Phi(q)x}\frac{\mathbb{Z}^{(\delta\Phi(q))}_{\Phi(q)}(b-x)}{\mathbb{Z}^{(\delta\Phi(q))}_{\Phi(q)}(b)},\end{equation}
where  $\mathbb{Z}^{(\delta\Phi(q))}_{\Phi(q)}(x)$ is given in (6.1),
 $\bar{\tau}_{b}\ :\!=\inf\{ t \gt 0\colon \overline{U}^b_t=0\},$ and
 \begin{equation}\overline{\mathbb{E}}_x\biggr[ \int_0^{\bar{\tau}_{b}} {\rm{e}}^{-qt}{\rm d}\overline{D}^{b}_{t}\biggl] =\dfrac{\delta}{q}(\mathbb{Z}^{(q)}(b-x)-\mathbb{Z}^{(q)}(b)\overline{\Psi}_{x}(b)).\end{equation}
Proposition 6.2. For  $b \geq 0$, we have
 \begin{equation}\bar{v}_{\Lambda}^{b}(x)\ :\!=\overline{\mathbb{E}}_x\bigg[\int_0^{\bar{\tau}_{b}}{\rm{e}}^{-qt}{\rm d} \overline{D}^b_t\bigg]- \Lambda \overline{\Psi}_{x}(b) =\begin{cases}\displaystyle{\frac{\delta}{q}\mathbb{Z}^{(q)}(b-x)-\bar{k}_{x}(b,\Lambda)}&\text{if}\ 0 \le x\le b,\\[9pt]\displaystyle{\frac{\delta}{q}-\bar{k}_{b}(b,\Lambda){\rm{e}}^{-\Phi(q)(x-b)}}&\text{if}\ x>b,\end{cases}\end{equation}
where, for  $x\geq0$,
 \begin{align}\bar{k}_{x}(b,\Lambda)\ & :\!=\overline{\Psi}_{x}(b)\biggr(\dfrac{\delta}{q}\mathbb{Z}^{(q)}(b)+\Lambda\biggl).\end{align}
In order to select the optimal threshold, we apply smooth fit. Note that, by (6.4),  $\bar{v}_{\Lambda}^{b}$ is continuous on
 $[0,\infty)$ for any choice of b. Here, we will study the smoothness of
 $\smash{\bar{v}_{\Lambda}^{b}}$ at
 $x=b$ to propose a candidate threshold level
 $\smash{\bar{b}_{\Lambda}}$ such that
 $\smash{\bar{v}_{\Lambda}^{\bar{b}_{\Lambda}}}$ is
 ${\rm{C}}^{1}(0,\infty)$ and
 ${\rm{C}}^{2}(0,\infty)$ when
 $\overline{Y}$ is of bounded and unbounded variation, respectively. By differentiating (6.4), we see that
 \begin{equation}\bar{v}_{\Lambda}^{b\prime}(x)=\begin{cases}-\delta\mathbb{W}^{(q)}(b-x)+\Phi(q) (\bar{k}_{x}( b ,\Lambda)+\delta\bar{k}_{b}(b,\Lambda)\mathbb{W}^{(q)}(b-x)) &\text{if}\ 0 \lt x \lt b,\\\Phi(q)\bar{k}_{b}(b,\Lambda){\rm{e}}^{-\Phi(q)(x-b)} &\text{if}\ x>b,\end{cases}\end{equation}
and, in particular, for the unbounded variation case
 \begin{equation}\bar{v}_{\Lambda}^{b\prime\prime}(x)=\begin{cases}\delta\mathbb{W}^{(q)\prime}(b-x)-[\Phi(q)]^{2} \bar{k}_{x}( b ,\Lambda)&\\\quad-\delta\Phi(q)\bar{k}_{b}(b,\Lambda)[\Phi(q)\mathbb{W}^{(q)}(b-x)+\mathbb{W}^{(q)\prime}(b-x)] &\text{if}\ 0< x<b,\\-[\Phi(q)]^{2}\bar{k}_{b}(b,\Lambda){\rm{e}}^{-\Phi(q)(x-b)} &\text{if}\ x>b,\end{cases}\end{equation}
where we recall that, if Y is of unbounded variation,  $\smash{\mathbb{W}^{(q)}}$ is
 ${C}^{1}$ on
 $ (0,\infty)$. From (6.5) and (6.6), together with (3.5) and (3.6), we have the following result.
Lemma 6.1. Suppose that  $b \gt 0$ is such that
 \begin{equation}\bar{k}_{b}(b,\Lambda)=\dfrac{1}{\Phi(q)}, \quad\text{or,equivalently,}\quad \Lambda {\rm{e}}^{-\Phi(q)b} = s(b),\end{equation}
where
 \begin{equation}s(b)\ :\!=\frac{1}{\Phi(q)}\mathbb{Z}^{(\delta\Phi(q))}_{\Phi(q)}(b)-\dfrac{\delta {\rm{e}}^{-\Phi(q)b}}{q}\mathbb{Z}^{(q)}(b), \qquad b> 0.\end{equation}
Then, the function  $\smash{\bar{v}_{\Lambda}^{b}}$ is
 $C^1(0, \infty)$ and
 $C^2(0, \infty)$ for the case of bounded and unbounded variation, respectively.
Lemma 6.2. If  $\Lambda>{1}/{\Phi(q)}-{\delta}/{q}$, then there exists a unique
 $b>0$ that satisfies (6.7).
Proof. In order to prove the lemma, we will show that s(b) as in (6.8) is strictly increasing and satisfies
 \begin{equation}\displaystyle\lim_{b\rightarrow0}s(b)=\dfrac{1}{\Phi(q)}-\dfrac{\delta}{q} \quad\text{and}\quad \lim_{b\rightarrow\infty}s(b)=\infty.\end{equation}
(i) Since
$s'(b)=\smash{{\delta\Phi(q){\rm{e}}^{-\Phi(q)b}\mathbb{Z}^{(q)}(b)}/{q}}>0$ for all $b \gt 0$, then $s(\cdot)$ is strictly increasing on $ (0,\infty)$.(ii) Letting
$b\rightarrow0$ in (6.8), it is easy to see that the first limit of (6.9) holds.(iii) Note that


 \begin{equation}s(b)=\frac{\delta\mathbb{Z}^{(q)}(b)}{q\Phi(q){\rm{e}}^{\Phi(q)b}}\biggr(\dfrac{q{\rm{e}}^{\Phi(q)b}\mathbb{Z}^{(\delta\Phi(q))}_{\Phi(q)}(b)}{\delta\mathbb{Z}^{(q)}(b)}-\Phi(q)\biggl).\end{equation}
Using l’Hôpital’s rule, (3.7), and the fact that  $\varphi(q)> \Phi(q)$, the following limits can be verified:
 \begin{gather*}\lim_{b\rightarrow\infty}\dfrac{\mathbb{Z}^{(q)}(b)}{{\rm{e}}^{\Phi(q)b}}=\lim_{b\rightarrow\infty}q[\Phi(q)]^{-1}{\rm{e}}^{(\varphi(q)-\Phi(q))b}{\rm{e}}^{-\varphi(q)b}\mathbb{W}^{(q)}(b)=\infty,\\[4pt]\lim_{b\rightarrow\infty}\dfrac{\mathbb{Z}^{(\delta\Phi(q))}_{\Phi(q)}(b)}{{\rm{e}}^{(\varphi(q)-\Phi(q))b}}=\lim_{b\rightarrow\infty}\delta\Phi(q)\dfrac{{\rm{e}}^{-\varphi(q)b}\mathbb{W}^{(q)}(b)}{\varphi(q)-\Phi(q)}=\delta\Phi(q)\dfrac{\psi'_{Y}(\varphi(q))^{-1}}{\varphi(q)-\Phi(q)},\\[4pt]\begin{aligned}\lim_{b\rightarrow\infty}\dfrac{q{\rm{e}}^{\Phi(q)b}\mathbb{Z}^{(\delta\Phi(q))}_{\Phi(q)}(b)}{\delta\mathbb{Z}^{(q)}(b)}&=\lim_{b\rightarrow\infty}\dfrac{\Phi(q)({\mathbb{Z}^{(\delta\Phi(q))}_{\Phi(q)}(b)}/{\delta {\rm{e}}^{(\varphi(q)-\Phi(q))b}}+{\rm{e}}^{-\varphi(q)b}\mathbb{W}^{(q)}(b))}{{\rm{e}}^{-\varphi(q)b}\mathbb{W}^{(q)}(b)}\\[4pt]&=\Phi(q)\bigg(1+\dfrac{\Phi(q)}{\varphi(q)-\Phi(q)}\biggr).\end{aligned}\end{gather*}
Hence, it follows that  $ \lim_{b\to\infty}s(b)=\infty$.☐
Now, we let  $\bar{b}_\Lambda$ be as in Lemma 6.2 for the case
 $\Lambda>{1}/{\Phi(q)}-{\delta}/{q}$ and set it to 0 otherwise.
(i) When
$\Lambda>{1}/{\Phi(q)}-{\delta}/{q}$, applying (6.7) in (6.4), with $b=\bar{b}_\Lambda$, we see that $\smash{\bar{v}_{\Lambda}^{\bar{b}_\Lambda}}$ is given by
(6.11)\begin{equation}\bar{v}_{\Lambda}^{\bar{b}_\Lambda}(x)=\begin{cases}\displaystyle{\frac{\delta}{q}\mathbb{Z}^{(q)}(\bar{b}_\Lambda-x)-\frac{{\rm{e}}^{-\Phi(q)(x-\bar{b}_\Lambda)}}{\Phi(q)}\mathbb{Z}^{(\delta\Phi(q))}_{\Phi(q)}(\bar{b}_\Lambda-x)} &\text{if}\ x\le\bar{b}_\Lambda,\\[5pt]\displaystyle{\frac{\delta}{q}-\frac{{\rm{e}}^{-\Phi(q)(x-\bar{b}_\Lambda)}}{\Phi(q)}}&\text{if}\ x>\bar{b}_\Lambda.\end{cases}\end{equation}(ii) When
$\Lambda\le{1}/{\Phi(q)}-{\delta}/{q}$, using (6.4) and because $\bar{k}_0(0, \Lambda)={\delta}/{q}+\Lambda$, we have
(6.12)\begin{align}\bar{v}^{0}_{\Lambda}(x)=\dfrac{\delta}{q}-{\rm{e}}^{-\Phi(q)x}\bigg(\dfrac{\delta}{q}+\Lambda\bigg), \qquad x \geq 0.\end{align}


Theorem 6.1. The optimal strategy for (2.7) consists of a threshold strategy at level  $\bar{b}_\Lambda$.
Proof. In view of (6.11) and (6.12), we confirm that  $\smash{\bar{v}_{\Lambda}^{\bar{b}_\Lambda}}$ is sufficiently smooth. Hence, as in the spectrally negative case, in order to verify that
 $\overline{D}^{\bar{b}_{\Lambda}}$ is the optimal strategy over all admissible strategies, it is sufficient to show that the cost function
 ${\bar{v}_{\Lambda}^{\bar{b}_{\Lambda}}}$, given by (6.11) and (6.12), satisfies (4.20) and that
 $\smash{\bar{v}_{\Lambda}^{\bar{b}_\Lambda}(0)}\geq -\Lambda$.
(i) Suppose that
$\bar{b}_\Lambda>0$, and so the threshold level $\bar{b}_\Lambda$ satisfies (6.7). From (6.11) we have
Clearly,\begin{equation}\bar{v}_{\Lambda}^{\bar{b}_\Lambda\prime}(x)=\begin{cases}{\rm{e}}^{-\Phi(q)(x-\bar{b}_{\Lambda})}\mathbb{Z}^{(\delta\Phi(q))}_{\Phi(q)}(\bar{b}_\Lambda-x) &\text{if}\ x\le \bar{b}_\Lambda,\\{\rm{e}}^{-\Phi(q)(x-\bar{b}_\Lambda)} &\text{if}\ x>\bar{b}_\Lambda.\end{cases}\end{equation}$\smash{\bar{v}^{\bar{b}_\Lambda\prime}_{\Lambda}(x)}< 1$ if $x>\bar{b}_\Lambda$. On the other hand, $\smash{\bar{v}^{\bar{b}_\Lambda\prime}_{\Lambda}(x)}$ is strictly decreasing on $[0,\bar{b}_\Lambda]$ since $ x \mapsto {\rm{e}}^{-\Phi(q)(x-\bar{b}_\Lambda)}$ is strictly decreasing and $x\mapsto\mathbb{Z}^{(\delta\Phi(q))}_{\Phi(q)}(\bar{b}_\Lambda-x)$ is nonincreasing in the interval. This together with $\smash{\bar{v}^{\bar{b}_\Lambda\prime}_{\Lambda}(\bar{b}_\Lambda)}=1$ shows that $\smash{\bar{v}^{\bar{b}_\Lambda\prime}_{\Lambda}(x)}\geq 1$ if $x\le \bar{b}_\Lambda$.Finally, we note that, using (6.7), (6.8), and (6.11),
\[\bar{v}^{\bar{b}_\Lambda}_{\Lambda}(0)=\dfrac{\delta}{q}\mathbb{Z}^{(q)}(\bar{b}_\Lambda)-\dfrac{{\rm{e}}^{\Phi(q)\bar{b}_\Lambda}}{\Phi(q)}\mathbb{Z}^{(\delta\Phi(q))}_{\Phi(q)}(\bar{b}_\Lambda)=-{\rm{e}}^{\Phi(q)\bar{b}_\Lambda} s(\bar{b}_\Lambda)=-\Lambda.\](ii) Suppose that
$\bar{b}_{\Lambda}=0$. Since $\Lambda\le{1}/{\Phi(q)}-{\delta}/{q}$, it follows that, for $x\geq 0$,
\begin{align}\bar{v}^{0\,\prime}_{\Lambda}(x)&=\Phi(q){\rm{e}}^{-\Phi(q)x}\biggl(\dfrac{\delta}{q}+\Lambda\biggr)\le {\rm{e}}^{-\Phi(q)x}\le 1.\end{align}


Finally, by (6.12) we obtain  $\smash{\bar{v}^{0}_{\Lambda}(0)} =-\Lambda$.
6.3. Constrained de Finetti’s problem for spectrally positive Lévy processes
Now we consider problem (2.2) driven by the spectrally positive Lévy process  $\overline{Y}$. Note that
 ${\overline{D}^{\bar{b}_\Lambda}}$ is the optimal strategy for (2.5) for any
 $K\in[0,1]$.
Let us define  $\tilde{\Lambda}\ :\!={1}/{\Phi(q)}-{\delta}/{q}$. Following Lemma 6.2, if
 $\tilde{\Lambda}\geq0,$ we have
 $\bar{b}_{\Lambda}=0$ for
 $\Lambda\in[0,\tilde{\Lambda}]$; on the other hand, if
 $\tilde{\Lambda}<0$ then
 $\bar{b}_{\Lambda}>0$ for all
 $\Lambda \gt 0$.
Similarly to Section 5, we need to establish the relationship between  $\Lambda$ and its corresponding threshold level
 $\bar{b}_\Lambda$ given by Lemma 6.2. From (6.7) we obtain
 $\Lambda =\tilde{\lambda}(\bar{b}_\Lambda)$ for
 $\Lambda \gt \tilde{\Lambda},$ where
 \begin{equation}\tilde{\lambda}(b) ={\rm{e}}^{\Phi(q)b} s(b),\end{equation}
with s defined in (6.10). Since s is strictly increasing (see the proof of Lemma 6.2) and satisfies (6.9), it immediately follows that  $ \tilde{\lambda}$ is also strictly increasing,
 $\lim_{b\rightarrow\infty} \tilde{\lambda}(b)=\infty,$ and
 \begin{equation}\lim_{b\rightarrow \bar{b}_{0}} \tilde{\lambda}(b)=\begin{cases}\displaystyle{\frac{1}{\Phi(q)}-\frac{\delta}{q}} &\text{if}\ \bar{b}_{0}=0,\\0 &\text{if}\ \bar{b}_{0}>0.\end{cases}\end{equation}
Here, the convergence for the case  $\bar{b}_{0} \gt 0$ holds by the fact that
 [$$\mathop {\lim }\limits_{b \to {{\overline b }_0}} \overline \lambda \left( b \right) = \mathop {\lim }\limits_{b \to {{\overline b }_0}} {{\rm{e}}^{\phi \left( q \right)b}}s\left( b \right) = {{\rm{e}}^{\phi \left( q \right){{\overline b }_0}s\left( {\overline {{b_0}} } \right)}} = 0,$$
where the last equality follows because (6.7) and Lemma 6.2 imply that  $s(\bar{b}_{0}) = 0$. Note that
 $\smash{\bar{b}_{\tilde{\lambda}(b)}}=b$ for all
 $b>\bar{b}_{0}$.
Next, we need to show that the function  $b\mapsto\overline{\Psi}_{x}(b)$, given in (6.2), is strictly decreasing with
 $x>0$ fixed. In the case that
 $x=0$, we see that
 $\overline{\Psi}_{0}(b)=1$ by (6.2). The proof of the following lemma is given in Appendix A.8.
Lemma 6.3. Let  $x \gt 0$ be fixed. Then the function
 $b \mapsto \overline{\Psi}_{x}(b)$ defined in (6.2) is strictly decreasing and satisfies
 \begin{equation}\lim_{b\rightarrow0}\overline{\Psi}_{x}(b)={\rm{e}}^{-\Phi(q)x}\quad\text{and}\quad \lim_{b\rightarrow\infty}\overline{\Psi}_{x}(b)={\rm{e}}^{-\varphi(q)x}.\end{equation}
Finally, using similar arguments as in Theorem 5.1 (noting that we have results analogous to Lemmas 5.1(iv) and 5.2), we obtain the following theorem.
Theorem 6.2. Let  $x \gt 0$ be fixed. Then
 \begin{equation}\bar{v}(x;\ K)=\begin{cases}\bar{v}^{\bar{b}_0}_{0}(x;\ K) &\text{if}\ K \in[\overline{\Psi}_{x}(\bar{b}_0),1],\\\inf_{\Lambda\geq0} \bar{v}_{\Lambda}(x;\ K) &\text{if}\ K\in({\rm{e}}^{-\varphi(q)x},\overline{\Psi}_{x}(\bar{b}_0)),\\0 &\text{if}\ K={\rm{e}}^{-\varphi(q)x},\\-\infty &\text{if}\ K \in[0,{\rm{e}}^{-\varphi(q)x}).\end{cases}\end{equation}
7. Numerical examples
In this section, we confirm the obtained results through a sequence of numerical examples for both spectrally negative and positive cases. Throughout this section, we set  $q = 0.05$.
7.1. Spectrally negative case
We first consider the spectrally negative case as studied in Sections 4 and 5. Here we assume that X is of the form
 \begin{equation}X_t - X_0= c t+ 0.2 B_t - \sum_{n=1}^{N_t} Z_n, \qquad 0\le t \lt \infty,\end{equation}
where  $B=\{B_t \colon t\ge 0\}$ is a standard Brownian motion,
 $N=\{N_t\colon t\ge 0\}$ is a Poisson process with arrival rate
 $\kappa$, and
 $Z=\{Z_n;\ n = 1,2,\ldots\}$ is an i.i.d. sequence of exponential variables with parameter 1 (so that Assumption 4.1 is satisfied). Here, the processes B, N, and Z are assumed mutually independent. We refer the reader to [Reference Egami and Yamazaki5] and [Reference Kuznetsov, Kyprianou and Rivero9] for the forms of the corresponding scale functions.
We consider the following two parameter sets.
Case 1:  $\kappa = 1$,
 $\sigma = 0.2$,
 $c = 1.5$,
 $\delta = 1$.
Case 2:  $\kappa = 0.01$,
 $\sigma = 0$,
 $c = 5$,
 $\delta = 0.1$.
Here, case 2 corresponds to the case  $\bar{\Lambda} = \infty$ where we have
 $b_\Lambda = 0$ for any choice of
 $\Lambda$ as in Remark 4.6.
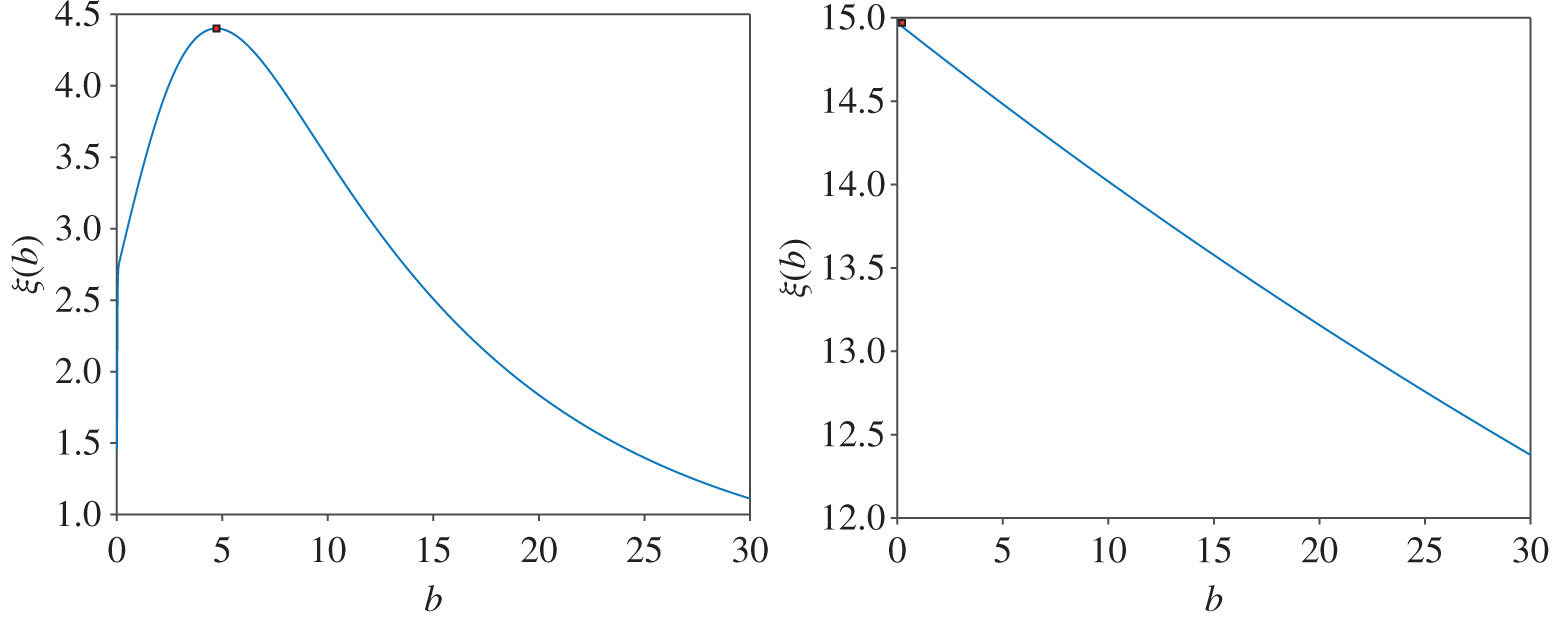
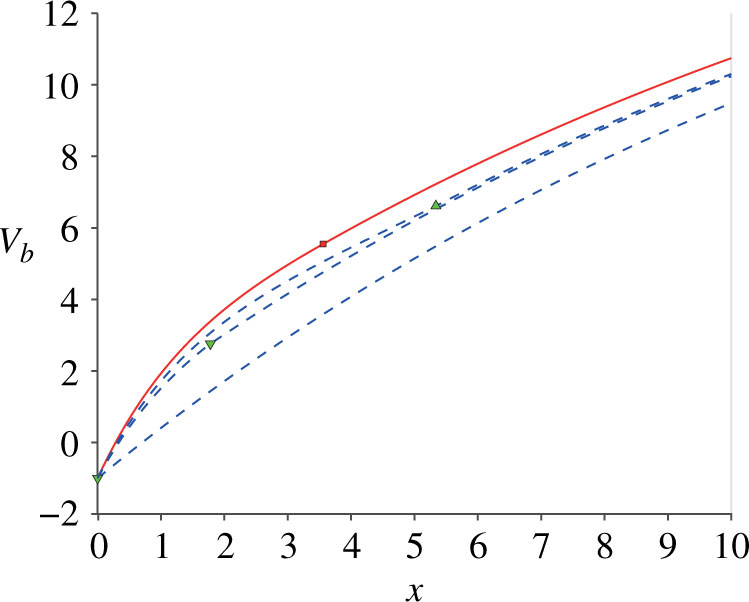
We first show the optimal solutions for the problem considered in Section 4 focusing on the case  $\Lambda = 1$. In Figure 1 we plot the function
 $b \mapsto \xi_\Lambda(b)$ as in (4.6) and (4.9). Here, in case 1, it attains a global maximum and the maximizer becomes
 $b_\Lambda$ by (4.14). In contrast, in case 2, it is monotonically decreasing and, by (4.14), we have
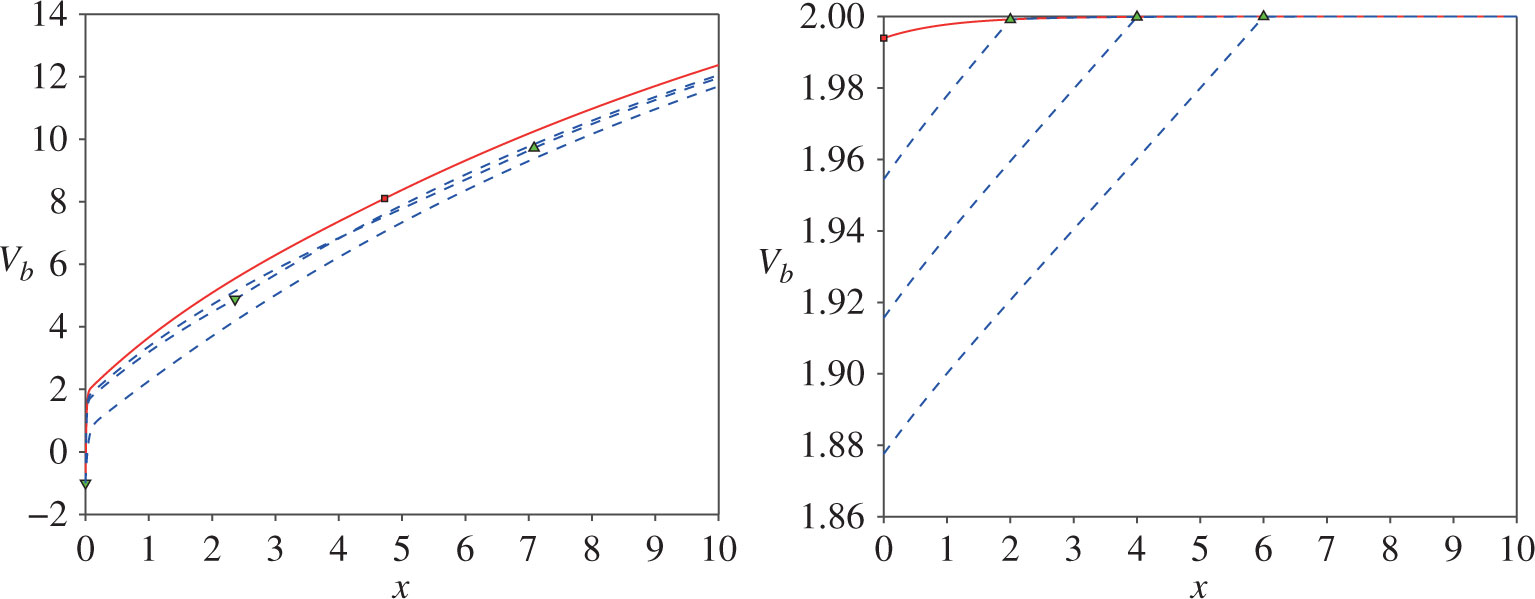
 $b_\Lambda = 0$. In Figure 2, we plot the optimal value function
 $x \mapsto V_\Lambda(x) =v_\Lambda^{b_\Lambda}(x)$ along with the suboptimal value functions
 $v_\Lambda^{b}$ for the choice of
 $b = 0, \bar{b}_\Lambda/2, 3\bar{b}_\Lambda/2$ for case 1 and
 $b = 2,4,6$ for case 2. In both cases, we confirm that
 $V_\Lambda$ dominates the suboptimal ones uniformly in x.
Plots  $b \mapsto \xi_\Lambda(b)$ for case 1 (left) and case 2 (right). The points at
 $b_\Lambda$ are indicated by squares.

Plots of  $x \mapsto V_\Lambda(x)$ (solid lines) for case 1 (left) and case 2 (right). Suboptimal value functions
 $v_\Lambda^{b}$ (dotted lines) are also plotted for the choice of
 $b = 0, \bar{b}_\Lambda/2, 3 \bar{b}_\Lambda/2$ for case 1 and
 $b =2,4,6$ for case 2. The points at
 $b_\Lambda$ are indicated by squares and those at b in the suboptimal cases are indicated by up- (respectively down-) pointing triangles when
 $b \gt b_\Lambda$ (respectively
 $b \lt b_\Lambda$).

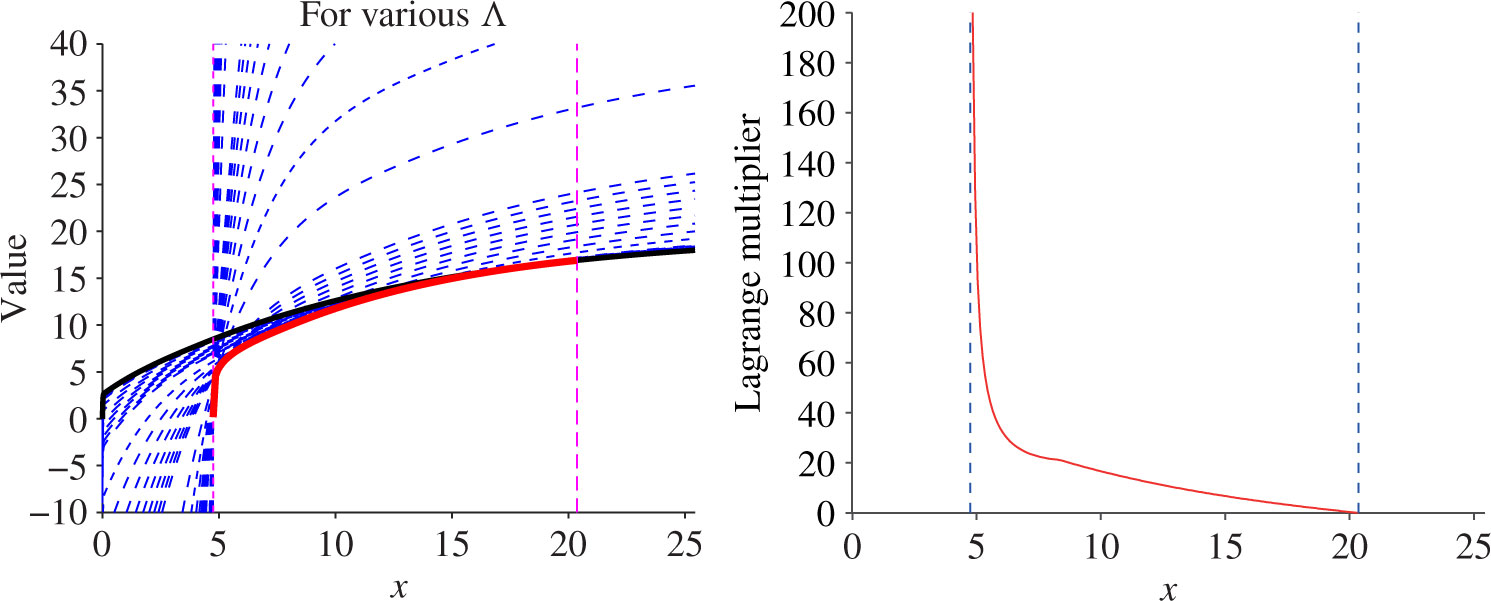
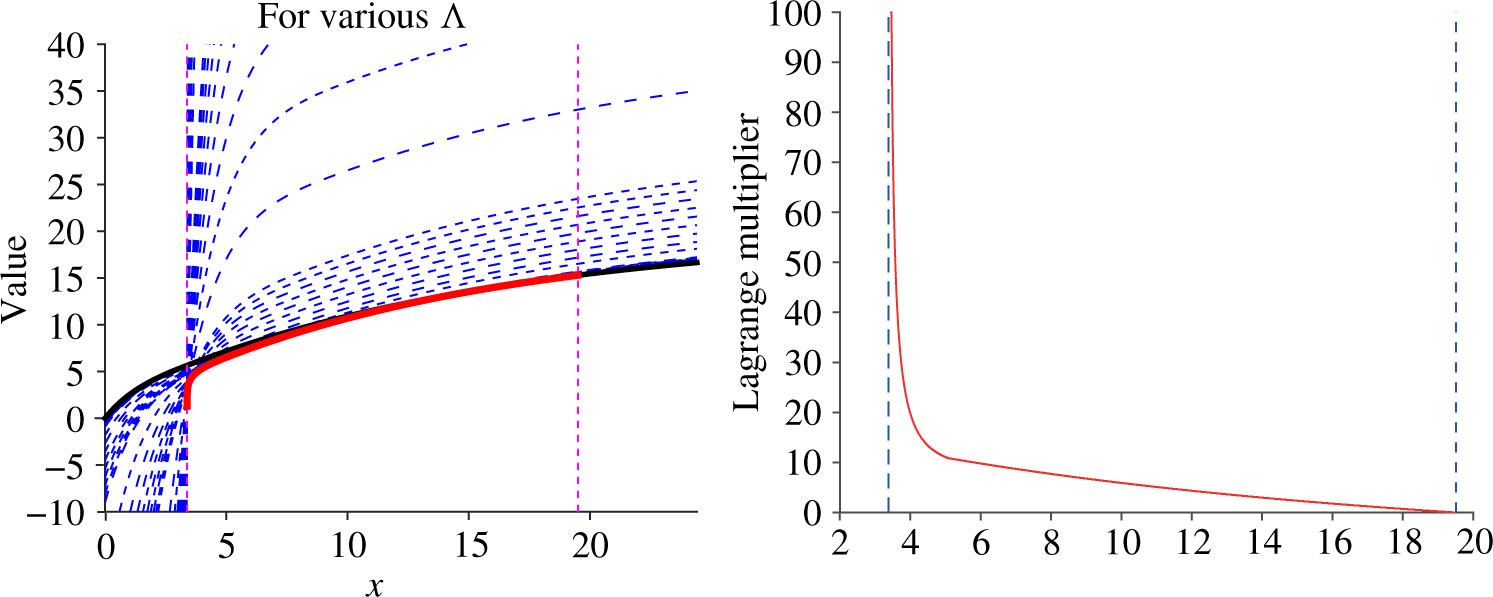
We now move onto the constrained problem (2.2) studied in Section 5, focusing on case 1 with  $K = 0.1$. Recall that the optimal solutions are given in Theorem 5.1. In the left-hand panel of Figure 3, we plot the function
 $x \mapsto V_\Lambda(x;\ K) = V_\Lambda(x) + \Lambda K$ for various values of
 $\Lambda$ ranging from 0 to
 $20\,000$. For
 $x \in (\underline{x},\overline{x}),$ where
 $\underline{x}$ and
 $\overline{x}$ are such that
 $K_{\underline{x}} = K$ and
 $\Psi_{\overline{x}}(b_0) = K$, respectively, its minimum over the considered
 $\Lambda$ gives (an approximation of)
 $V(x;\ K)$, indicated by the solid red line in the plot. On the other hand,
 $V(x;\ K)$ equals
 $V_0(x;\ K) = v_0^{b_0}(x;\ K)$ for
 $x \in[\overline{x},\infty)$ and it is infeasible for
 $x \in[0,\underline{x})$. In the right-hand panel of Figure 3, we plot, for
 $x \in (\underline{x},\overline{x})$, the Lagrange multiplier
 $\Lambda^* :\,= \arg \min_{\Lambda\geq 0} V_\Lambda(x;\ K)$. We observe that
 $\Lambda^*$ goes to
 $\infty$ as
 $x \downarrow \underline{x}$ and to 0 as
 $x \uparrow \overline{x}$.
(Left) Plots of  $x \mapsto V_\Lambda(x;\ K)$ for
 $\Lambda = 0.1$,
 $\ldots$, 1, 2,
 $\ldots$, 10, 20,
 $\ldots$, 100, 200,
 $\ldots$, 1000, 2000,
 $\ldots$,
 $10\,000$,
 $20\,000$ (dotted lines) and for
 $\Lambda = 0$ (solid, boldface line) for the case
 $K = 0.1$. The two vertical dotted lines indicate the values of
 $\underline{x}$ and
 $\overline{x}$ such that
 $K_{\underline{x}} = K$ and
 $\Psi_{\overline{x}}(b_0) = K$. On
 $[\underline{x}, \overline{x}]$, the minimum of
 $V_\Lambda(x;\ K)$ over
 $\Lambda$ is shown by a solid boldface red line. (Right) Plots of the Lagrange multiplier
 $\Lambda^*$ on
 $ (\underline{x}, \overline{x}]$ with the same two vertical lines as in the left plot.

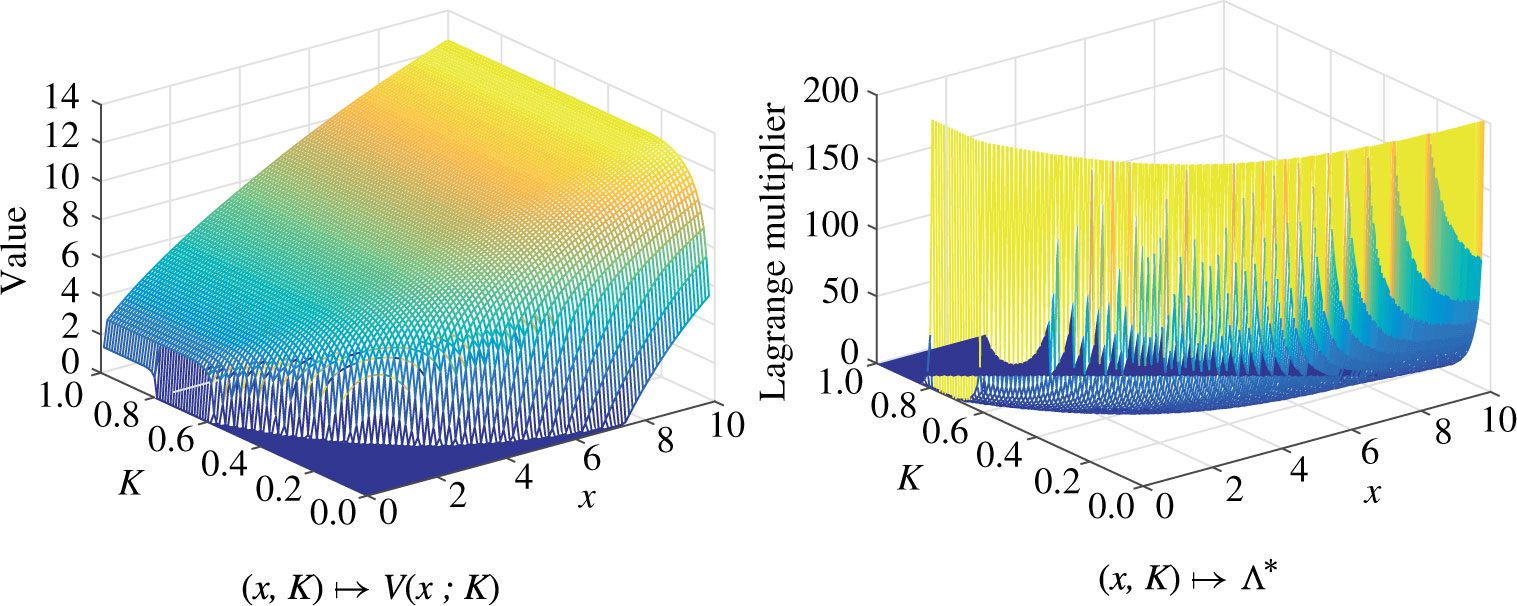
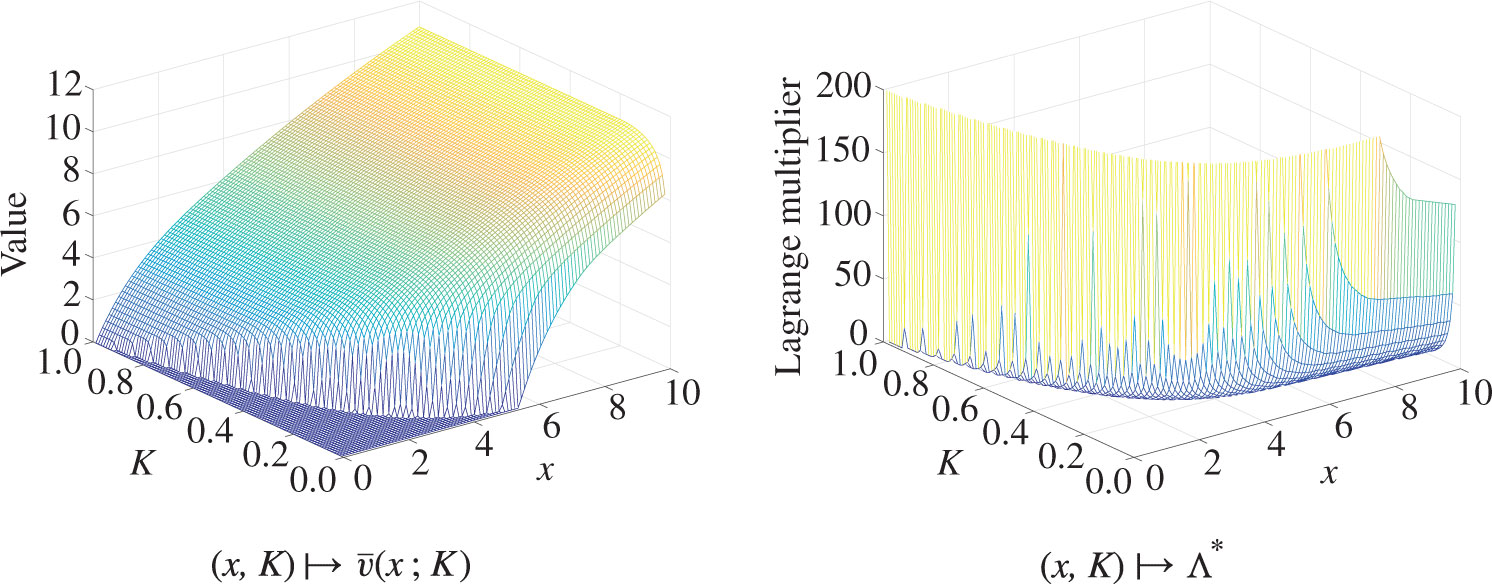
In Figure 4, we show the values of  $V(x;\ K)$ and the Lagrange multiplier
 $\Lambda^*$ as functions of
 $ (x\ ,\ K)$. Here, those
 $ (x\ ,\ K)$ at which the problem is infeasible are indicated by dark shades on the
 $z = 0$ plane. It is confirmed that
 $V(x;\ K)$ increases as x and K increase, while
 $\Lambda^*$ increases as
 $ (x\ ,\ K)$ decrease.
Plots of  $V(x;\ K)$ (left) and the Lagrange multiplier
 $\Lambda^*$ (right) as functions of x and K.

7.2. Spectrally positive case
Similarly, we confirm the results in Section 6 focusing on the case  $\overline{Y}$ is of the form
 [$$\matrix{ {\overline {{Y_t}} - \overline {{Y_0}} = - t + 0.2{B_t} + \sum\limits_{n = 1}^{{N_t}} {{Z_n}} } & {{\rm{for }}t \ge 0.} \cr } $$
Here B and N (with  $\kappa = 1.5$) are the same as in the case of (7.1), and Z is a phase-type random variable that approximates the Weibull distribution with shape parameter 2 and scale parameter 1 (see [Reference Avanzi, Pérez, Wong and Yamazaki1] for the parameters of the phase-type distribution). Throughout, we set
 $\delta = 1$.
For the (Lagrangian) problem considered in Section 6.2, the optimal threshold  $\smash{\bar{b}_\Lambda}$ is such that (6.7) holds and the value function
 $\smash{\bar{v}_\Lambda(x) =\bar{v}_\Lambda^{\bar{b}_\Lambda}(x)}$ is given in (6.11). In Figure 5 we plot the optimal value function
 $x\mapsto \bar{v}_\Lambda(x)$ along with suboptimal value functions
 $\bar{v}_\Lambda^{b}$ for the choice of
 $b = 0, \bar{b}_\Lambda/2, 3\bar{b}_\Lambda/2$ when
 $\Lambda = 1$. For the constrained case considered in Section 6.3, in Figures 6 and 7, we plot analogous results to those shown in Figures 3 and 4, where we assume that
 $K =0.1$ for Figure 6. It is confirmed that similar behaviors of the value function and the Lagrange multiplier can be observed as in the spectrally negative case.
Plots of  $x \mapsto \bar{v}_\Lambda(x)$ along with suboptimal value functions
 $\bar{v}_\Lambda^{b}$ (dotted lines) for the choice of
 $b= 0, \bar{b}_\Lambda/2, 3 \bar{b}_\Lambda/2$. The point at
 $\bar{b}_\Lambda$ is indicated by a square and the points at b in the suboptimal cases are indicated by up- (respectively down-) pointing triangles when
 $b \gt \bar{b}_\Lambda$ (respectively
 $b \lt \bar{b}_\Lambda$).

(Left) Plots of  $x \mapsto \bar{v}_\Lambda(x;\ K)$ for
 $\Lambda = 0.1$,
 $\ldots$, 1, 2,
 $\ldots$, 10, 20,
 $\ldots$, 100, 200,
 $\ldots$, 1000, 2000,
 $\ldots$,
 $10\,000$,
 $20\,000$ (dotted lines) and for
 $\Lambda = 0$ (solid, boldface line) for the case
 $K = 0.1$. The two vertical dotted lines indicate the values of
 $\underline{x}$ and
 $\overline{x}$ such that
 $\exp (- \varphi(q)\underline{x})= K$ and
 $\overline{\Psi}_{\overline{x}}(\bar{b}_0) = K$. On
 $[\underline{x}, \overline{x}]$, the minimum of
 $\bar{v}_\Lambda(x;\ K)$ over
 $\Lambda$ is shown by the solid boldface red line. (Right) Plots of the Lagrange multiplier
 $\Lambda^*$ on
 $ (\underline{x},\overline{x}]$ with the same two vertical lines as in the left plot.

Plots of  $\bar{v}(x;\ K)$ (left) and the Lagrange multiplier
 $\Lambda^*$ (right) as functions of x and K

8. Conclusions
In this paper, we studied versions of de Finetti’s problem with a constraint on the time of ruin over the set of absolutely continuous strategies. We solved it for a spectrally negative Lévy process with a completely monotone Lévy density and for a general spectrally positive Lévy process. Thanks to our analysis that the optimal solution to the Lagrangian subproblem can be characterized by a single threshold, the strong duality can be verified and hence the constrained problem can be solved efficiently.
A natural and interesting problem will be to consider the case of a general spectrally negative Lévy process, without the completely monotone Lévy density assumption. In this case, threshold strategies are in general not optimal, but as is observed in Azcue and Muler [Reference Azcue and Muler3] in a related de Finetti’s problem, a band strategy is expected to be optimal. Here a big challenge is to show the strong duality to solve the constrained problem via Lagrangian subproblems. Our methods in this paper take advantage of the explicit expressions via the scale function as well as the relation between the (single) optimal threshold and  $\Lambda$; these fail to hold when bands are required to characterize the optimal strategy for the Lagrangian subproblem. We expect that novel approaches are required to solve the problem, but the results of this paper can potentially be generalized. These are important and challenging problems and we leave them for future work.
Appendix A. Proofs
A.1 Proof Lemma 4.1
 \begin{align}\int_0^\infty {\rm{e}}^{-\varphi(q) y} W^{(q)}(y) {\rm{d}}y = (\delta\varphi(q))^{-1}.\end{align}
Using this and integration by parts,
 \begin{align}\int_0^{\infty} W^{(q) \prime}(y) {\rm{e}}^{-\varphi(q) y} {\rm d} y = -W^{(q)}(0) + \varphi(q)\int_0^{\infty} W^{(q)}(y) {\rm{e}}^{-\varphi(q) y}{\rm d} y = - W^{(q)}(0) + \delta^{-1}.\end{align}
From here, (4.10) is immediate.
Now, by differentiating (3.4) and changing variables,
 \begin{align}\mathbb{W}^{(q)}(x) - W^{(q)}(x) = \delta \bigg( \int_0^x\mathbb{W}^{(q)}(x-y) W^{(q) \prime}(y) {\rm{d}}y + \mathbb{W}^{(q)}(x)W^{(q)}(0) \bigg).\end{align}
This implies that
 \begin{align}\delta\int_0^x \mathbb{W}^{(q)}(x-y) W^{(q) \prime}(y) {\rm{d}}y =\mathbb{W}^{(q)}(x) - W^{(q)}(x) - \delta\mathbb{W}^{(q)}(x) W^{(q)}(0).\end{align}
Substituting (3.4) and (A.3) into (4.5) and after simplification, we obtain (4.11).
A.2. Proof Lemma 4.4
(i) Let us consider the case  $b_{\Lambda}>0$. For
 $x\not= b_{\Lambda}$, by differentiating (4.18),
 \begin{align}v^{b_{\Lambda}\prime}_{\Lambda}(x) &= g_{\Lambda}(b_{\Lambda})\bigg(W^{(q)\prime}(x)+ \delta\bigg[\mathbb{W}^{(q)}(0)W^{(q)\prime}(x)\nonumber\\&+\int_{b_{\Lambda}}^x\mathbb{W}^{(q)\prime}(x-y)W^{(q)\prime}(y){\rm{d}}y\bigg]{\mathbf{1}}_{\{x>b_{\Lambda}\}}\bigg)\notag\\&-q\Lambda\bigg(W^{(q)}(x)+ \delta\bigg[\mathbb{W}^{(q)}(0)W^{(q)}(x)+\int_{b_{\Lambda}}^x\mathbb{W}^{(q)\prime}(x-y)W^{(q)}(y){\rm{d}}y\bigg]{\mathbf{1}}_{\{x>b_{\Lambda}\}}\bigg)\notag\\& -\delta\mathbb W^{(q)}(x-b_{\Lambda})\notag\\&=g_{\Lambda}(b_{\Lambda})\bigg(W^{(q)\prime}(x)+\delta\int_{b_{\Lambda}}^x\mathbb{W}^{(q)}(x-y)W^{(q)\prime\prime}(y){\rm{d}}y\bigg)\notag\\&-q\Lambda\bigg(W^{(q)}(x)+\delta\int_{b_{\Lambda}}^x\mathbb{W}^{(q)}(x-y)W^{(q)\prime}(y){\rm{d}}y\bigg)\notag\\&+\delta\mathbb W^{(q)}(x-b_{\Lambda})\big(g_{\Lambda}(b_{\Lambda})W^{(q)\prime}(b_{\Lambda})-\Lambda qW^{(q)}(b_{\Lambda})-1 \big),\end{align}
where the last equality holds by integration by parts. Now, by the definition of  $g_\Lambda$ as in (4.13), we have
 \begin{align}\nonumber\\[-24pt]v^{b_{\Lambda}\prime}_{\Lambda}(x) &=g_{\Lambda}(b_{\Lambda})\bigg(W^{(q)\prime}(x)+\delta\int_{b_{\Lambda}}^x\mathbb{W}^{(q)}(x-y)W^{(q)\prime\prime}(y) {\rm{d}}y\bigg)\nonumber\\&-q\Lambda\bigg(W^{(q)}(x)+\delta\int_{b_{\Lambda}}^x\mathbb{W}^{(q)}(x-y)W^{(q)\prime}(y) {\rm{d}}y\bigg).\end{align}
Differentiating this further, we obtain, for  $x\not=b_{\Lambda},$
 \begin{align}\begin{split}v^{b_{\Lambda}\prime\prime}_{\Lambda}(x)&=g_{\Lambda}(b_{\Lambda})\bigg((1+\delta\mathbb{W}^{(q)}(0){\mathbf{1}}_{\{x>b_{\Lambda}\}})W^{(q)\prime\prime}(x)+\delta\int_{b_{\Lambda}}^x\mathbb{W}^{(q)\prime}(x-y)W^{(q)\prime\prime}(y) {\rm{d}}y\bigg)\\&-q\Lambda\bigg((1+\delta\mathbb{W}^{(q)}(0){\mathbf{1}}_{\{x>b_{\Lambda}\}})W^{(q)\prime}(x)+\delta\int_{b_{\Lambda}}^x\mathbb{W}^{(q)\prime}(x-y)W^{(q)\prime}(y){\rm{d}}y\bigg).\end{split}\end{align}
By Remark 4.1, (A.5), and (A.6), the functions  $v^{b_{\Lambda}\prime}_{\Lambda}$ and
 $v^{b_{\Lambda}\prime\prime}_{\Lambda}$ are continuous on
 $\mathbb{R}\backslash\{b_{\Lambda}\}$. Regarding the continuity at
 $b_\Lambda$, from (.61) we have
 $v^{b_{\Lambda}\prime}_{\Lambda}(b_{\Lambda}+)=v^{b_{\Lambda}\prime}_{\Lambda}(b_{\Lambda}-)$. In particular, for the case that X is of unbounded variation (where
 $\mathbb{W}^{(q)}(0) = 0$ as in (3.5)), we have, using (A.6),
 \begin{align}v^{b_{\Lambda}\prime\prime}_{\Lambda}(b_{\Lambda}+)-v^{b_{\Lambda}\prime\prime}_{\Lambda}(b_{\Lambda}-)=0.\end{align}
(ii) For the case  $b_{\Lambda}=0$, the result follows by a direct application of Lemma 4.1.
A.3. Proof of Theorem 4.1
In order to verify inequality (4.20), we will need the following preliminary results.
Lemma A.1. ([14, Theorem 2],) Under Assumption 4.1, the q-scale function  $\mathbb{W}^{(q)}$ can be written as
 \begin{align}\mathbb{W}^{(q)}(x)=\varphi'(q){\rm{e}}^{\varphi(q)x}-\hat{f}(x),\end{align}
where  $\hat{f}$ is a nonnegative, completely monotone function given by
 $\hat{f}(x)=\smash{\int_{0+}^{\infty}{\rm{e}}^{-xt}\hat{\mu}}({\rm d} t)$, where
 $\hat{\mu}$ is a finite measure on
 $ (0,\infty)$. Moreover,
 $\smash{\mathbb{W}^{(q)\prime}}$ is strictly log-convex (and hence convex) on
 $ (0,\infty)$.
Remark A.1. We note that a result analogous to Lemma A.1 holds for  $\smash{W^{(q)}}$, with f and
 $\mu$ playing the role of
 $\hat{f}$ and
 $\hat{\mu}$.
The following result will be crucial for the proof of Theorem 4.1.
Lemma A.2. For  $x \gt b_\Lambda$, we have
 \begin{align}v^{b_{\Lambda}\prime}_{\Lambda}(x)&=\int_{0+}^{\infty}{\rm{e}}^{-tx} l(t)\hat{\mu}({\rm d} t),\end{align}
where
 \begin{align}\nonumber\\[-24pt]l(t)\ &:\!= g_{\Lambda}(b_{\Lambda})\bigg((1-\delta W^{(q)}(0))t-\delta t\int_0^{b_{\Lambda}}{\rm{e}}^{ty}W^{(q)\prime}(y) {\rm{d}}y\bigg)\notag\\& +q\Lambda\bigg(1+ \delta t\int_0^{b_{\Lambda}}{\rm{e}}^{ty}W^{(q)}(y) {\rm{d}}y\bigg)+\delta {\rm{e}}^{tb_{\Lambda}}.\end{align}
Proof. By integration by parts applied to (A.3),
 \begin{align}\delta\int_{0}^x\mathbb{W}^{(q)\prime}(x-y)W^{(q)}(y) {\rm{d}}y=\mathbb{W}^{(q)}(x)-(1+\delta\mathbb{W}^{(q)}(0))W^{(q)}(x).\end{align}
On the other hand, by differentiating (A.3), we obtain
 \begin{align}\delta\int_{0}^x\mathbb{W}^{(q)\prime}(x-y)W^{(q)\prime}(y){\rm{d}}y=(1-\delta W^{(q)}(0))\mathbb{W}^{(q)\prime}(x)-(1+\delta\mathbb{W}^{(q)}(0))W^{(q)\prime}(x).\end{align}
Applying (A.10) and (A.11) in the first equality in (A.4) it follows that, for  $x \gt b_\Lambda$,
 \begin{align}v^{b_{\Lambda}\prime}_{\Lambda}(x)&=g_{\Lambda}(b_{\Lambda})\bigg((1-\delta W^{(q)}(0))\mathbb{W}^{(q)\prime}(x)-\delta\int_0^{b_{\Lambda}}\mathbb{W}^{(q)\prime}(x-y)W^{(q)\prime}(y){\rm{d}}y\bigg)\notag\\& -q\Lambda\bigg(\mathbb{W}^{(q)}(x)-\delta\int_0^{b_{\Lambda}}\mathbb{W}^{(q)\prime}(x-y)W^{(q)}(y){\rm{d}}y\bigg)-\delta\mathbb{W}^{(q)}(x-b_{\Lambda}).\end{align}
By (A.7), we can write
 \begin{align}v^{b_{\Lambda}\prime}_{\Lambda}(x) = G_1(x) + G_2(x),\end{align}
where
 \begin{align}G_1(x)\ & :\!=g_{\Lambda}(b_{\Lambda})\varphi'(q)\varphi(q){\rm{e}}^{\varphi(q)x}\bigg((1-\delta W^{(q)}(0))-\delta\int_0^{b_{\Lambda}}{\rm{e}}^{-\varphi(q)y}W^{(q)\prime}(y){\rm{d}}y\bigg)\\&-q\Lambda\varphi'(q){\rm{e}}^{\varphi(q)x}\bigg(1-\delta\varphi(q)\int_0^{b_{\Lambda}}{\rm{e}}^{-\varphi(q)y}W^{(q)}(y){\rm{d}}y\bigg)-\varphi'(q)\delta {\rm{e}}^{\varphi(q)(x-b_{\Lambda})},\\G_2(x)\ &:\!=-g_{\Lambda}(b_{\Lambda})\bigg((1-\delta W^{(q)}(0))\hat{f}'(x)-\delta\int_0^{b_{\Lambda}}\hat{f}'(x-y)W^{(q)\prime}(y){\rm{d}}y\bigg)\\& +q\Lambda\bigg(\hat{f}(x)-\delta\int_0^{b_{\Lambda}}\hat{f}'(x-y)W^{(q)}(y){\rm{d}}y\bigg)+\delta \hat{f}(x-b_{\Lambda}),\end{align}
with  $\hat{f}$ as in Remark A.1. Now we note that, by (A.1) and (A.2),
 \begin{gather}\int_0^{b_{\Lambda}}{\rm{e}}^{-\varphi(q)y}W^{(q)\prime}(y){\rm{d}}y=\frac{1}{\delta}-W^{(q)}(0) -\int_{b_{\Lambda}}^{\infty}{\rm{e}}^{-\varphi(q)y}W^{(q)\prime}(y){\rm{d}}y,\\\int_0^{b_{\Lambda}}{\rm{e}}^{-\varphi(q)y}W^{(q)}(y){\rm{d}}y=\frac{1}{\delta\varphi(q)} -\int_{b_{\Lambda}}^{\infty}{\rm{e}}^{-\varphi(q)y}W^{(q)}(y){\rm{d}}y.\end{gather}
Combining these, we obtain
 \begin{align}G_1(x) &=g_{\Lambda}(b_{\Lambda})\varphi'(q)\varphi(q){\rm{e}}^{\varphi(q)x}\delta \int_{b_{\Lambda}}^{\infty}{\rm{e}}^{-\varphi(q)y}W^{(q)\prime}(y){\rm{d}}y\\& -q\Lambda\varphi'(q){\rm{e}}^{\varphi(q)x}\delta\varphi(q)\int_{b_{\Lambda}}^{\infty}{\rm{e}}^{-\varphi(q)y}W^{(q)}(y){\rm{d}}y-\varphi'(q)\delta {\rm{e}}^{\varphi(q)(x-b_{\Lambda})}\\&=\varphi'(q){\rm{e}}^{\varphi(q)(x-b_{\Lambda})}\delta\bigg(\xi_{\Lambda}(b_{\Lambda})h(b_{\Lambda})-q\Lambda\varphi(q){\rm{e}}^{\varphi(q)b_{\Lambda}}\int_{b_{\Lambda}}^{\infty}{\rm{e}}^{-\varphi(q)y}W^{(q)}(y){\rm{d}}y\bigg)\\&-\varphi'(q)\delta {\rm{e}}^{\varphi(q)(x-b_{\Lambda})}\\&=0.\end{align}
Now, using the fact that  $\hat{f}'(x)=- \smash{\int_{0+}^{\infty} t{\rm{e}}^{-xt}\hat{\mu}({\rm d} t)}$ and Tonelli’s theorem, we have (A.8).☐
A.3.1. Proof of Theorem 4.1.
By Lemmas 4.3–4.5, it is sufficient to verify (4.20), and the condition that  $\smash{v^{b_{\Lambda}}_{\Lambda}(0)}\geq -\Lambda$.
(i) First, consider the case  $b_{\Lambda}>0$. In this case, recall that
 $\xi_{\Lambda}(b_{\Lambda})=g_{\Lambda}(b_{\Lambda})$ (implied by
 $\xi'_\Lambda (b_\Lambda) = 0$ and the expression (4.12)).
1. Suppose that  $x\le b_{\Lambda}$. Since
 $g_{\Lambda}$ is increasing on
 $ (0,a_{\Lambda})$ by Remark 4.5(ii) and
 $b_{\Lambda}\le a_{\Lambda}$ by Proposition 4.2(i), we obtain
 \begin{equation}\xi_{\Lambda}(b_{\Lambda})=g_{\Lambda}(b_{\Lambda})\geq g_{\Lambda}(x)=\dfrac{1+q\Lambda W^{(q)}(x)}{W^{(q)\prime}(x)} \quad\text{for all}\ 0 \lt x\leq b_{\Lambda}.\end{equation}
Applying (A.12) in (A.5), it follows that  $v^{b_{\Lambda}\prime}_{\Lambda}(x) \geq1$.
2. Now suppose that  $x>b_{\Lambda}$. Differentiating (A.9) twice, we have
 \begin{align}l''(t)&= -\delta g_{\Lambda}(b_{\Lambda})\bigg(2\int_0^{b_{\Lambda}}y{\rm{e}}^{t\ y}W^{(q)\prime}(y){\rm{d}}y+t\int_0^{b_{\Lambda}}y^2{\rm{e}}^{t\ y}W^{(q)\prime}(y){\rm{d}}y\bigg)+\delta b_{\Lambda}^2{\rm{e}}^{tb_{\Lambda}}\notag\\& + \delta q\Lambda\bigg(2\int_0^{b_{\Lambda}}y{\rm{e}}^{t\ y}W^{(q)}(y){\rm{d}}y+t\int_0^{b_{\Lambda}}y^2{\rm{e}}^{t\ y}W^{(q)}(y){\rm{d}}y\bigg).\end{align}
On the other hand, using (A.12), we have  $g_{\Lambda}(b_{\Lambda})\smash{W^{(q)\prime}(y)}\geq 1+q\Lambda\smash{W^{(q)}(y)}$ for all
 $y\in(0,b_{\Lambda}]$. Hence,
 \begin{align}l''(t)&\le -\delta \bigg(2\int_0^{b_{\Lambda}}\!y{\rm{e}}^{t\ y}(1+ q\Lambda W^{(q)}(y)){\rm{d}}y+t\int_0^{b_{\Lambda}}\!y^2{\rm{e}}^{t\ y}(1+q\Lambda W^{(q)}(y)){\rm{d}}y\bigg)+\delta b_{\Lambda}^2{\rm{e}}^{tb_{\Lambda}}\notag\\& +\delta q\Lambda\bigg(2\int_0^{b_{\Lambda}}y{\rm{e}}^{t\ y}W^{(q)}(y){\rm{d}}y+t\int_0^{b_{\Lambda}}y^2{\rm{e}}^{t\ y}W^{(q)}(y){\rm{d}}y\bigg)\\&=-\delta \biggl(2\int_0^{b_{\Lambda}}y{\rm{e}}^{t\ y}{\rm d}y+t\int_0^{b_{\Lambda}}y^2{\rm{e}}^{t\ y}{\rm d} y\biggr)+\delta b_{\Lambda}^2{\rm{e}}^{tb_{\Lambda}}\\&=0.\end{align}
Therefore, l is a concave function. In addition, since  $l(0)=q\Lambda+\delta$, which is positive by Assumption 4.2, and recalling that
 $x \gt b_\Lambda$, it follows that there exists
 $0<p\le\infty$ such that l is positive on (0,p) and negative on
 $ (p,\infty)$. Consequently,
 \begin{align}{\rm{e}}^{-(x-b_{\Lambda})t}l(t)\geq {\rm{e}}^{-(x-b_{\Lambda})p}l(t), \qquad t>0.\end{align}
Now we note from (A.9) that there exists a constant  $C(b_{\Lambda})$ independent of t such that
 $|l(t)|\le C(b_{\Lambda})(1+t){\rm{e}}^{tb_{\Lambda}}$. Therefore, using the fact that
 $x>b_{\Lambda}$ and the dominated convergence, we can take the derivative inside the integral in (A.8) and obtain
 \begin{align}v^{b_{\Lambda}\prime\prime}_{\Lambda}(x)&= -\int_{0+}^{\infty}{\rm{e}}^{-(x-b_{\Lambda})t}{\rm{e}}^{-b_{\Lambda}t}t l(t)\hat{\mu}({\rm d}t)\nonumber\\&\le -{\rm{e}}^{-(x-b_{\Lambda})p}\int_{0+}^{\infty} {\rm{e}}^{-b_{\Lambda}t}tl(t)\hat{\mu}({\rm d} t)\nonumber\\&= {\rm{e}}^{-(x-b_{\Lambda})p}v^{b_{\Lambda}\prime\prime}_{\Lambda}(b_{\Lambda}),\end{align}
where the inequality holds by (A.13). On the other hand, Proposition 4.2 implies that  $b_{\Lambda}\le a_{\Lambda}$, and hence, by Remark 4.5(ii),
 \begin{align}0\le g'_{\Lambda}(b_{\Lambda})=q\Lambda-\dfrac{W^{(q)\prime\prime}(b_{\Lambda})}{W^{(q)\prime}(b_{\Lambda})}g_{\Lambda}(b_{\Lambda}).\end{align}
Therefore, (A.6) gives
 \begin{equation}v^{b_{\Lambda}\prime\prime}_{\Lambda}(b_{\Lambda}+) = (1+\delta {\mathbb{W}}^{(q)}(0)) (g_{\Lambda}(b_{\Lambda})W^{(q)\prime\prime}(b_{\Lambda})-q\Lambda W^{(q)\prime}(b_{\Lambda}))\le 0.\end{equation}
In combination with (A.14), it follows that  $\smash{v^{b_{\Lambda}\prime}_{\Lambda}}$ is nonincreasing on
 $ (b_{\Lambda},\infty)$. In addition, we note using (4.13) and (A.5) that
 \begin{align}v^{b_{\Lambda}\prime}_{\Lambda}(b_{\Lambda})=g_{\Lambda}(b_{\Lambda})W^{(q)\prime}(b_\Lambda)-q\Lambda W^{(q)}(b_\Lambda)=1.\end{align}
Hence, we deduce that  $\smash{v^{b_{\Lambda}\prime}_{\Lambda}(x)}\le 1$ for
 $x>b_{\Lambda}$.
3. Finally, using (4.18), and the fact that  $g_{\Lambda}(b_{\Lambda})\geq0$,
 [$$v_\Lambda ^{b\Lambda }\left( 0 \right) = g\Lambda \left( {b\Lambda } \right){W^{\left( q \right)}}\left( 0 \right) - \Lambda \ge - \Lambda ,$$
as required.
(ii) Now, consider the case  $b_{\Lambda}=0$. By taking a derivative in (4.11), and using (4.10) and (A.7), we obtain
 \begin{align}v_{\Lambda}^{0\,\prime \prime}(x)&=(\delta+q\Lambda)\biggr(\frac{\mathbb{W}^{(q) \prime}(x)}{\varphi(q)}-\mathbb{W}^{(q)}(x)\biggl)' \notag\\&=(\delta+q\Lambda)\bigg(-\frac {\hat{f}'(x)} {\varphi(q)} + \hat{f}(x)\bigg)' \nonumber\\&= (\delta+q\Lambda) \bigg( -\frac {\hat{f}''(x)}{\varphi(q)} +\hat{f}'(x) \bigg),\end{align}
which is negative because  $\smash{\hat{f}}$ is completely monotone. Therefore,
 $\smash{v_{\Lambda}^{0\,\prime}(x)}$ is nonincreasing, and hence, it is enough to verify that
 $\smash{v_{\Lambda}^{0\,\prime}(0+)}\le1$ or, equivalently,
 \begin{equation}\frac{(\delta+q\Lambda)\mathbb{W}^{(q)\prime}(0+)}{1+(\delta+q\Lambda)\mathbb{W}^{(q)}(0)}\le\varphi(q).\end{equation}
This inequality is automatically satisfied in cases 1 and 2 given in Proposition 4.2(ii). Therefore, we have (4.20) when  $b_{\Lambda}=0$. To complete the proof, using (4.10), (4.11), and Assumption 4.2, we have
 $$v_\Lambda ^0\left( 0 \right) = {{\left( {\delta + q\Lambda } \right)} \over {\varphi \left( q \right)}}{{\rm{W}}^{\left( q \right)}}\left( 0 \right) - \Lambda \ge - \Lambda .$$
A.4. Proof of Lemma 5.1
First we note that, using (4.3),
 \begin{align}h'(b)=\varphi(q)(h(b)-W^{(q)\prime}(b)).\end{align}
Hence,
 \begin{equation}h'(b)H(b)=\varphi(q)W^{(q)}(b)\bigg(\dfrac{W^{(q)\prime}(b)}{W^{(q)}(b)}\bigg(W^{(q)}(b)+\dfrac{h(b)}{\varphi(q)}\bigg)-h(b)\bigg).\end{equation}
Now, since  $h'>0$ on
 $ (b_{0},\infty)$ (see Remark 4.4(i)), it is enough to show that the right-hand side of (A.16) is positive. On the other hand, we know from [Reference Hernández, Junca and Moreno-Franco8] that
 $\smash{W^{(q)}}$ is log-concave on
 $ (0,a_0]$ and strictly log-concave on
 $ (a_0,\infty)$, where
 $a_0$ is defined in Remark 4.5 for the case
 $\Lambda = 0$. Then
 \begin{equation}\dfrac{W^{(q)\prime}(\eta)}{W^{(q)}(\eta)}\geq\dfrac{W^{(q)\prime}(\varsigma)}{W^{(q)}(\varsigma)} \quad\text{for any $\eta$ and$\varsigma$ with $0 \lt \eta\le\varsigma$.}\end{equation}
Note that the previous inequality is strict when  $a_0 \lt \eta \lt \varsigma$. From here, it can be verified that
 \begin{equation}\dfrac{W^{(q)\prime}(b)}{W^{(q)}(b)}\int_{b}^{\infty}{\rm{e}}^{-\varphi(q)y}W^{(q)}(y){\rm{d}}y \gt \int_{b}^{\infty}{\rm{e}}^{-\varphi(q)y} W^{(q)\prime}(y) {\rm{d}}y,\end{equation}
and using (4.3) and (4.8), it follows that
 \begin{equation}\dfrac{W^{(q)\prime}(b)}{W^{(q)}(b)}\bigg(W^{(q)}(b)+\dfrac{h(b)}{\varphi(q)}\bigg)>h(b) \quad\text{for all $b>0$}.\end{equation}
From (A.16) and (A.17), we have  $h'(b)H(b)>0$ for
 $b \in(b_0,\infty)$, as desired.
Now, taking the first derivative in (5.3) and by (A.15), we have
 \begin{align}H^{\prime}(b)&= h(b)-\dfrac{[h(b)]^{2}h''(b)}{[h'(b)]^{2}}\notag\\&=\dfrac{h(b)}{[h'(b)]^{2}}([h'(b)]^{2}-h(b)h''(b))\notag\\&=\dfrac{[\varphi(q)h(b)]^{2}W^{(q)\prime}(b)}{[h'(b)]^{2}}\biggr(\dfrac{W^{(q)\prime}(b)}{h(b)}+\dfrac{W^{(q) \prime\prime}(b)}{\varphi(q)W^{(q)\prime}(b)}-1\biggr),\end{align}
where the last equality holds because
 \begin{align}&[h'(b)]^{2}-h(b)h''(b)\\&\qquad= \varphi^2(q)(h(b)-W^{(q)\prime}(b))^2 - h(b)\varphi(q)[\varphi(q)(h(b)-W^{(q)\prime}(b))-W^{(q)\prime \prime}(b)]\\&\qquad= \varphi(q) \{ \varphi(q) ( W^{(q)\prime}(b)^2 - h(b)W^{(q)\prime}(b) ) + h(b) W^{(q)\prime \prime}(b) \}.\end{align}
Since, by Remark A.1,  $\smash{W^{(q)\prime}}$ is a strictly log-convex function, we have
 \begin{equation}\dfrac{W^{(q)\prime\prime}(\eta)}{W^{(q)\prime}(\eta)} \lt \dfrac{W^{(q)\prime\prime}(\varsigma)}{W^{(q)\prime}(\varsigma)} \quad\text{for any$\eta$ and $\varsigma$ with $0 \lt \eta \lt \varsigma$.}\end{equation}
From the above and integration by parts we can show that
 \begin{align}\frac{W^{(q)\prime\prime}(b)}{W^{(q)\prime}(b)}h(b)& \lt \varphi(q){\rm{e}}^{\varphi(q)b}\int_b^\infty {\rm{e}}^{-\varphi(q) y} W^{(q)\prime\prime}(y) {\rm{d}}y=-\varphi(q)W^{(q)\prime}(b)+\varphi(q)h(b),\end{align}
and hence,
 \begin{align}\dfrac{W^{(q)\prime}(b)}{h(b)}+\dfrac{W^{(q)''}(b)}{\varphi(q)W^{(q)\prime}(b)}-1 \lt \dfrac{W^{(q)\prime}(b)}{h(b)}+\dfrac{h(b)-W^{(q)\prime}(b)}{h(b)}-1=0.\end{align}
Hence, we conclude that the function H as in (5.3) is strictly decreasing.
A.5. Proof of Proposition 5.1
(i) For the case  $\bar{\Lambda} \geq 0$, Remark 4.6 gives
 $b_{0}=0$. Then, from (4.10), (5.3), and (A.15),
 \begin{align}\lim_{b\rightarrow0}H(b)&=\frac{[h(0)]^2}{h'(0+)}-\bigg(W^{(q)}(0)+\frac{h(0)}{\varphi(q)}\bigg)\notag\\&=\frac{h(0)W^{(q)\prime}(0+)-\varphi(q)W^{(q)}(0)(h(0)-W^{(q)\prime}(0+))}{\varphi(q)(h(0)-W^{(q)\prime}(0+))}\notag\\&=\dfrac{\delta^{-1}W^{(q)\prime}(0+)-\varphi(q)W^{(q)}(0)(\delta^{-1}-W^{(q)}(0))}{\varphi(q)(\delta^{-1}-W^{(q)}(0))-W^{(q)\prime}(0+)}.\end{align}
Using (3.5), (3.6), and the fact that  $\phi_1(\bar{\Lambda})=\varphi(q)$ or
 $\phi_2(\bar{\Lambda})=\varphi(q)$ (see Remark 4.6), it can be verified that
 $\lim_{b\rightarrow0}H(b)=1/q\bar{\Lambda}$ (where in the case
 $\bar{\Lambda}=0$ the right-hand side is understood to be
 $\infty$), and hence,
 $\lim_{b\downarrow b_{0}} \lambda(b) = \lim_{b\downarrow 0}\lambda(b)=\bar{\Lambda}$.
For the case  $\bar{\Lambda} \lt 0$, Remark 4.6 gives
 $b_{0}>0$. By Lemma 3 of [Reference Kyprianou, Loeffen and Pérez12], we know that h attains its unique minimum at
 $b_{0}$ and, by the continuity of h’,
 $\lim_{b\rightarrow b_{0}}h'(b)=h'(b_{0})=0$. In addition, by (A.15),
 $\lim_{b\rightarrow b_{0}}h(b) = \smash{W^{(q)\prime} (b_0)} \gt 0$. Therefore, from (5.3), we obtain
 $\lim_{b\rightarrow b_{0}}H(b)=\infty$, and, hence,
 $\lim_{b\downarrow b_{0}}\lambda(b)=0=\bar{\Lambda} \vee 0$.
(ii) From Remark A.1, we can write
 \begin{align}h(b) = \varphi(q) \bigg(\frac { \Phi(q) \Phi'(q) {\rm{e}}^{\Phi(q) b}}{\varphi(q) - \Phi(q)} - \tilde{f}(b) \bigg),\end{align}
where  $\tilde{f}(b)\ :\!=\smash{\int_{0}^{\infty}{\rm{e}}^{-\varphi(q)y}f'(y+b)}{\rm{d}}y$, and hence we get the following expressions:
 \begin{gather*}[h(b)]^{2} = [\varphi(q)]^{2}\bigg(\dfrac{[\Phi(q)\Phi'(q)]^{2}}{(\varphi(q)- \Phi(q))^{2}}{\rm{e}}^{2\Phi(q)b}-\frac{2\Phi(q)\Phi'(q)}{\varphi(q)- \Phi(q)}{\rm{e}}^{\Phi(q)b}\tilde{f}(b)+[\,\tilde{f}(b)]^{2}\bigg),\\h'(b) =\varphi(q)\biggl(\dfrac{[\Phi(q)]^{2}\Phi'(q)}{\varphi(q)-\Phi(q)}{\rm{e}}^{\Phi(q)b}-\varphi(q)\,\tilde{f}\,(b)+f'(b)\biggr),\end{gather*}
and
 \begin{equation}W^{(q)}(b)+\frac{h(b)}{\varphi(q)} =\dfrac{\Phi'(q)\varphi(q)}{\varphi(q)-\Phi(q)}{\rm{e}}^{\Phi(q)b}-\tilde{f}(b)-f(b).\end{equation}
Applying these identities in (5.3), it follows that
 \begin{align}H(b)&=\dfrac{\varphi(q)\Phi(q)\Phi'(q)}{\varphi(q)-\Phi(q)} H_1(b)+\dfrac{\varphi(q)^2[\,\tilde{f}(b)]^{2}}{h'(b)}+\tilde{f}(b)+f(b),\end{align}
where
 \begin{align}\\[-24pt]H_1(b)\ &:\!={\rm{e}}^{\Phi(q)b} \bigg[\frac {\varphi(q)} {h'(b)} \bigg( \dfrac{\Phi(q)\Phi'(q)}{\varphi(q)-\Phi(q)}{\rm{e}}^{\Phi(q)b}-2\tilde{f}(b) \bigg)-\dfrac{1}{\Phi(q)}\bigg]\\&= \frac {\varphi(q)} {\Phi(q)}\dfrac{\varphi(q)\ \tilde{f}\ (b)-2\Phi(q)\ \tilde{f}\ (b)-f'(b)}{h'(b)}.\end{align}
By the dominated convergence theorem we have  $f(b)\to 0$,
 $\tilde{f}(b)\to 0$, and
 $f'(b)\to 0$ as
 $b\to\infty$. Hence
 $\lim_{b\rightarrow \infty}H(b)=0$ or, equivalently,
 $\lim_{b\rightarrow\infty}\lambda(b)=\infty$.
(iii) Fix  $b \gt b_0$. First let us assume that
 $b_0>0$ or that
 $b_0=0$ and
 $h'(0+)=0$. Then, using (4.12) for
 $\Lambda = \lambda(b)$, we have
 \begin{align}\dfrac{{\rm d}\xi_{\lambda(b)}(\varsigma)}{{\rm d}\varsigma} = q \lambda(b)-\dfrac{h'(\varsigma)}{h(\varsigma)}\xi_{\lambda(b)}(\varsigma)\quad\text{for $\varsigma \gt 0$}.\end{align}
For  $\varsigma\in (0,b_0]$, by the fact that
 $h'(\varsigma)\le0$ for
 $\varsigma\in[0,b_0]$ (see Remark 4.4(i)) we have that
 ${{\rm d}\xi_{\lambda(b)}(\varsigma)}/{{\rm d}\varsigma} \gt 0$. On the other hand, applying (A.15) and (4.9) in (A.18),
 \begin{align}\dfrac{{\rm d}\xi_{\lambda(b)}(\varsigma)}{{\rm d}\varsigma}&=\dfrac{1}{[h(\varsigma)]^{2}}\biggr(q\lambda(b)\biggr([h(\varsigma)]^{2}-h'(\varsigma)\biggr(W^{(q)}(\varsigma)+\dfrac{h(\varsigma)}{\varphi(q)}\biggl)\biggr)-h'(\varsigma)\biggl)\notag\\&=\dfrac{h'(\varsigma)}{[h(\varsigma)]^{2}}\biggr(\frac{\lambda(b)}{\lambda(\varsigma)}-1\biggl).\end{align}
Then, using the fact that  $\varsigma\mapsto\lambda(\varsigma)$ is strictly increasing as in (i), and that
 $h'(\varsigma)>0$ for
 $\varsigma>b_0$ (see Remark 4.4(i)), we have
 ${{\rm d}\xi_{\lambda(b)}(\varsigma)}/{{\rm d}\varsigma}>0$ for
 $b_0 \lt \varsigma<b$ and vanishes at
 $\varsigma=b$. Now let us assume that
 $b_0=0$ and that
 $h'(0+)>0$. Then, by the proof of Lemma 3 of [Reference Kyprianou, Loeffen and Pérez12], we have
 $h'(\zeta)>0$ for all
 $\zeta >0$. Hence, (A.19) implies that
 ${{\rm d}\xi_{\lambda(b)}(\varsigma)}/{{\rm d}\varsigma}>0$ for
 $0 \lt \varsigma<b$ and vanishes at
 $\varsigma=b$. The above implies that
 $b=\inf\{\varsigma\geq0\colon {{\rm d}\xi_{\lambda(b)}(\varsigma)}/{{\rm d}\varsigma}\le0\}$. Therefore, by (4.14) we obtain
 $b_{\lambda(b)}=b$ for all
 $b \gt b_{0}$.
A.6. Proof of Lemma 5.2
1. We have, by (A.15),
 \begin{align}\dfrac{{\rm d}}{{\rm d} b} \frac{W^{(q)}(b)}{h(b)} = \frac {\alpha(b)}{[h(b)]^2}, \qquad b \gt 0,\end{align}
with
 \begin{align}\alpha(b)\ :\!= W^{(q)\prime}(b) h(b) - W^{(q)}(b)\varphi(q)(h(b)-W^{(q)\prime}(b)) \gt 0, \qquad b \gt 0,\end{align}
where the positivity holds by (A.17).
If  $x\leq b$, we have, by (5.4),
 \begin{equation}\Psi_{x}(b)=Z^{(q)}(x)-\dfrac{q(W^{(q)}(b)+h(b)/\varphi(q))}{h(b)}W^{(q)}(x).\end{equation}
Taking the derivative with respect to b, by (A.20) and the positivity of  $\alpha$,
 \begin{align}\frac{{\rm d}\Psi_{x}(b) }{{\rm d} b} =-\dfrac{qW^{(q)}(x)}{[h(b)]^{2}}\alpha(b) \lt 0.\end{align}
Therefore,  $\Psi_{x}$ is strictly decreasing on
 $[x,\infty)$.
Suppose that  $b<x$. By (A.20) and (5.4),
 \begin{align}\frac{{\rm d}\Psi_{x}(b)}{{\rm d} b}&=-\delta q \mathbb{W}^{(q)}(x-b)W^{(q)}(b)\notag\\& +\frac{q\delta\mathbb{W}^{(q)}(x-b)W^{(q)\prime}(b)(W^{(q)}(b)+h(b)/\varphi(q))}{h(b)}\notag\\& -q\bigg(W^{(q)}(x)+\delta\int_b^x\mathbb{W}^{(q)}(x-y)W^{(q)\prime} (y){\rm d} y\bigg)\dfrac{{\rm d}}{{\rm d}b}\biggr[\frac{W^{(q)}(b)+h(b)/\varphi(q)}{h(b)}\biggl]\notag\\&=\dfrac{q}{[h(b)]^{2}} r(b;\ x) \alpha(b),\end{align}
where, for  $x,b\geq0$,
 \begin{equation}r(b;\ x)\ :\!=\dfrac{\delta\mathbb{W}^{(q)}(x-b)h(b)}{\varphi(q)}-W^{(q)}(x)-\delta\int_{b}^{x}\mathbb{W}(x-y)W^{(q)\prime}(y){\rm{d}}y.\end{equation}
To prove that  ${\rm d}\Psi_{x} / {{\rm d} b}<0$ on
 $ (0\ ,\ x)$, by the positivity of
 $\alpha$, we only need to verify that
 $r(b;\ x) \lt 0$ for all
 $b\in(0,x)$.
Note that, by (4.8),
 \begin{align}\dfrac{\delta\mathbb{W}^{(q)}(x-b)h(b)}{\varphi(q)}=\delta\mathbb{W}^{(q)}(x-b)\biggr(\varphi(q){\rm{e}}^{\varphi(q)b}\int_{b}^{\infty}{\rm{e}}^{-\varphi(q)y}W^{(q)}(y){\rm{d}}y-W^{(q)}(b)\biggl).\end{align}
Using integration by parts and (A.10),
 \begin{align}&-\delta\int_{b}^{x}\mathbb{W}^{(q)}(x-y)W^{(q)\prime}(y){\rm{d}}y\\&\qquad=\delta\mathbb{W}^{(q)}(x-b)W^{(q)}(b)-\mathbb{W}^{(q)}(x)+W^{(q)}(x)+\delta\int_{0}^{b}\mathbb{W}^{(q)\prime}(x-y) W^{(q)}(y) {\rm{d}}y.\end{align}
Substituting these,
 \begin{align}r(b;\ x)&=-\mathbb{W}^{(q)}(x)+\delta\int_{0}^{b}\mathbb{W}^{(q)\prime}(x-y)W^{(q)}(y){\rm{d}}y\\& +\delta\varphi(q){\rm{e}}^{\varphi(q)b}\mathbb{W}^{(q)}(x-b)\int_{b}^{\infty}{\rm{e}}^{-\varphi(q)y}W^{(q)}(y){\rm{d}}y.\end{align}
Now, we rewrite this using Lemma A.1. By observing that the terms corresponding to  $\smash{{\rm{e}}^{\varphi(q)x}}$ all cancel out (using the fact that
 $\smash{\int_0^\infty {\rm{e}}^{-\varphi(q)y} W^{(q)}(y)} {\rm{d}}y= (\delta \varphi(q))^{-1}$), it follows that
 \begin{align}r(b;\ x) &=\hat{f}(x)-\delta\int_{0}^{b}\!\hat{f}^{'}(x-y)W^{(q)}(y){\rm{d}}y-\delta\varphi(q) {\rm{e}}^{\varphi(q)b}\hat{f}(x-b)\int_{b}^{\infty}\!{\rm{e}}^{-\varphi(q)y}W^{(q)}(y){\rm{d}}y\notag\\&=\int_{0}^{\infty}{\rm{e}}^{-xt}\biggr(1+\delta t\int_{0}^{b}{\rm{e}}^{yt}W^{(q)}(y) {\rm{d}}y\nonumber\\&-\delta \varphi(q){\rm{e}}^{b(t+\varphi(q))}\int_{b}^{\infty}{\rm{e}}^{-\varphi(q)y}W^{(q)}(y){\rm{d}}y\biggl)\hat{\mu}({\rm d}t).\end{align}
Taking the derivative with respect to b in (A.23), it follows that
 \begin{align}\dfrac{\partial r(b;\ x)}{\partial b}&=\int_{0}^{\infty}{\rm{e}}^{-xt}\biggr(\delta (t+\varphi(q)){\rm{e}}^{bt}W^{(q)}(b)\notag\\&-\delta \varphi(q)(t+\varphi(q)) {\rm{e}}^{b(t+\varphi(q))}\int_{b}^{\infty} {\rm{e}}^{-\varphi(q)y}W^{(q)}(y){\rm{d}}y\biggl)\hat{\mu}({\rm d}t)\notag\\&\lt \int_{0}^{\infty}{\rm{e}}^{-xt}\biggr(\delta (t+\varphi(q)){\rm{e}}^{bt}W^{(q)}(b)\notag\\&-\delta\varphi(q)(t+\varphi(q)){\rm{e}}^{b(t+\varphi(q))}W^{(q)}(b)\int_{b}^{\infty}{\rm{e}}^{-\varphi(q)y}{\rm d} y\biggl)\hat{\mu}({\rm d} t)\\&=0,\end{align}
where the inequality follows since  $W^{(q)}$ is strictly increasing on
 $ (0,\infty)$. From here we conclude that
 $r(b;\ x)$ is strictly decreasing on (0,x).
On the other hand, by (A.23) we obtain  $\lim_{b\rightarrow0}r(b;\ x)=0$, and hence,
 $ r(b;\ x)<0$ on (0, x). Now we conclude by (A.22) that
 $b \mapsto \Psi_{x}(b)$ is also strictly decreasing on (0,x).
2. By (4.17), we see that
 \begin{equation}\lim_{b\rightarrow\infty}\dfrac{W^{(q)}(b)+h(b)/\varphi(q)}{h(b)}=\dfrac{1}{\Phi(q)}.\end{equation}
Then, letting  $b\rightarrow\infty$ in (A.21) and using (A.24), we obtain the expression in (5.5).
A.7. Proof of Proposition 6.1
Consider  $U^{-b}$ the (spectrally negative) refracted Lévy process with refraction level
 $-b$, driven by the process X (as in Section 2), and
 $\eta_{-b}\ :\!=\inf\{t>0\colon U^{-b}_{t} >0 \}$. Then
 \begin{gather*}\overline{\Psi}_{x}(b)=\mathbb{E}x_{-x}[{\rm{e}}^{-q\eta_{-b}};\ \eta_{-b} \lt \infty],\\\overline{\mathbb{E}}_{x}\biggr[ \int_0^{\bar{\tau}_{b}} {\rm{e}}^{-qt}{\rm d}\overline{D}^{b}_{t}\biggl] =\delta\biggr(\dfrac{1}{q}(1-\overline{\Psi}_{x}(b))- \mathbb{E}x_{-x}\bigg[ \int_0^{\eta_{-b}}{\rm{e}}^{-qt}{\mathbf{1}}_{\{U^{-b}_t >-b\}}{\rm d} t\bigg]\bigg).\end{gather*}
Now from Theorem 5(i) of [Reference Kyprianou and Loeffen11], we have (6.2). On the other hand, by Theorem 6(iii) of [Reference Kyprianou and Loeffen11], we obtain
 \begin{align}\mathbb{E}x_{-x}\bigg[\int_0^{\eta_{-b}} {\rm{e}}^{-qt}{\mathbf{1}}_{\{U^{-b}_t >-b\}}{\rm{d}}t\bigg]=\overline{\Psi}_x(b)\overline{\mathbb{W}}^{(q)}(b)-\overline{\mathbb{W}}^{(q)}(b-x).\end{align}
Hence, putting the pieces together we get (6.3).
A.8. Proof of Lemma 6.3
For  $b \in (0, x)$, we have
 $\overline{\Psi}_{x}(b)=\smash{{\rm{e}}^{-\Phi(q)x}/{\mathbb{Z}^{(\delta\Phi(q))}_{\Phi(q)}(b)}}$, which is clearly strictly decreasing.
To see that it is strictly decreasing on  $[x,\infty)$, we need to show that
 ${{\rm d}\overline{\Psi}_{x}(b)}/{{\rm d} b}<0$ on
 $ (x,\infty)$. This is satisfied if we can show that
 \begin{align}w(y_{1},y_2) >0,\qquad y_{1}<y_{2},\end{align}
where we define, with  $y_2$ fixed,
 \begin{equation}w(y,y_2)\ :\!=\dfrac{\mathbb{Z}^{(\delta\Phi(q))}_{\Phi(q)}(y)}{\mathbb{Z}^{(\delta\Phi(q))}_{\Phi(q)}(y_{2})}-\dfrac{\mathbb{W}^{(\delta\Phi(q))}_{\Phi(q)}(y)}{\mathbb{W}^{(\delta\Phi(q))}_{\Phi(q)}(y_{2})}\quad\text{for any}\ y\in\mathbb{R}.\end{equation}
Recall the change of measure addressed in Section 6.1. Because, for  $y \gt 0$,
 $$\{ {e^{ - \delta \Phi (q)(t\Lambda {\tau _{0,y}})}}{\mathbb{W}}_{\Phi (q)}^{(\delta \Phi (q))}({Y_{t\Lambda {\tau _{0,y}}}}):t \ge 0\} and\{ {e^{ - \delta \Phi (q)(t\Lambda {\tau _{0,y}})}}{\mathbb{Z}}_{\Phi (q)}^{(\delta \Phi (q))}({Y_{t\Lambda {\tau _{0,y}}}}):t \ge 0\} $$
are  $\smash{\widetilde{\mathbb{P}}^{\Phi(q)}_{x}}$-martingales (see Proposition 3 of [Reference Pistorius19]), where
 $\tau_{0,y}\ :\!=\inf\{t \gt 0\colon Y_{t}<0\ \text{or}\ Y_{t}>y\}$, it follows that
 $\{\smash{{\rm{e}}^{-\delta\Phi(q)(t\wedge\tau_{0,y_{2}})}}w(Y_{t\wedge\tau_{0,y_{2}}},y_2) \colon t\geq0\}$ is a
 $\smash{\widetilde{\mathbb{P}}^{\Phi(q)}_{x}}$-martingale. Now, taking
 $y_{1}<y_{2}$ and using the optimal stopping theorem,
 \begin{equation}w(y_{1},y_2)=\widetilde{\mathbb{E}}_{y_{1}}^{\Phi(q)}[{\rm{e}}^{-q(t\wedge\tau_{0,y_{2}})} w(Y_{t\wedge\tau_{0,y_{2}}},y_2)],\end{equation}
where  $\smash{\widetilde{\mathbb{E}}_{y_1}^{\Phi(q)}}$ is the expected value with respect to the probability measure
 $\smash{\widetilde{\mathbb{P}}^{\Phi(q)}_{y_1}}$. Noting that w is bounded (recalling that Y is spectrally negative) and taking
 $t\rightarrow \infty$, dominated convergence gives
 \begin{equation}w(y_{1},y_2)=\widetilde{\mathbb{E}}_{y_{1}}^{\Phi(q)}[{\rm{e}}^{-q\tau_{0,y_{2}}}w(Y_{\tau_{0,y_{2}}},y_2) ].\end{equation}
Now we note that the following assertions hold.
(i) If Y has paths of unbounded variation then
$\smash{\mathbb{W}^{(\delta\Phi(q))}_{\Phi(q)}(0)}=0$, and hence, $w(y,y_2)>0$ for $y\in(-\infty,0]$. On the other hand, $\smash{\widetilde{\mathbb{P}}^{\Phi(q)}_{x}(Y_{\tau_{0,y_{2}}}}\leq0)>0$.(ii) If Y has paths of bounded variation then
$w(y,y_2)>0$ for $y\in(-\infty,0)$, and


 [$${\mathbb{\tilde{P}}}_x^{\Phi \left( q \right)}\left( {{Y_{\tau 0,{y_2}}} \le 0} \right) = {\mathbb{\tilde{P}}}_x^{\Phi \left( q \right)}\left( {{Y_{\tau 0,{y_2}}} \lt 0} \right) \gt 0.$$
These facts imply that
 \begin{equation}w(y_{1},y_2)=\widetilde{\mathbb{E}}_{y_{1}}^{\Phi(q)}[{\rm{e}}^{-q\tau_{0,y_{2}}}w(Y_{\tau_{0,y_{2}}},y_2) ]\geq \widetilde{\mathbb{E}}_{y_{1}}^{\Phi(q)}[{\rm{e}}^{-q\tau_{0,y_{2}}}w(Y_{\tau_{0,y_{2}}},y_2){\mathbf{1}}_{\{Y_{\tau_{0,y_{2}}}\leq 0\}}]>0.\end{equation}
From here we conclude that  $\overline{\Psi}_{x}$ is strictly decreasing on
 $ (0,\infty)$. Finally, letting
 $b\rightarrow0$ in (6.2), it is clear that
 $\lim_{b\rightarrow0}\overline{\Psi}_{x}(b)={\rm{e}}^{-\Phi(q)x}$. On the other hand, using l’Hôpital’s rule and (3.7), we have
 \begin{align}\lim_{b\rightarrow\infty}\frac{\mathbb{Z}^{(\delta\Phi(q))}_{\Phi(q)}(b-x)}{\mathbb{Z}^{(\delta\Phi(q))}_{\Phi(q)}(b)}=\dfrac{1}{{\rm{e}}^{(\varphi(q)-\Phi(q))x}}\lim_{b\rightarrow\infty}\dfrac{{\rm{e}}^{-\varphi(q)(b-x)}\mathbb{W}^{(q)}(b-x)}{{\rm{e}}^{-\varphi(q)b}\mathbb{W}^{(q)}(b)}=\dfrac{1}{{\rm{e}}^{(\varphi(q)-\Phi(q))x}}.\end{align}
Hence,  $\lim_{b\rightarrow\infty}\overline{\Psi}_{x}(b)=\smash{{\rm{e}}^{-\varphi(q)x}}$.
Acknowledgements
Mauricio Junca was supported by Universidad de los Andes under the Grant Fondo de Apoyo a Profesores Asistentes (FAPA). Harold A. Moreno-Franco was supported by the Russian Academic Excellence Project ’5-100’. José Luis Pérez was supported by CONACYT, under project number 241195. Kazutoshi Yamazaki was supported by MEXT KAKENHI, under grant number 17K05377.