INTRODUCTION
For fish ecologists recruitment, in general, is defined as the number of individuals which survive from the eggs to a certain age or stage in their life history (Carr & Sims, Reference Carr, Sims, Allen, Pondella and Horn2006). In the present work recruitment is defined as the completion of settlement of pelagic larvae and return of the early juveniles to the adult spawning grounds. Early life history traits, such as duration of the planktonic larval stage and size-at-settlement, are closely linked to the fish recruitment success (Chambers & Leggett, Reference Chambers and Leggett1987; McCormick, Reference McCormick1994; Radtke et al., Reference Radtke, Kinzie and Shaffer2001). These variables reflect the interaction of the individual's developmental physiology with exogenous factors (e.g. food and temperature) (McCormick, Reference McCormick1994). Temperature, in particular, causes variation in rates of fish development in the embryonic, larval and juvenile stages (Green & Fisher, Reference Green and Fisher2004). A decrease in the rate of ontogenetic development caused by a change in temperature usually results in a longer pelagic larval duration, increasing the exposure to the high-risk pelagic larval environment (Atkinson, Reference Atkinson, Johnston and Bennett1996). Moreover, through its effect on growth, temperature can influence the size of the organism at which ontogenetic transformations occur (Green & Fisher, Reference Green and Fisher2004), which may determine the fish's subsequent growth schedules and survival (McCormick & Molony, Reference McCormick and Molony1995).
Several studies have suggested that the pelagic larval duration seem to be a flexible early life history trait in both littoral and demersal fishes (McCormick, Reference McCormick1999; Sponaugle et al., Reference Sponaugle, Grorud-Colvert and Pinkard2006; Kendall et al., Reference Kendall, Poti, Wynne, Kinlan and Bauer2013). However studies on the conservative or flexible pattern of the size at settlement in fish are, at present, scarce (Juncker et al., Reference Juncker, Wantiez and Ponto2006). The shanny Lipophrys pholis (L. 1758) can be easily used as a fish model to understand connectivity of marine populations, to monitor dispersal in planktonic larvae and to study recruitment processes. It is an intertidal blenniid fish usually found in NE Atlantic and Mediterranean Sea shores (Zander, Reference Zander, Whitehead, Bauchot, Hureau, Nielsen and Tortonese1986; Almada et al., Reference Almada, Oliveira, Gonçalves, Almeida, Santos and Wirtz2001). In Great Britain, L. pholis breeds during spring and early summer (Milton, Reference Milton1983), while in Portugal it occurs in the cooler months, from October/November to May (Faria et al., Reference Faria, Almada and Gonçalves1996). At higher latitudes the reproductive season tends to start later and to end sooner, when conditions become favourable for larval dispersion and juvenile growth; while in low latitudes L. pholis has a protracted breeding and recruitment season (Conover, Reference Conover1992). The reproductive season should end when the time available is not enough for late-born juveniles to grow and reach the minimal size to survive during the winter (Conover, Reference Conover1992). In Portugal, the early juveniles can grow almost without interruption during the warmer months and those which recruit in early winter are able to reach the minimum size to be sexually mature within 1 year (Faria et al., Reference Faria, Almada and Gonçalves1996). During the breeding period the males establish territories in crevices and stones where spawning takes place (Qasim, Reference Qasim1957; Dunne, Reference Dunne1977; Almada et al., Reference Almada, Barata, Gonçalves and Oliveira1990). The nests contain 3–8 batches of eggs from a single or multiple females deposited at different times during the course of a breeding season (Qasim, Reference Qasim1957). It is also known that L. pholis males are capable of multiple spawning episodes (Ferreira et al., Reference Ferreira, Santos, Reis-Henriques, Vieira and Monteiro2011). According to captive experiments embryonic development lasts 16 days at 17°C (Faria et al., Reference Faria, Borges, Gil, Almada and Gonçalves2002). After hatching the pelagic larvae disperse to the coastal area and individuals apparently return to a particular set of rock tide pools, 2–3 months later, in early winter to settle (Faria et al., Reference Faria, Almada and Gonçalves1996). Recent findings show that L. pholis adults can orient themselves toward their home pools, suggesting that homing abilities may begin with the onset of sexual maturation and not during a hypothetical imprinting phase during larval development, such as other marine species (Jorge et al., Reference Jorge, Almada, Gonçalves, Duarte-Coelho and Almada2012). After metamorphosis and settlement, characterized by pronounced morphological and physiological changes, early juveniles (15–16 mm) show a typical behaviour associated with a benthic mode of life (Qasim, Reference Qasim1957; Faria & Almada, Reference Faria and Almada2001; Faria et al., Reference Faria, Borges, Gil, Almada and Gonçalves2002). Recruitment of fishes <20 mm ceases 3 months after the end of the breeding season (Faria et al., Reference Faria, Almada and Gonçalves1996). Information regarding the temporal occurrence in the wild of these early life history events is nonexistent, because available data have been obtained through captive experiments.
This paper examines, for the first time, some life history traits of L. pholis, such as duration of the pelagic larval stage, size at settlement and age at coastal recruitment, inferred from the otolith microstructure of early recruits. The effect of the lunar cycle on the timing of these early life history traits is also explored. This information jointly with the historical collection data from surface seawater temperatures form the basis of a discussion about the larval growth, settlement and juvenile recruitment mechanisms for this species.
MATERIALS AND METHODS
Biological sampling
One hundred and ten recruits (young juveniles ≤ 30 mm) were collected in April and May 2013 in four rocky beaches equally spaced (~300 km) along the Portuguese coast from north to south (Cabo do Mundo: 41°13′N 8°42′W; Peniche: 39°26′N 9°13′W; Vale do Homem: 37°22′N 8°49′W; and Olhos de Água: 37°05′N 8°11′W) (Table 1; Figure 1). Individuals were captured with hand-nets in rocky pools during the low-tide periods. For each site individuals were collected from three tide pools (replicates) spaced at about 50 m apart. Fish were kept in seawater cooled with ice, rapidly transported to the laboratory and killed with a lethal dose of 2-phenoxyethanol. All fishes were measured (total length: TL, 0.1 mm), distributed by size classes (at intervals of 1 mm) and frozen (−20°C) in Eppendorf tubes filled with seawater prior to further analysis.
Lipophrys pholis sampling regions (black dots) and SST buoy positions (open dots) along the Portuguese coast.

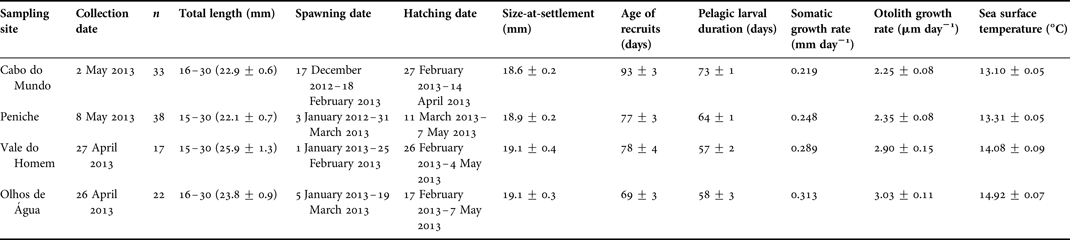
Sampling location, collection date, fish length, spawning and hatching dates, size at settlement, age of recruits, pelagic larval duration, somatic growth rate, otolith growth rate and individual sea surface temperatures for Lipophrys pholis used in this study. Data were present as mean ± SE.

Otolith microstructural analysis
Sagittal otoliths were carefully extracted from the otic cavity of fishes using a binocular microscope and cleaned of adherent tissues with ultrapure water (Milli-Q-Water). Left otoliths were mounted on microscope glass slides with the sulcus acusticus down using a drop of epoxy resin (Buehler, EpoThin). The otoliths were manually ground in the sagittal plane with silicon carbide paper (Hermes, 2500) and polished with alumina paste (Struers, AP Paste) to expose the core. Whole otoliths were photographed in a light microscope (Olympus, CX41) coupled to a USB digital camera (Olympus, SC30) at 200× and 400× magnifications. Images were acquired using a computer program (Olympus, AnalySIS getIT). If needed, successive series of microphotographs from each otolith were made to obtain a complete image of the otolith radius. The quality of the digital images was improved using a free software program (Paint.NET v3.5.10). The diameter and radius of otoliths were measured (μm) in their longest axis using a free software program (Olympus, MeasureIT). To back-calculate the spawning time, 16 days were added to the counted micro-increments, which corresponds to the number of days before hatching (i.e. embryonic period) (Faria et al., Reference Faria, Borges, Gil, Almada and Gonçalves2002). It was also assumed that the first micro-increment represents the hatching check as observed in other related species (Raventós & Macpherson, Reference Raventós and Macpherson2001). The micro-increments in sagittae are deposited on a daily basis in early juveniles of this species (Carvalho et al., Reference Carvalho, Moreira, Moreira, Queiroga, Santos and Correia2014). Pelagic larval duration was estimated by counting the daily rings from the hatch check until the settlement marks (McCormick, Reference McCormick1994). Settlement marks in the otoliths were visually identified using the optical density transitions and the abrupt change in increment width(s) (McCormick, Reference McCormick1994). The formation of the settlement marks was recently validated for this species and occur at the transition from the pelagic to the benthic environment in new settled fish (Carvalho et al., Reference Carvalho, Moreira, Moreira, Queiroga, Santos and Correia2015). The number of micro-increments was blind counted by three independent readers and average values were used. Otoliths in which the coefficient of variation was higher than 10% were rejected. The averages of every 10 successive increment widths from the hatch check to the otolith edge were used for otolith growth-increment analysis.
Sea surface temperatures
Sea surface temperature varies on multiple temporal and spatial scales along the Portuguese coast (Lemos & Sansó, Reference Lemos and Sansó2006). The mean daily sea surface temperature experienced by each fish during the pelagic larval duration was retrospectively estimated taking into account the date estimated from otolith microstructure (i.e. period of time from the hatching check until the settlement marks) overlapped with the available historical data of the sea surface temperature from the Portuguese coast. The sea surface temperature data were obtained from floating Datawell coastal buoys of the Instituto Hidrográfico da Marinha Portuguesa located nearest the L. pholis sampling points and anchored near the 100 m bathymetry (Leixões CSA92/D: WGS 84 – 41°19′N 8°59′W, depth: 83 m; Nazaré CSA88/1D: WGS 84 – 39°33′N 9°12′W, depth: 88 m ; Sines CSA83/1D: WGS 84 – 37°55′N 8°55.73′W, depth: 97 m; and Faro CSA82/D: WGS 84 – 36°54′N 7°53′W, depth: 93 m) (Table 1; Figure 1). It was also assumed that L. pholis larvae may be locally retained within the coastal environment since rocky intertidal fish larvae appear to be able to avoid off-shore dispersal (Marliave, Reference Marliave1986).
Data analysis
All data were normally distributed (Shapiro–Wilk's test) with equal variance (Levene's test) after log10 transformation. One-way analysis of variance (ANOVA) was used to explore the mean differences in pelagic larval duration, size at settlement and age of the recruits between locations (factor), followed by a Tukey post hoc test, if needed. Linear regression analyses were used to examine the relationships between pelagic larval duration and sea surface temperature, and between otolith measurements (otolith diameter and radius) and total length (TL) of recruits. The somatic growth rates obtained from the slopes of the linear regressions between TL and age of the recruits for each site were used to retrospectively estimate the individual size at settlement. One-way analysis of co-variance (ANCOVA) was used to compare the regional somatic growth rates. The age of the recruits was used to back calculate the spawning, hatching and settlement dates (identified through the settlement marks) for each fish. The distribution of these activities over the lunar cycle was also estimated for each individual. The duration of lunar cycle was considered 29.53 days, the new moon was set as the first day of the lunar calendar and each lunar phase was encompassed by the day of each quarter phase ±3 days (Sponaugle & Pinkard, Reference Sponaugle and Pinkard2004). Rayleigh circular statistics were used to test for the occurrence of nonrandom distribution of these activities through the moon cycle (Batschelet, Reference Batschelet1981). All analyses were performed according to standard statistical procedures (Zar, Reference Zar1996). A level of significance (α) of 0.05 was used. Data were presented as mean values±standard error (SE).
RESULTS
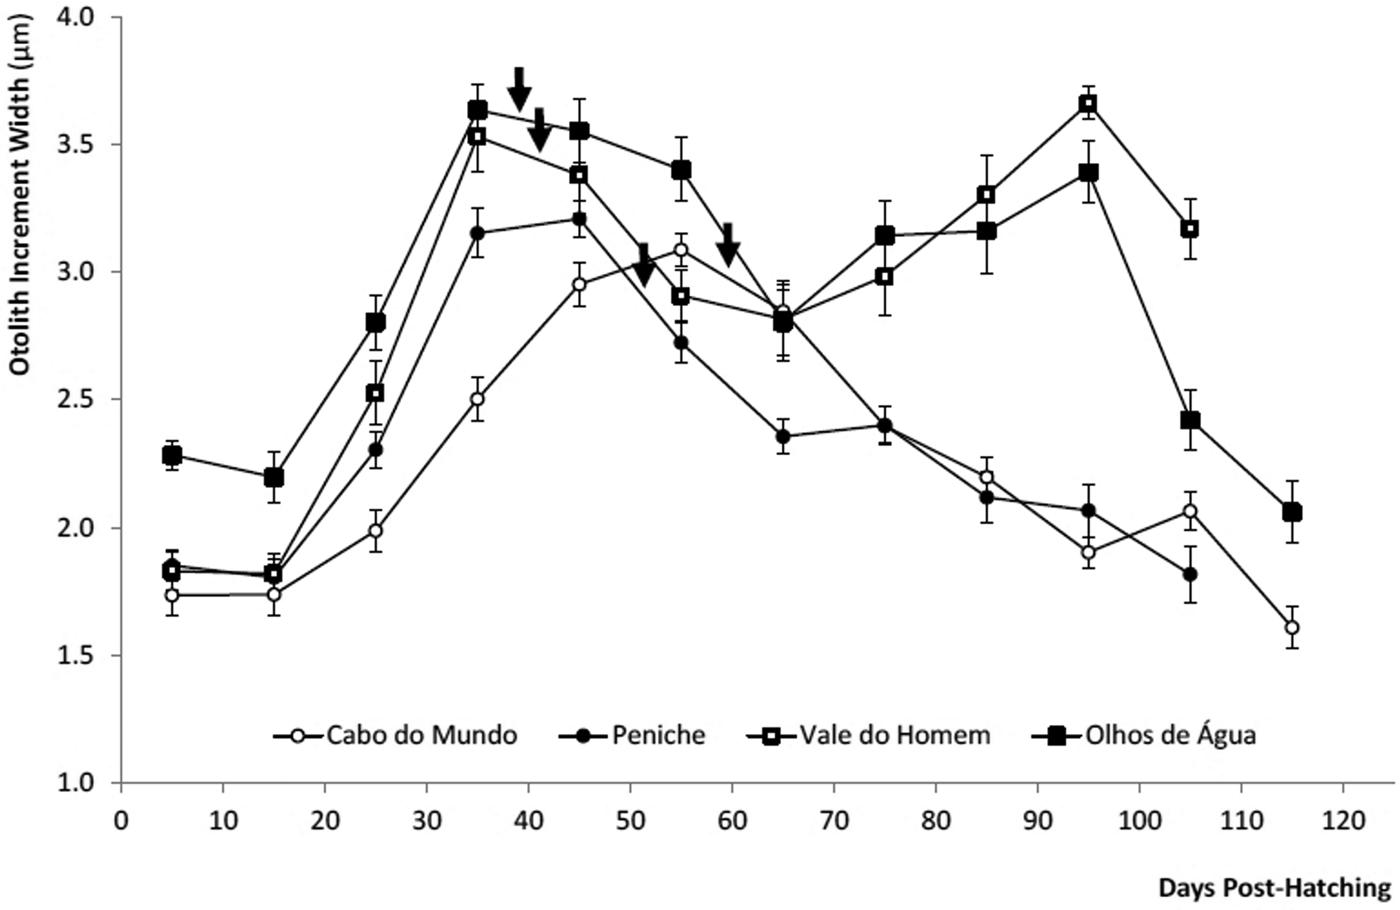
Micro-increments were clearly visible between the hatching check and the otolith edge. Two different otolith increment width profiles were observed along the radius of sagittae. A regular increase of the increment width was observed from the hatch check to the following 35 to 55 days (3.0–3.5 µm) for all individuals/sites. Afterwards there was a decrease of the increment width that reached the initial value (1.5 µm) at the otolith edge (110 to 120/130 days) for the northern individuals. For the southern individuals after this initial decrease until the 65 days, there was a steady increase in the increment width through the otolith radius with a final drop in the otolith edge. The visual analysis of the plot showed an abrupt increase of the width of increments that took place in the zone where the settlement occurred (40 to 55 days post-hatching) (Figure 2).
Profile of the micro-increments width (mean values ± standard errors) from the hatch check to the otolith edge. The individuals captured were grouped according to the sampling regions. The settlement mark formation was also identified (black arrows).

The settlement marks appeared to be of two different types (Figure 3). A sharp decrease in increment width across the settlement mark completed within a few increments was categorized type Ia and a multi-increment transition mark was categorized type Ib. These two settlement marks were observed in 62% and 38% of the individuals, respectively.
Light microscope images of two otoliths of Lipophrys pholis individuals collected in Cabo do Mundo (A: TL = 21 mm; age = 84 days; C: TL = 23 mm; age = 100 days) showing in a zoomed selected area (white boxes) the type Ia (B) and Ib (D) settlement marks (white arrows). 200× magnification. Scale bar = 10 µm.

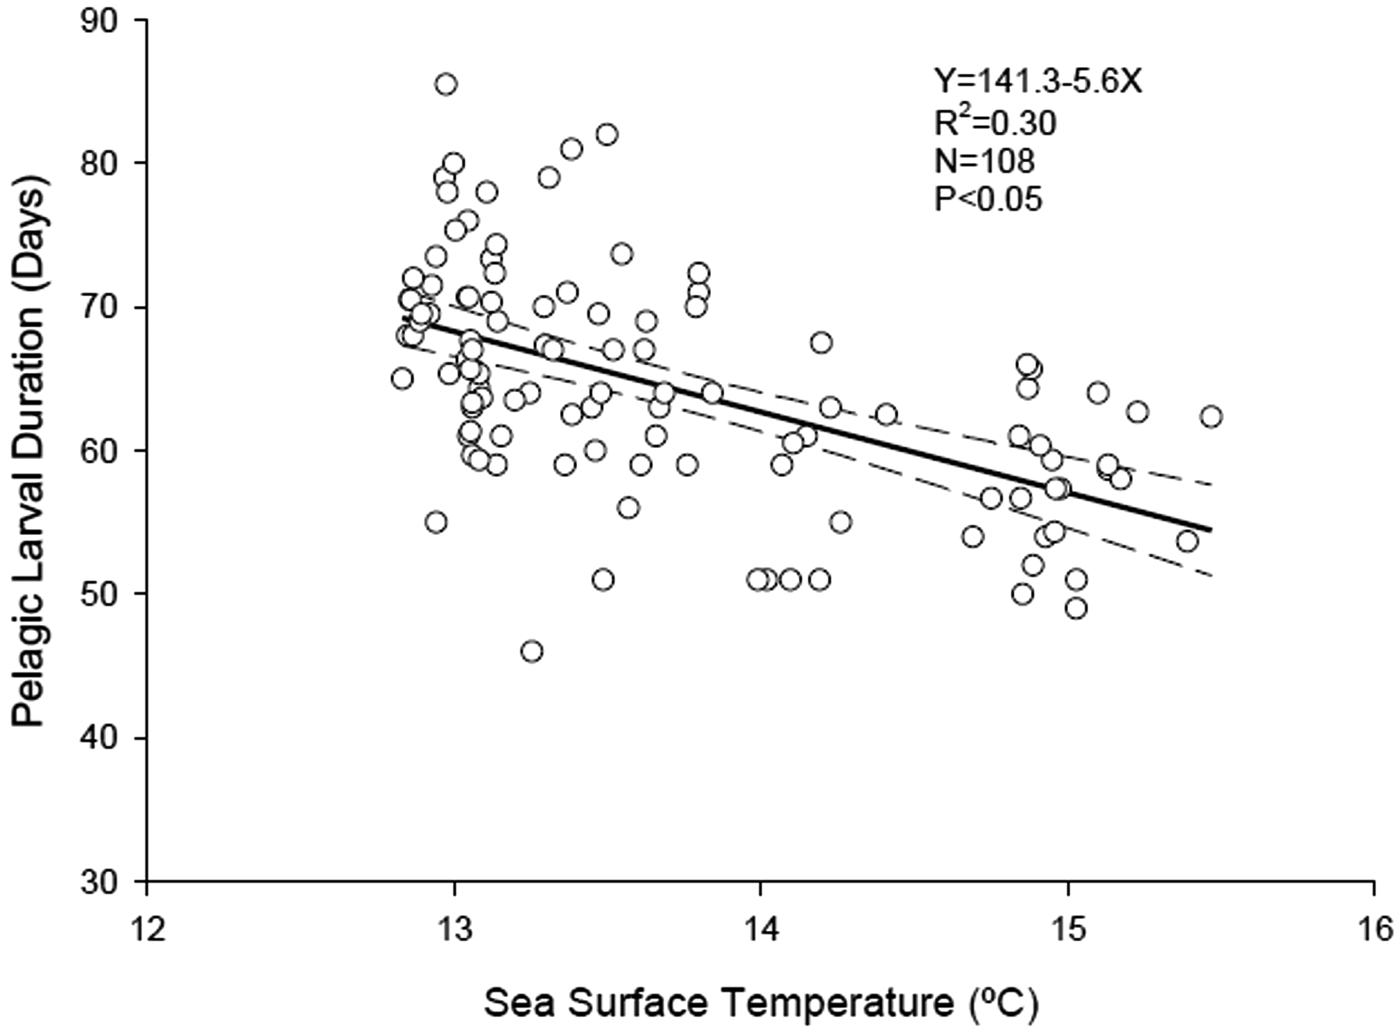
There were significant differences in the pelagic larval duration of L. pholis between sampling regions (ANOVA: F 3,106 = 61.999, P < 0.05), except for the two southern locations (Tukey test, P > 0.05). There was however a general shortening of the pelagic larval duration from north to south (Cabo do Mundo: 73 ± 1 days; Peniche: 64 ± 1 days; Vale do Homem: 57 ± 2 days; Olhos de Água: 58 ± 3 days) (Table 1). The overall PLD was 64.4 ± 0.8 days (coefficient of variation of 12.4%). The variation of the pelagic larval duration could be explained in 30% by the sea surface temperature (Figure 4).
Relationship between the pelagic larval duration and the average surface seawater temperature experienced by each individual over the period between hatch and settlement. The dotted lines represent the 95% interval for the linear regression.

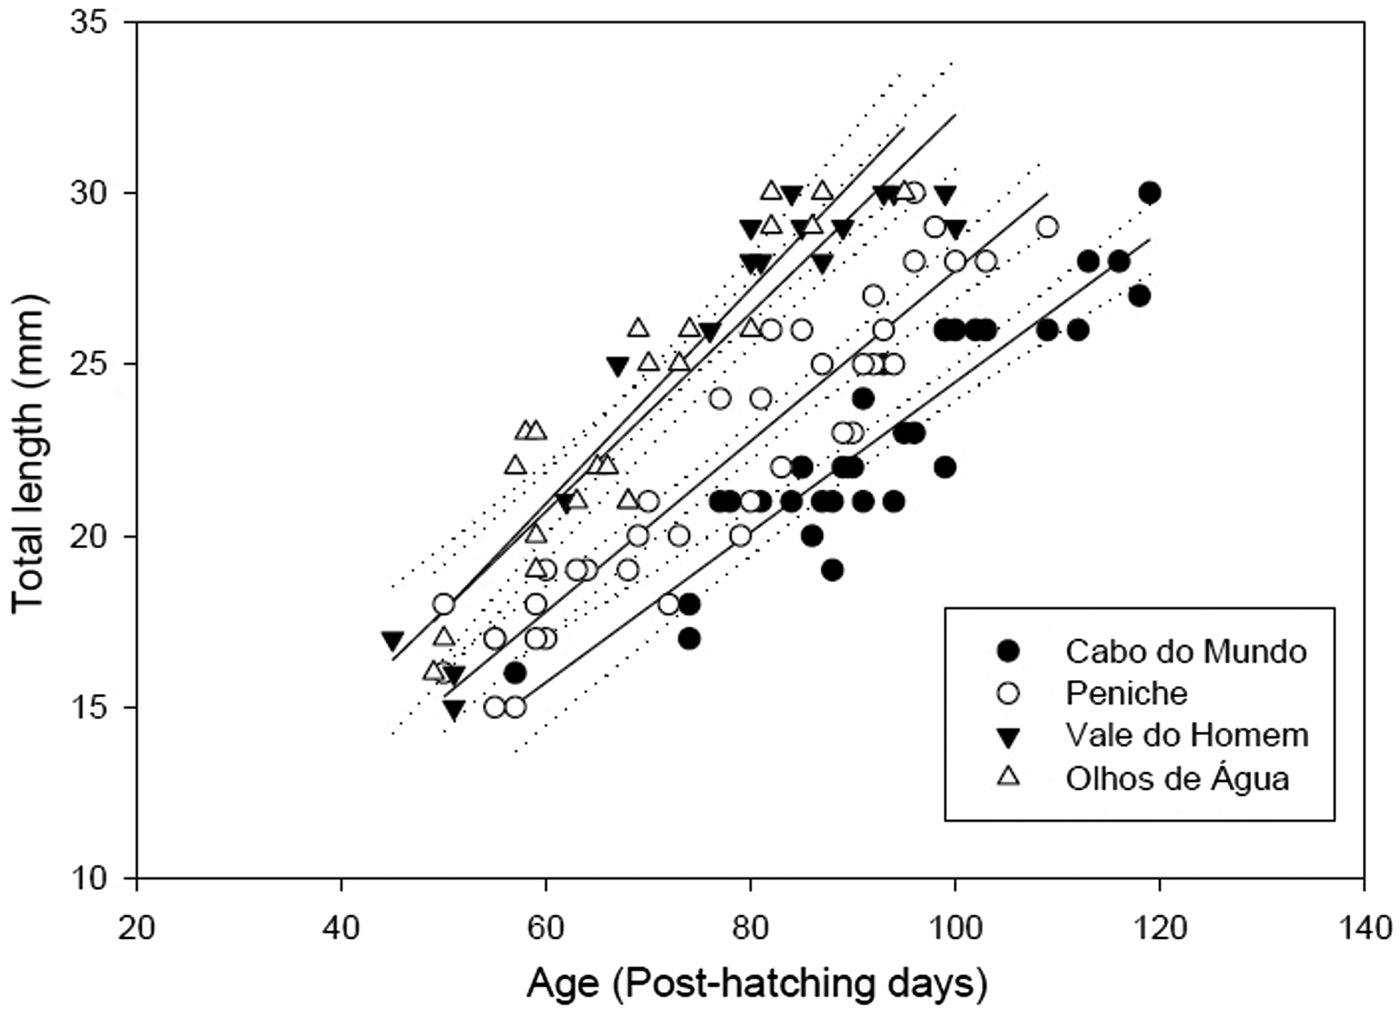
The overall otolith radius and diameter ranged from 138 to 323 µm and from 263 to 588 µm, respectively. A positive significant correlation was found between the otolith measurements and the fish length (otolith radius: Y = 9.56X + 19.38, R 2 = 0.82, N = 110, P < 0.05; otolith diameter: Y = 17.99X + 39.90, R 2 = 0.86, N = 110, P < 0.05). A significant positive relationship was also found between fish length and age of the recruits for all the sampling sites (Cabo do Mundo: Y = 0.22X + 2.60, R 2 = 0.83, N = 33, P < 0.05; Peniche: Y = 0.25X + 2.87, R 2 = 0.88, N = 38, P < 0.05; Vale do Homem: Y = 0.29X + 2.37, R 2 = 0.88, N = 17, P < 0.05; and Olhos de Água: Y = 0.31X + 2.16, R 2 = 0.85, N = 22, P < 0.05) (Figure 5). The size at settlement was estimated for each individual, but did not present any significant regional differences (ANOVA: F 3,103 = 2.595, P = 0.057) (Table 1). The average size at settlement was 18.9 ± 0.1 mm (coefficient of variation was 5.9%). All fishes settled between 18 and 20 mm long.
Linear relationships between length and age at capture for the recruits for each sampling region. The dotted lines represent the 95% intervals for the linear regressions.

The age determination of the recruits from L. pholis captured at Cabo do Mundo, Peniche, Vale do Homem and Olhos de Água ranged from 57 to 119 days, 50 to 109 days, 45 to 100 days and 49 to 95 days, respectively. There were significant differences in the age of the recruits of L. pholis between sampling regions (ANOVA: F 3,106 = 12.769, P < 0.05), with the north location recording the older individuals (Tukey – test, P < 0.05) (Table 1). Significant differences exist between regional somatic growth rates (ANCOVA: F 3,105 = 3.35, P = 0.02), except for the two southern regions (ANCOVA: F 1,36 = 0.36, P = 0.55) (Table 1).
The observed frequency dates for the spawning, hatching and settlement of L. pholis (Table 1) showed that these biological events occurred during all phases of the lunar cycle, and none of these activities was related with a particular phase of the moon (Rayleigh Tests: P > 0.05).
DISCUSSION
As expected, both otolith morphometric measures showed a good relationship with fish length (TL) (Searcy & Sponaugle, Reference Searcy and Sponaugle2001). Furthermore, two settlement mark types were identified, Ia and Ib, both characterized by a sharp decrease in the increment width and completed within a few micro-increments (Wilson & McCormick, Reference Wilson and McCormick1999). These settlement marks have already been identified among individuals belonging to Gobiidae, Gobiesocidae and Blenniidae families (Beldade et al., Reference Beldade, Pedro and Gonçalves2007), and occur in the peripheral region of the otoliths of L. pholis early settlers (Carvalho et al., Reference Carvalho, Moreira, Moreira, Queiroga, Santos and Correia2015). The present results indicate that the most common settlement mark for L. pholis was type Ia with 62% of frequency. Settlement mark types are known to vary among species, even within the same genus (Wilson & McCormick, Reference Wilson and McCormick1999). In some cases (e.g. Gobius xanthocephalus or Gobius paganellus), such as in the present study, two subtypes of settlement marks could even be present within the same species (Beldade et al., Reference Beldade, Pedro and Gonçalves2007). Mark type Ia also seems be the most common settlement mark in more than 40 tropical species (Sponaugle & Cowen, Reference Sponaugle and Cowen1994), and appears also to occur in 68% of Mediterranean littoral fishes, including individuals belonging to Lipophrys genera, i.e. L. adriaticus, L. canevae and L. trigloides (Raventós & Macpherson, Reference Raventós and Macpherson2001). The structure of the settlement marks is species-specific, but dramatic reductions in increment width at settlement (i.e. individuals with type I settlement-marks) are related to fish in which the timing of settlement differs slightly among individuals due to the influence of the environmental history on the developing larvae (Wilson & McCormick, Reference Wilson and McCormick1999). It is plausible that these settlement marks reflect L. pholis individuals that settled successfully (type Ia) or individuals that settled in an unsuitable (or occupied) habitat and then moved before settling again (type Ib).
The estimate of the larval duration from otolith microstructure of L. pholis revealed a latitudinal pattern, i.e. a general shortening of the pelagic larval duration from north to south regions. It is well known that variation in pelagic larval duration may result from various environmental factors such as temperature, food availability and local current patterns (Jones, Reference Jones1986; Lobel & Robinson, Reference Lobel and Robinson1986; McCormick & Molony, Reference McCormick and Molony1995). In the present study the shorter pelagic larval duration occurred in the regions with warmer seawater temperatures (Vale do Homem and Olhos de Água); in contrast, the longest pelagic larval duration occurred in Cabo do Mundo, the region with the coldest seawater. Furthermore, 30% of the variation in pelagic larval duration was explained by individual mean temperatures experienced by larvae calculated from local sea surface temperature. These results corroborate that temperature is a dominant influence on pelagic larval duration, which decreases exponentially with increasing temperatures across species and populations of marine fish (McCormick & Molony, Reference McCormick and Molony1995; Benoît et al., Reference Benoît, Pepin and Brown2000; Green & Fisher, Reference Green and Fisher2004). Results obtained for other tropical reef fish also reported that seawater temperature changes accounted for about 30% of the variation in larval growth (McCormick & Molony, Reference McCormick and Molony1995; Meekan et al., Reference Meekan, Carleton, McKinnon, Flynn and Furnas2003; Sponaugle et al., Reference Sponaugle, Grorud-Colvert and Pinkard2006). Moreover, the effect of water temperature on larval growth leads to important environmental effects on the recruitment success (Sponaugle, Reference Sponaugle2010).
Daily growth for a fish can be indirectly obtained by examining the width between successive increments in otoliths. The comparison of increment widths during a particular stage of life among individuals could provide a relative measure of somatic growth (Green et al., Reference Green, Mapstone, Carlos and Begg2009). Otolith increment widths recorded in L. pholis are consistent with the values reported for other related fish families (Wilson & McCormick, Reference Wilson and McCormick1999). Moreover, micro-increment widths measured in L. pholis otoliths showed a regional variation and sites with higher sea surface temperatures had higher otolith growth rates, which is particularly evident in the peripheral rings. The effect of environmental factors in the daily growth pattern of otoliths during the fish's early life stages have been extensively studied using time-series data analysis (Maillet & Checkley, Reference Maillet and Checkley1991; May & Jenkins, Reference May and Jenkins1992; Searcy & Sponaugle, Reference Searcy and Sponaugle2001), and it is generally accepted that there is a positive relationship between otolith growth rate and temperature (Campana & Neilson, Reference Campana and Neilson1985). Observations, both in the field and in the laboratory, have shown that micro-increment width may change in response to temperature and diet, although the period of micro-increment deposition remained daily (Morales-Nin, Reference Morales-Nin2000). Recently a field study showed that for fish larvae (Sprattus sprattus), otolith width increments could be closely related with in situ water daily temperatures (Baumann et al., Reference Baumann, Hinrichsen, Voss, Stepputtis, Grygiel, Clausen and Temming2006). These results are, as expected, coincident with the somatic growth rate which was positively related with temperature, and northern fish presented a slow somatic growth compared with the most southern individuals.
The size at settlement of L. pholis appears to be, however, a conservative characteristic in this species. No significant differences were observed in the size at settlement for the sampling areas. Fish settled when around 19 mm long. These results are in agreement with regular field observations of the smallest fish found in tide pools which are on average 17.4 mm and behave like benthic juveniles (Faria et al., Reference Faria, Borges, Gil, Almada and Gonçalves2002). Furthermore, it suggests that fish need to reach a minimum size to begin the settlement process. This could easily explain why southern fish settled earlier than northern individuals. If settlement is triggered by a minimum size, fish with lower growth rates should reach this minimum size later. In general the variation in size is less than variation in age at metamorphosis for marine fish and the required size may ameliorate competitive effects and reduce the risk of predation in the period immediately following metamorphosis and settlement (Chambers & Leggett, Reference Chambers and Leggett1987). This agrees with the ‘competent size’ hypothesis which defends the idea that a flexible pelagic larval duration is needed to maximize competent size, because environmental conditions may change within a season and among years (Pastén et al., Reference Pastén, Katayama and Omori2003). As L. pholis individuals need to reach a certain size to settle it can be hypothesized that in northern and colder waters the pelagic larval duration should be long and the settlement success therefore limited compared with further south. It means that the survival to the larval stage driven by water temperature could be an explanatory factor of the overall geographic distribution of the species.
It is known that various life history events for fish species that inhabit temperate and higher latitudes are often synchronized with periodic changes according to the moon-related cycles (Takemura et al., Reference Takemura, Rahman and Park2010). In this study, the examination of spawning, hatching and settlement dates of L. pholis surviving individuals suggests that these biological events were apparently acyclic and continuous over the lunar cycle. Similar results were described for the spawning of Ophioblennius steindachneri (Robertson et al., Reference Robertson, Petersen and Brawn1990) and Thalassonma bifasciatum (Sponaugle & Pinkard, Reference Sponaugle and Pinkard2004; Sponaugle et al., Reference Sponaugle, Grorud-Colvert and Pinkard2006). Furthermore for Sebastes inermis the parturition dates were uniform within years over the lunar cycles in almost all settlement groups (Pastén et al., Reference Pastén, Katayama and Omori2003). These results are consistent with previous reproductive studies for L. pholis which showed that it is an asynchronous spawner, with eggs being produced in several batches during the breeding season (Ferreira et al., Reference Ferreira, Santos, Reis-Henriques, Vieira and Monteiro2012). It is possible that the asynchronous production of multiple batches function as a bet hedging strategy, allowing the eggs to be distributed among several males, thus reducing the risks of complete loss of progeny because of inadequate mate choice, environmental constraints and failure in larval recruitment, among other equally valid causes (Morrongiello et al., Reference Morrongiello, Bond, Crook and Wong2012). Regarding hatching and settlement events, both were also randomly distributed over the lunar cycle. Settlement patterns scattered throughout the lunar cycle have not been documented for any other species. For the gobidae Coryphopterus glaucofraenum for instance, settlement appears to occur in several large pulses associated with various lunar phases (Sponaugle & Cowen, Reference Sponaugle and Cowen1994). A plausible explanation can be supported by the fact that flexible pelagic larval duration in L. pholis may enable larvae to synchronize settlement to optimal environmental conditions (Sponaugle & Cowen, Reference Sponaugle and Cowen1994).
In summary, this study found significant regional biological differences in pelagic larval duration and somatic growth rate of L. pholis showing a latitudinal pattern along a moderate (1.8°C) sea surface temperature gradient. A consistent size at settlement was found in all sampled sites which emphasizes the fact that fish need to reach a minimum size to begin to settle. Longer planktonic periods in northern waters than in southern waters suggest that slow-growing juveniles remain in the plankton until they reach appropriate size, perhaps in response to environmental conditions, namely due to sea water temperature exposure. However, given the small dataset and a few uncertainties of some methodological aspects of the present approach, these results should be interpreted with caution. More information about the movement patterns, population structure and habitat connectivity in L. pholis is needed in order to improve the scientific knowledge about this species.
FINANCIAL SUPPORT
This research was supported by the European Regional Development Fund (ERDF) through the COMPETE – Operational Competitiveness Program and by national funds through FCT – Foundation for Science and Technology, under the projects ‘PEst-C/MAR/LA0015/2013 and PTDC/BIA-BIC/120483/2010’.