Introduction
Earthworms are important members of the soil macrofauna, altering the biological activity and physical structure of soils through their burrowing and casting and, therefore, contributing to a wide range of nutrient cycling and geochemical processes in soils (Brown et al., Reference Brown, Barois and Lavelle2000; Görres et al., Reference Görres, Savin and Amador2001; Brown & Doube, Reference Brown, Doube and Edwards2004). When earthworms ingest soil and litter, they incorporate a variety of microorganisms which not only serve as additional food source for the earthworms but also assist organic matter breakdown by contributing degrading enzymes (Curry & Schmidt, Reference Curry and Schmidt2007). It is supposed that earthworms even form a kind of mutualistic relationship with the microorganisms passing through their intestinal tract, and some microbial processes are advanced during the gut passage (Drake et al., Reference Drake, Schramm, Horn, König and Varma2006). However, the structure and function of the microbiota inhabiting the digestive tract is still poorly understood (Sampedro & Whalen, Reference Sampedro and Whalen2007).
Earlier studies, which dealt with the effect of gut passage on microorganisms, were mostly based on classical cultivation methods (Karsten & Drake, Reference Karsten and Drake1995, Reference Karsten and Drake1997; Krištůfek et al., Reference Krištůfek, Ravasz and Pižl1993; Pedersen & Hendriksen, Reference Pedersen and Hendriksen1993), excluding the larger part of non-cultivable microorganisms from the analysis. More recently, molecular tools have been applied in order to get an insight into the non-cultivable fraction of the gut microbiota (Cai et al., Reference Cai, Zarda, Mattison, Schönholzer and Hahn2002; Furlong et al., Reference Furlong, Singleton, Coleman and Whitman2002; Schönholzer et al., Reference Schönholzer, Hahn, Zarda and Zeyer2002; Singleton et al., Reference Singleton, Hendrix, Coleman and Whitman2003; Egert et al., Reference Egert, Marhan, Wagner, Scheu and Friedrich2004). For a rapid and simultaneous analysis of multiple samples, molecular fingerprinting techniques, such as denaturing gradient gel electrophoresis (DGGE: Muyzer et al., Reference Muyzer, de Waal and Uitterlinden1993), terminal restriction fragment length polymorphism (T-RFLP: Liu et al., Reference Liu, Marsh, Cheng and Forney1997) or single strand conformation polymorphism (SSCP: Schwieger & Tebbe, Reference Schwieger and Tebbe1998) are frequently used tools in microbial ecology.
In this study, DGGE was applied to analyse the effect of different feeding conditions on the community structure of the gut microbiota of L. rubellus. Although DGGE has widely been used to study the microbial composition of a variety of different habitats including the gut microflora of humans (Vanhoutte et al., Reference Vanhoutte, Huys, De Brandt and Swings2004), pigs (Simpson et al., Reference Simpson, McCracken, White, Gaskins and Mackie1999), wasps (Reeson et al., Reference Reeson, Jankovic, Kasper, Rogers and Austin2003) or termites (Tanaka et al., Reference Tanaka, Aoyagi, Shina, Dodo, Yoshimura, Nakamura and Uchiyama2006), it has, to our knowledge, not yet been applied for investigating the gut microbiota of Lumbricus spp. By using universal bacterial and fungal primer sets as well as specific primers targeting ammonia-oxidising bacteria (AOB) and Streptomycetes, a general overview about the structural composition of the gut microbiota is combined with a more detailed analysis of these two ecologically important bacterial groups. Ammonia oxidation by autotrophic AOB is a key process in agricultural and natural ecosystems and plays an essential role in the global nitrogen cycle (Kowalchuk & Stephen, Reference Kowalchuk and Stephen2001). Streptomycetes are known to be important biodegraders in soils, especially in respect to recalcitrant substances, as they are able to produce a variety of enzymes (Williamson et al., Reference Williamson, Brian and Wellington2000).
Three food sources, differing in their nutrient quality and palatability, were chosen for the feeding experiment. Horse dung, as pre-decomposed organic material, is a highly attractive food source for earthworms, as it contains labile organic matter that is easily available for the earthworm (Lowe & Butt, Reference Lowe and Butt2005; Marhan & Scheu, Reference Marhan and Scheu2005). Grasses tend to produce high-quality, nutrient-rich litter, while ericaceous plants, such as Vaccinium gaultheroides, produce low-quality, recalcitrant litter (Chapman et al., Reference Chapman, Langley, Hart and Koch2006). The chemical composition of the organic material directly affects the structure of its inhabiting microbiota (Bardgett et al., Reference Bardgett, Wardle and Yea1998). The microbial community composition of the earthworm gut was, thus, examined to reveal whether its microflora, as represented by rDNA types, is primarily indigenous or primarily derived from the food ingested.
Materials and methods
Feeding experiment
Earthworms and soil were collected manually in April 2006 from a garden site near Innsbruck, Austria, and immediately transported to the laboratory. For the feeding experiment, three plastic boxes (495×380×250 mm) were filled with a 1:2 mixture of an alpine soil (C-content: 3.45%, N-content: 0.24%) and a standard soil (soil type 2.3; Lufa, Speyer, Germany) to a final volume of 15 l. Subsequently, air-dried dwarf shrub litter (Vaccinium gaultherioides), grass litter (Luzula sp.) or horse dung was mixed to the soil to provide additional organic substrate. Four Lumbricus rubellus Hoffmeister (Lumbricidae; Oligochaeta) specimens were transferred to each of the plastic boxes, which were incubated in a climate chamber at 12°C. During incubation, fresh substrate was added regularly to provide the earthworms with sufficient food, but prevent the substrate from moulding. After six weeks of incubation, samples of the soil were taken at five randomly selected spots per box with a sterile spatula. Subsequently, all the samples from the same box were merged and properly mixed before DNA extraction. Earthworms were sedated, surface sterilized with ethanol (70%) and dissected under sterile conditions. The whole gut content of each specimen without gut wall was extracted with a small sterile spatula and directly transferred into sterile 1.5 ml microcentrifugation tubes. Each gut sample was separately used for DNA extraction in order to obtain four independent DNA extracts per treatment.
DNA extraction
DNA extraction from the Lumbricus rubellus guts and the bulk soil was performed using the PowerSoil DNA Isolation Kit (MoBio Laboratories Inc., Carlsbad, USA) according to the manufacturer's protocol, with the following modifications to improve DNA yield but reduce shearing of large fragments: after an abbreviated bead beating step (5 min), samples were frozen at −80°C for 1 h and thawed in a water bath at 37°C for 30 min. This freezing-thawing step was repeated once, before continuing with the regular protocol. DNA yield and quality was assessed by 1.0% (w/v) agarose gel electrophoresis, followed by DNA concentration measurements using PicoGreen dsDNA quantitation reagent (Invitrogen, Carlsbad, USA) (Juen & Traugott, Reference Juen and Traugott2005).
PCR amplification of target DNA
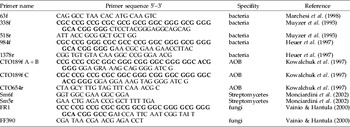
Extracted DNA was amplified in a PCR thermocycler (PCR Express, ThermoHybaid) with different primer sets. Primer sequences and references are listed in table 1. Each PCR mixture contained 0.5 ng of extracted DNA, 0.2 μM of each primer, 0.025 U μl−1 BioTherm™ DNA Polymerase (Gene Craft), 1×DNA polymerase buffer, 0.1 μg μl−1 Bovine serum albumin (BSA), 4% (v/v) Dimethylsulfoxide (DMSO), 0.2 mM dNTP-Mix and 2.5 mM MgCl2 in a final volume of 25 μl.
Oligonucleotide primers used in this study targeting bacterial 16S rDNA genes resp. fungal 18S rDNA genes.

The GC-clamp sequences, attached to the forward primers if used for subsequent DGGE, are written in bold.
To amplify total bacterial communities, the universal 16S rDNA primer set 63f–1378r was used as a first step. The PCR included an initial 3 min denaturation at 94°C and was followed by 30 thermal cycles of 1 min at 94°C, 1 min at 62°C and 2 min at 72°C. Amplification was completed with a final extension step at 72°C for 10 min. PCR products of the first amplification were used as template for a second PCR performed using primer pair 338fGC and 518r. The PCR program for these primers differed by an annealing step of 30 s at 56°C.
Streptomycetes were amplified using a nested PCR with primers sm6f and sm5r as first step, followed by a second PCR with primers 984fGC and sm5r. The PCR started with an initial denaturation step at 94°C for 5 min, followed by 30 thermal cycles of 30 s at 94°C, 30 s at 50°C, and 1 min at 72°C and a final extension step at 72°C for 10 min.
A specific PCR reaction for ammonia-oxidising bacteria (AOB) was performed using primer pair CTO189fGC+CTO654r and a PCR program consisting of an initial denaturation step at 95°C for 3 min, 30 thermal cycles of 1 min at 95°C, 1 min at 57°C, and 1 min at 72°C and a final extension at 72°C for 10 min.
For amplification of the fungal 18 S rDNA primers FR1GC-FF390 and a PCR program with an initial denaturation step at 95°C for 8 min, followed by 35 thermal cycles of 30 s at 95°C, 45 s at 48°C, and 3 min at 72°C and a final extension step at 72°C for 10 min were chosen.
After amplification, PCR products were checked by electrophoresis in 1.5% (w/v) agarose gels and ethidium bromide staining (10 mg ml−1), as well as quantified using PicoGreen dsDNA quantitation reagent (Invitrogen, Carlsbad, USA).
DGGE analysis
Denaturing gradient gel electrophoresis (DGGE) was performed with the Ingeny PhorU2 system (Ingeny International BV, The Netherlands). 60 ng of PCR product were loaded on to 7% (w/v) polyacrylamide gels with a denaturing gradient of 40% to 70% (100% denaturant according to 7 M urea plus 40% formamide in 1 X TAE-buffer) and were run for 16 h at 60 V and at a constant temperature of 60°C in 1 X TAE-buffer (pH 7.4). After electrophoresis, the gels were stained with silver nitrate (Sanguinetti et al., Reference Sanguinetti, Net and Simpson1994) using an automated gel stainer (Amersham Pharmacia Biotech, Germany), photographed and air dried for storage.
Sequencing of DGGE bands
For identifying selected bands from the bacterial gels, universal bacterial primer set 984fGC-1378r was used to amplify the samples. DGGE was performed under the conditions described above. After electrophoresis, gels were stained for one hour with SYBR Green nucleic acid gel stain (Invitrogen, Carlsbad, USA), and bands were carefully excised from the gel with a pipet tip under UV illumination. The excised bands were directly placed in 1.5 ml microcentrifugation tubes containing 100 μl Ultrapure DNAse/RNAse-Free distilled water (Invitrogen, Carlsbad, USA) and incubated at room temperature for 10 min. After a 5 min centrifugation step at 10,000×g, the supernatant was removed, 50 μl of fresh Ultrapure DNAse/RNAse-Free distilled water was added and the tube was placed at 4°C overnight to elute DNA. Six microlitres of the supernatant was used as template for the re-amplification (as described above). The resulting amplicons were again electrophoresed on a DGGE gel to verify the position of the original band. Subsequently, the amplicons were purified using the NucleoSpin Extract II Kit (Macherey&Nagel, Düren, Germany) and sequenced (Microsynth, CH). All sequences were compared to those in the GenBank database (http://www.ncbi.nlm.nih.gov/BLAST/). Only sequences displaying an identity of more than 97% were considered to represent the same species (Kisand et al., Reference Kisand, Cuadros and Wikner2002).
Statistical analysis
DGGE banding patterns were normalized and analysed using the GelCompar II software package, version 4.0 (Applied Maths, Ghent, Belgium). For cluster analysis, PCR-DGGE of each primer set was performed in duplicate. Calculation of the pair-wise similarities was based on the Dice correlation coefficient. Dendrograms were created using the algorithm of Ward (Reference Ward1963).
Results
Bacterial 16S rDNA and fungal 18 S rDNA gene fragments were successfully extracted and amplified from soil and the dissected gut samples (four samples per feeding condition).
PCR-DGGE analysis of the gut microbiota of Lumbricus rubellus
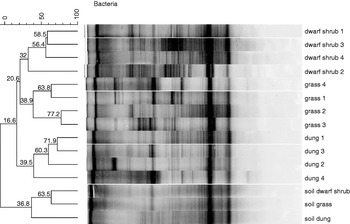
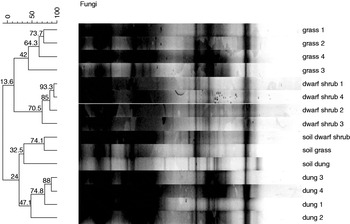
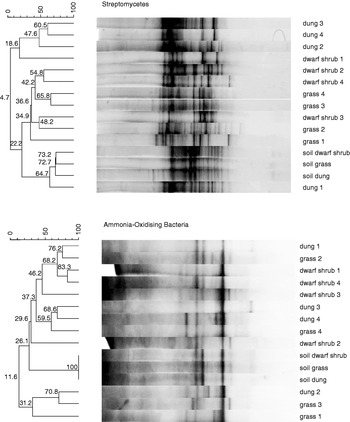
Cluster analysis of PCR-DGGE fingerprinting patterns generated with universal bacterial and fungal primer sets showed a clear separation of the gut microbiota of L. rubellus dependent on the food ingested (figs 1 and 2). Fingerprints of the microbial gut communities of L. rubellus specimens fed with dwarf shrub litter and grass litter were more closely related than the banding patterns of individuals fed with horse dung. The same was true for PCR-DGGE analysis with the group-specific bacterial primer pair detecting Streptomycetes, again showing higher similarities for microbial communities related to dwarf shrub litter and grass litter as food source (fig. 3). Only when analysing the gut microflora with AOB-specific primer sets, no distinctive clusters could be discovered. Furthermore, the diversity of AOB was low, with only two to seven bands per sample.
Cluster analysis of bacterial DGGE fingerprints based on 16S rDNA extracted from the soil and the guts of Lumbricus rubellus specimens fed with either dwarf shrub litter, grass litter or horse dung. Values at the branches of the dendrograms indicate the percentage of similarity, based on the Dice correlation coefficient.

Cluster analysis of fungal DGGE fingerprints based on 18S rDNA extracted from the soil and the guts of Lumbricus rubellus specimens fed with either dwarf shrub litter, grass litter or horse dung. Values at the branches of the dendrograms indicate the percentage of similarity, based on the Dice correlation coefficient.

Cluster analysis of DGGE fingerprints based on 16S rDNA extracted from the soil and the guts of Lumbricus rubellus specimens fed with either dwarf shrub litter, grass litter or horse dung and amplified with specific bacterial primer sets for ammonia-oxidising bacteria (AOB) and Streptomycetes. Values at the branches of the dendrograms indicate the percentage of similarity, based on the Dice correlation coefficient.

Comparison of Lumbricus rubellus gut microflora to bulk soil
When comparing the banding patterns of the bacterial gut microbiota to the fingerprints of the soil, which the earthworms had inhabited for six weeks, differences in banding pattern and especially in band intensity could be detected (fig. 1). Soils featured a complex pattern of mostly weak bands, whereas fingerprints of the gut communities showed some distinctive, dominant bands. For the fungal fingerprints, differences between gut samples and bulk soil were less distinct, leading to a highly similar overall pattern (fig. 2). When taking a closer look at the bacterial community composition, the DGGE banding patterns performed with AOB-specific primer displayed congruent fingerprints for all soil samples, irrespectively of the additional organic matter incubated with the soil (fig. 3). This result is indicating a strongly established AOB community in the soil that appears to be hardly influenced by the microbial populations attached to the three different substrates. Streptomycetes in the soil samples again showed a high similarity, with the soil taken from the horse dung box containing additional bands that could not be found in the fingerprinting patterns of the samples from the dwarf shrub or the grass box. However, the structural composition of Streptomycetes communities varies more between gut and soil samples than is the case for AOB.
Overall, no indications for gut-specific microorganisms could be found, based on the assumption that when screening the DGGE banding patterns, indigenous bacteria or fungi of the intestinal tract of the earthworm L. rubellus should occur in the majority of gut samples, irrespective of the feeding conditions, but not in the soil.
Band identification
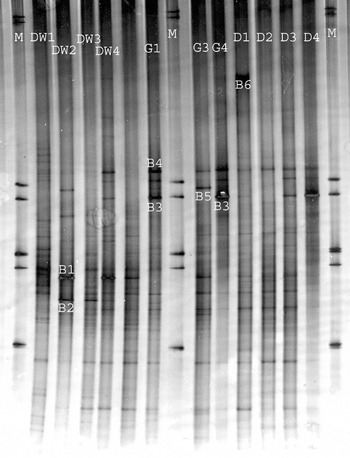
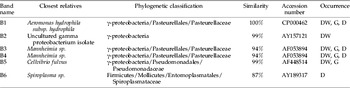
Although a high number of bands appeared when performing PCR-DGGE analysis with universal bacterial primers, it was only possible to identify few bands by excising them from the DGGE (fig. 4). Weak and closely situated bands turned out to be difficult to cut off the gel and couldn't be reamplified or only produced multiple DNA sequences. When comparing the sequences obtained from the excised bands to the GenBank database, nearly all analysed bands turned out to belong to the class μ-Proteobacteria (table 2). However, two of these sequences excised from one lane were assigned to the same organism, highlighting that sequence heterogeneities or heteroduplex molecules can lead to multiple bands on the DGGE (Muyzer & Smalla, Reference Muyzer and Smalla1998). Only one sequence that was exclusively obtained from an earthworm gut fed with horse dung could be attributed to the Firmicutes. Although the Streptomycetes-DGGE indicated a high diversity of Streptomycetes in the earthworm guts, no member of this distinctive group could be found in the excised bands. Streptomycetes, generally, have a high GC-content in their 16S rDNA (Williamson et al., Reference Williamson, Brian and Wellington2000); the failure to retrieve Streptomycetes sequences could, thus, be due to the fact that no GC-rich band was successfully excised from the gel.
Bands excised from PCR-DGGE analysis performed with universal bacterial primer set 984fGC-1378r. B1 to B6 indicate the positions from which bands were excised on the respective lanes; B3 was excised twice from different lanes to confirm its sequence conformance. DW (dwarf shrub), G (grass) and D (dung) mark the gut samples from which the bands were obtained; marker lanes are labelled with M.

Closest relatives of excised DGGE bands as revealed by BLAST N search. Letters DW (dwarf shrub litter), G (grass litter) and/or D (dung) indicate in which gut samples the identified bands occur.

Discussion
In this study, we analysed the bacterial and fungal community structure in the intestinal tract of the earthworm, L. rubellus, under different feeding conditions, using DGGE as molecular fingerprinting method. DGGE proved to be an appropriate tool to simultaneously analyse samples from the possible diets (organic and mineral components) and the guts of L. rubellus on one gel and compare their banding patterns.
Gut microbiota appeared to be most strongly influenced by the organic food source ingested, showing more similarity to the litter than to the soil material. When compared to the soil, bacterial gut fingerprinting patterns, especially, revealed differences in the abundance of certain bands, which indicated that some bacteria had been enriched in the gut. Overall, the microflora of the intestinal tract of L. rubellus was considerably different to that of the soil. This result is in accordance to enumeration studies conducted by Karsten & Drake (Reference Karsten and Drake1995), who attribute their findings to an enrichment of anaerobic microorganisms in the guts of L. rubellus. The enrichment of microorganisms during gut passage has not only been demonstrated in cultivation-based studies (Drake et al., Reference Drake, Schramm, Horn, König and Varma2006) but also in combination with a cloning approach (Furlong et al., Reference Furlong, Singleton, Coleman and Whitman2002).
Concerning the different food sources, a highly similar fingerprinting pattern for the specimens fed with dwarf shrub litter and grass litter was observed, whereas mixing horse dung to the soil led to more diverse banding patterns. This could be due to the fact that horse dung is already pre-digested (Lowe & Butt, Reference Lowe and Butt2005); and, therefore, it is supposed that microorganisms responsible for the degradation of the dung differ from the ones decomposing the recalcitrant structure of the dwarf shrub and grass litter. Still, the clustering of the bacterial and fungal DGGE also indicated differences in the gut microflora of the L. rubellus specimens fed with dwarf shrub litter compared to the ones fed with grass litter. The effect of plant species composition on the structure and abundance of the microbial population associated with these plants was demonstrated in a study about upland grasslands, in which Vaccinium myrtillus and other shrubs were compared to grasses and herbs (Grayston et al., Reference Grayston, Campbell, Bardgett, Mwadsley, Clegg, Ritz, Griffiths, Rodwell, Edwards, Davies, Elston and Millard2004).
No distinctive L. rubellus gut microflora was identified by PCR-DGGE, and all dominant bands in the gut samples could also be found in the litter or in the soil. The data, thus, support the finding of Egert et al. (Reference Egert, Marhan, Wagner, Scheu and Friedrich2004), who were not able to detect an indigenous gut microflora of L. terrestris using T-RFLP and, therefore, suspected that the gut microflora is mainly soil- or food-derived. Singleton et al. (Reference Singleton, Hendrix, Coleman and Whitman2003), however, found, when analysing gut samples with the help of a clone library approach in combination with fluorescence in situ hybridisation (FISH), bacteria tightly associated with the intestine of L. rubellus. Gut-wall attached microorganisms could also be found with scanning electron microscopy (SEM) (Jolly et al., Reference Jolly, Lappinscott, Anderson and Clegg1993; Mendez et al., Reference Mendez, Borges and Betancourt2003), which indicates that an indigenous earthworm-specific gut microflora cannot be excluded, in particular, when microorganisms attached to internal structures are concerned. Compared to the techniques applied by Singleton et al. (Reference Singleton, Hendrix, Coleman and Whitman2003), DGGE has the limitation that its profiles represent only the most dominant phylotypes in the investigated samples (Muyzer et al., Reference Muyzer, de Waal and Uitterlinden1993). Therefore, our banding patterns reflect only the most abundant organisms, whereas less abundant representatives of the microbial community or microbes strongly attached to the gut wall are not likely to be included in our analysis. Like all molecular techniques requiring a preliminary amplification step, DGGE, furthermore, is subject to PCR biases, such as differential PCR amplification or the formation of artefacts (v. Wintzingerode et al., Reference V. Wintzingerode, Göbel and Stackebrandt1997). An even greater bias may be introduced by applying a nested PCR approach (Suzuki & Giovannoni, Reference Suzuki and Giovannoni1996). Heuer et al. (Reference Heuer, Krsek, Baker, Smalla and Wellington1997), however, report that this bias may be overestimated, and nested PCR, furthermore, has the advantage that it increases the sensitivity of the PCR and makes it possible to visualise also less abundant bacteria. Using group-specific instead of universal primer sets is another way of improving the resolution of DGGE analysis by reducing microbial complexity and, therefore, taking a closer look at less abundant species. However, our analysis with Streptomycetes-specific primers did not lead to refined results compared to the ones obtained with universal bacterial primers; and, for AOB, no distinctive influence factors could be found at all. This may be due to the fact that AOB, although they are essential for the nitrogen cycle in natural ecosystems, only occur in low numbers (Phillips et al., Reference Phillips, Harris, Dollhopf, Gross, Prosser, Prosser and Paul2000).
While the specific PCR-DGGE analysis revealed a great variety of Streptomycetes in the samples and detected some AOB, no members of these two groups were obtained when excising bands from the universal bacterial DGGE. In contrast, y-Proteobacteria dominated the sequences retrieved from the excised bands, indicating a strong occurrence of this bacterial group in all earthworm guts. These results are in line with Furlong et al. (Reference Furlong, Singleton, Coleman and Whitman2002), who found that the casts of L. rubellus were intensively populated with y-Proteobacteria and Aeromonas sp. especially turned out to be abundant in the cast while it could not be detected in the bulk soil. The low number of DGGE bands that could be identified may be attributed to the fact that weak and closely situated bands are difficult to excise from the gels (Liang et al., Reference Liang, Drijber, Lee, Dwiekat, Harris and Wedin2008). Another limitation is that it is frequently not possible to obtain a pure DNA sequence from a band, as DGGE bands are overlapping or cannot be separated efficiently from each other during excision (Gonzalez et al., Reference Gonzalez, Ortiz-Martinez, Gonzalez-Delvalle, Laiz and Saiz-Jimenez2003). Moreover, the UV light used to make bands visible when cutting them off the DGGE may destroy the DNA and lead to sequence variation artefacts (Schabereiter-Gurtner et al., Reference Schabereiter-Gurtner, Pinar, Lubitz and Rolleke2001).
In conclusion, the results of this study demonstrated that DGGE was a useful molecular technique for analysing the microbial community structure in the guts of L. rubellus. Although it could be shown that the gut microbiota is different from the surrounding soil, no indigenous microflora could be detected; too strong was the influence of the diet. Excising bands from the DGGE did not allow for the identification of all bands of interest; however, this technique made it possible to identify some of the most abundant bacteria in the earthworm gut and reveal the dominance of y-Proteobacteria in all gut samples. Additional analyses, like the setting up of a clone library from the gut samples, will be necessary to fully elucidate the issue of microbial structure in the intestinal tract of earthworms, offering a more detailed overview about the gut microbiota of Lumbricus rubellus.
Acknowledgements
This study was supported by FWF grant P16027. We also wish to thank Alexander Rief for setting up the feeding experiment.