
Introduction
Silicon nanocrystals (Si NCs) are interesting for photovoltaic and biologic applications[ Reference Conibeer, Green, Cho, König, Cho, Fangsuwannarak, Scardera, Pink, Huang, Puzzer, Huang, Song, Flynn, Park, Hao and Mansfield 1 , Reference Sugimoto, Fujii, Imakita, Hayashi and Akamatsu 2 ] due to their unique quantum confinement effect properties.[ Reference Jiang and Green 3 ] All-Si tandem solar cells using Si NCs potentially have higher energy conversion efficiency than a single junction Si solar cell and also can be fabricated using conventional thin film techniques. Colloidal Si NCs have attracted great interest for live-cells bio-imaging due to its non-toxicity as a material. For practical applications, impurity doping is important to control electronic properties; however, doping of Si NCs is challenging because the dopant atoms are thought to be ejected during thermal treatments because of the mechanism of self-purification.[ Reference Dalpian and Chelikowsky 4 ] Although there have been intensive studies on optical and electrical properties of doped Si NCs,[ Reference Fujii, Mimura, Hayashi and Yamamoto 5 – Reference Conibeer, Green, König, Perez-Wurfl, Huang, Hao, Di, Shi, Shrestha, Puthen-Veetil, So, Zhang and Wan 7 ] the structure and distribution of Si NCs will be different between samples because of variation in the fabrication methods. This includes features such as excess Si content, doping levels, presence of nitrogen, and annealing conditions. How these different microstructural features influence the displayed functional properties is still not fully understood. So to elucidate this, it is important that the microstructure and properties of different devises are compared.
We use atom probe tomography (APT)[ Reference Gault, Moody, Cairney and Ringer 8 ] to investigate the distribution of Si NCs and dopant atoms. APT is one of the most powerful atomic scale characterization tools, being able to reveal the three-dimensional (3D) position and chemical identity of atoms in a material specimen. Because of high-electric field with pulsed laser assistance, atoms can be evaporated from the surface of sharp needle-shaped tip. The evaporated ions hit a position sensitive detector, while the time-of-flight measurements enable the mass-to-charge ratio of the ions to be identified. A back projection algorithm enables atoms to be reconstructed in 3D.
In this report, we prepare three different types of Si NCs fabricated at different institutes and perform APT measurements using the same experimental parameters and same reconstruction methodology for all samples. Therefore, we can directly compare the structure of Si NCs and doping behavior. We show the size and network of Si NCs in the oxide matrix and reveal the location of the phosphorus (P) or boron (B) dopant atoms relative to the NC/oxide interfaces. Finally, we discuss the difference in a preferential location between P and B by a segregation coefficient. The size and network of Si NCs and dopants distribution in various samples helps to further understand doped Si NCs from a structural point of view for future applications.
Experimental section
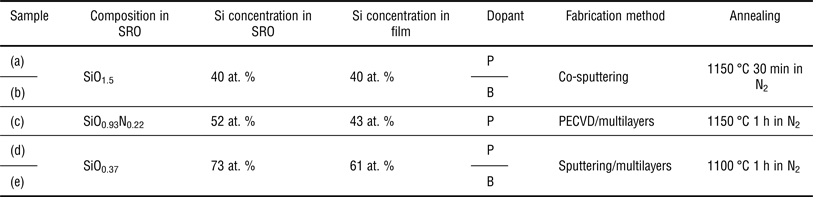
We prepared three different types of Si NCs in Si-rich oxide (SRO) films with different SiO x compositions and doping levels as summarized in Table I. Samples (a) and (b) with a composition of SiO1.5 (40 at.% Si in SRO) were fabricated by a co-sputtering method using Si, SiO2, P2O5, or B2O3. Sample (c) with a composition of SiO0.93N0.22 (52 at.% Si in SRO) was fabricated by plasma-enhanced chemical vapor deposition. Samples (d) and (e) with a composition of SiO0.37 (73 at.% Si in SRO) were fabricated by a sputtering method. The film structure of samples (c)–(e) was multilayers of P- or B-doped SRO and SiO2. All samples were annealed at 1100–1150 °C for 30 min–1 h in N2 to form Si NCs. A detailed explanation about sample preparation is described in previous reports.[ Reference Fujii, Hayashi and Yamamoto 9 – Reference Yang, Nomoto, Lin, Wu, Puthen-Veettil, Zhang, Jia, Conibeer and Perez-Wurfl 11 ]
Sample list prepared within this study.

SRO, silicon-rich oxide; P, phosphorus; B, boron.
For the preparation of APT measurements, sharp needle-shaped tips were prepared for each sample using an Auriga FIB-SEM (Zeiss). A few hundred nm of Pt was deposited onto the surface of the samples to protect the film from Ga ion damage and then milled using the standard lift-out procedure.[ Reference Felfer, Alam, Ringer and Cairney 12 ] The APT measurements were performed using a LEAP 4000XSi (CAMECA) system equipped with a pulsed UV laser (λ = 355 nm) and a detector efficiency of 0.57. The chamber pressure was within the range of 10−12–10−11 Torr. The laser pulse energy and rate were 100 pJ and 250 kHz, respectively. The specimen holder was cooled to ~40 K. The APT data were then reconstructed using commercially available IVAS™ software (version 3.6.6). Although the default image compression factor (1.65) and field factor (3.3) were used, the standard reconstruction algorithm in this work is volume conserving,[ Reference Vurpillot, Gault, Geiser and Larson 13 ] so the calculated size of Si NCs shown later should be fairly constant regardless of the reconstruction parameters used. The P or B distribution as well as the concentration were analyzed using a proximity histogram (proxigram).[ Reference Hellman, Vandenbroucke, Rusing, Isheim and Seidman 14 ]
Results and discussion
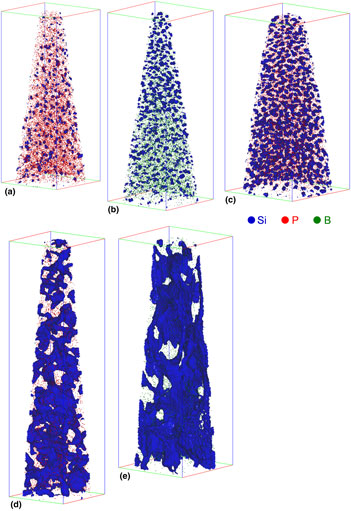
Figure 1 shows a 3D reconstruction of P- and B-doped Si NCs. The Si NCs interfaces can be qualitatively visualized using iso-concentration surfaces that create bounding volumes that contain at least 65 at.% Si. This was applied to all samples in the same manner. Figure parts of (a)–(e) are the same sample names of (a)–(e) as labeled in Table I. The 3D images show that the Si NCs of samples (a) and (b) were well separated from each other in 3D, despite the film being a single SRO layer fabricated by the co-sputtering method without a multilayered structure. We classify these types of Si NCs as “isolated Si NCs”. In sample (c) the use of NO2 during deposition results into N incorporation of around 5 at.% in the SRO layer.[ Reference Hartel, Hiller, Gutsch, Löper, Estradé, Peiró, Garrido and Zacharias 15 ] It has been reported that introducing nitrogen inhibits Si diffusion,[ Reference Mulloni, Bellutti and Vanzetti 16 ] hence, the sample needs a slight increase in the annealing temperature (from 1100 °C to 1150 °C) to complete the crystallization of Si NCs.[ Reference Hartel, Hiller, Gutsch, Löper, Estradé, Peiró, Garrido and Zacharias 15 ] On the other hand, a phase separation of SiO x and growth of Si precipitates during high-temperature annealing is thought to be very fast due to the out-diffusion of oxygen.[ Reference Sarikov, Litovchenko, Lisovskyy, Maidanchuk and Zlobin 17 ] In fact, a successful Si NCs formation has been demonstrated by rapid thermal annealing in a short time within a few seconds.[ Reference Hiller, Gutsch, Hartel, Löper, Gebel and Zacharias 18 ] Therefore, the influence of introducing nitrogen on the size and the distribution of Si NCs in sample (c) might be a minor issue. The Si NC distribution was similar to that of samples (a) and (b), but sample (c) had larger Si NCs and less SiO2 matrix volume compared with samples (a) and (b). This should simply be because the excess Si content in sample (c) is higher than that in samples (a) and (b). On the other hand in samples (d) and (e), the Si NCs were more likely connected to each other. We classify this type of Si NCs as “connected Si NCs”. Recently, a threshold value from non-percolating to percolating network was reported in between SiO0.5 and SiO0.7,[ Reference Laube, Gutsch, Wang, Zacharias and Hiller 19 ] thus, “connected Si NCs” should be dominant for samples (d) and (e). (Please note that isolated Si NCs also exist in this type of “connected Si NCs”.) Although it was not possible to obtain sufficient crystallographic information for the reconstruction, high-resolution transmission electron microscopy and Raman results in previous works showed that the Si NCs fabricated in the same manner here were indeed crystallized as shown in Refs. Reference Fujii, Hayashi and Yamamoto9–Reference Yang, Nomoto, Lin, Wu, Puthen-Veettil, Zhang, Jia, Conibeer and Perez-Wurfl11.
3D reconstructions of (a) P-doped Si NCs (SiO1.5), (b) B-doped Si NCs (SiO1.5), (c) P-doped Si NCs (SiO0.93N0.22), (d) P-doped Si NCs (SiO0.37), and (e) B-doped Si NCs (SiO0.37). The box sizes are (a) 53 × 53 × 130 nm3, (b) 61 × 61 × 156 nm3, (c) 71 × 71 × 145 nm3, (d) 44 × 44 × 167 nm3, and (e) 55 × 55 × 160 nm3.

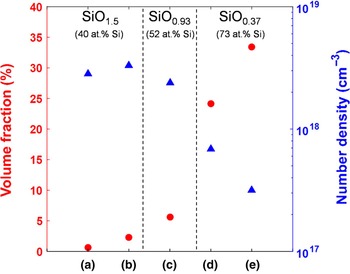
For a quantitative analysis of the Si NCs size, we investigated the volume fraction and number density for all samples as shown in Fig. 2. The volume fraction was defined as the ratio of the Si NCs volume to the total reconstruction volume. The number density was calculated by dividing the number of Si NCs by the total volume. The trend clearly showed an increase in the volume fraction and a decrease in the number density as the excess Si content increased. This suggests that there are many small Si NCs in samples for lower Si content (samples (a)–(c)) and a small amount of large Si NCs in samples for higher Si content (samples (d) and (c)), as one might expect.
Volume fraction and number density of P- and B-doped Si NCs in the oxide matrix.

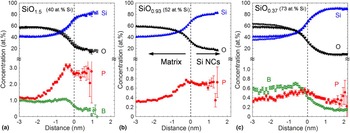
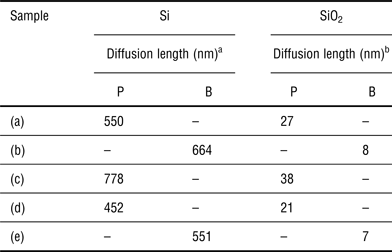
The distribution of the P or B inside and outside of the Si NCs was studied by proxigram analysis as shown in Fig. 3. From the profile, it was found that P and B were incorporated into the Si NCs. For the amount of P incorporation, the P concentration seems to be close to, or even above, the solid solubility limit at ~1100 °C in bulk Si (around 2.4 at.% for P, 0.5–1.2 at.% for B).[ Reference Trumbore 20 – Reference Olesinski and Abbaschian 22 ] This may indicate that the solid solubility limit of dopants in Si NCs could be different from that in the bulk Si.[ Reference Sumida, Ninomiya, Fujii, Fujio, Hayashi, Kodama and Ohta 23 ] In addition, there was a preferential location of P and B in the system of Si NCs/SiO2. For example, P preferred to locate inside the Si NCs rather than the SiO2 matrix. Again, the influence of nitrogen in sample (c) should be considered, but the profiles between sample (a) and (c) were close enough to claim the preferential location of P. On the other hand, B tended to be located in the matrix region and the B concentration gradually decreased toward the Si NCs core. The profile in Fig. 3(c) were slightly different from Fig 3(a) and (b). The proxigram analysis might be affected by neighboring Si NCs, which are randomly connected to each other forming the complex shape and distribution. Further analysis is necessary to understand the distribution for the connected Si NCs. A pile-up or segregation of P and B was slightly observed around interface between Si NCs and the matrix. The diffusivities of P and B in Si and SiO2 have been reported by many researchers.[ Reference Ghezzo and Brown 24 ] Although it is not straightforward to compare the diffusivity for all samples, Table II summarizes calculations of the diffusion length of P and B in Si and SiO2 for all samples. In the case of the diffusion of P and B in Si, the pre-exponential diffusion coefficient, D0, and the activation energy, Q, were extracted from the slope of the temperature versus diffusivity figures from experimental data; 3.85 cm2/s and 3.66 eV was calculated for P,[ Reference Fair and Tsai 25 ] and 3.17 cm2/s and 3.59 eV for B.[ Reference Fair 26 ] In the case of the diffusion of P and B in SiO2, D0, and Q were also extracted from the slope of the temperature versus diffusivity figures; for P they are 1.86 × 10⁻¹ cm2/s and 4.03 eV,[ Reference Ghezzo and Brown 24 ] and 3.16 × 10⁻⁴ cm2/s and 3.53 eV for B.[ Reference Ghezzo and Brown 24 ] The one order of magnitude difference in diffusion rates within Si and SiO2 of both types of dopants might explain the enrichment at the interface between the Si NCs and the matrix after annealing. It is also proposed that the interface between Si NCs and SiO2 has a high-interface energy (strain) due to lattice mismatches between Si NC and amorphous-SiO2 matrix.[ Reference Hadjisavvas and Kelires 27 ] Our observation implies that dopants at the interface may release the strain as reported in the system of bulk Si/SiO2.[ Reference Sakamoto, Nishi, Ichikawa and Ushio 28 ] This argument is supported by the fact that the P and B diffusion lengths in Si NCs system correlate with a difference in the length of the diffusion profiles, as mentioned above. This implies that there might be other factors that determine the location of dopants atoms that should motivate further studies.
Proxigram analysis of P- and B-doped Si NCs in the oxide matrix. The composition of SRO is (a) SiO1.5, (b) SiO0.93N0.22, and (c) SiO0.37.

Diffusion length of P and B in Si and SiO2.

a D0 and Q: 3.85 cm2/s and 3.66 eV for P, and 3.17 cm2/s and 3.59 eV for B.
b D0 and Q: 1.86 × 10⁻¹ cm2/s and 4.03 eV for P, and 3.16 × 10⁻⁴ cm2/s and 3.53 eV for B.
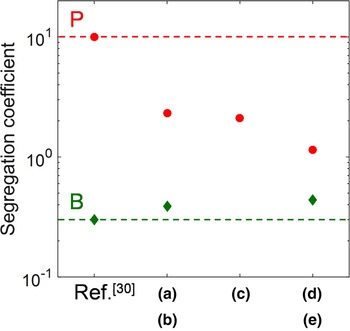
Similar distribution behavior of P and B have been reported in P- and B-doped Si nanowires, suggesting a segregation behavior between P and B.[ Reference Fukata, Ishida, Yokono, Takiguchi, Chen, Sekiguchi and Murakami 29 ] As mentioned above, phase separation and Si precipitation occur in a very short time within a few seconds, so the distribution and size of Si NCs in the annealing condition here (1100–1150 °C 30 min–1 h) does not change significantly. Moreover, considering the feature size being analyzed here, the diffusion length of P and B in Si and SiO2 in Table II is substantially longer to assume that the system is in equilibrium or close enough to the equilibrium conditions. In Fig. 4, we extracted the segregation coefficient (m) from the plot of the proxigram in Fig. 3 to study the different distribution behavior between P and B. The segregation coefficient is represented by the ratio of equilibrium concentration of impurity in the silicon to that in the oxide.[ Reference Grove, Leistiko and Sah 30 ] The P and B concentration in Si NCs and the oxide region was extracted from the distance around 0.5 m and −2.5 m, respectively. Although there was a slight deviation, both m values of P and B were consistent with the trend of the reference values, which was m > 1 for P and m < 1 for B.[ Reference Grove, Leistiko and Sah 30 ] Moreover, interestingly, the segregation coefficient for P and B was almost constant at least in the similar annealing conditions, even though the concentrations in Si NCs and the matrix were quite different as shown in Fig. 3. In other words, regardless of the amount of introduced impurity, the different P and B segregation coefficients are reflected in the dopant's incorporations into Si NCs and matrix, respectively.
Extracted segregation coefficient of P- and B-doped Si NCs in the oxide matrix from the proxigram analysis.

Conclusions
We studied P- and B-doped Si NCs of various composition of SiO x using APT. It was confirmed that there were two types of Si NC networks: “isolated Si NCs” and “connected Si NCs”, depending on the excess Si content. The size of the Si NCs increased as the excess Si content in SiO x increased. The distribution of P or B in the Si NCs, the SiO2 matrix, and the interface was investigated using proxigram analysis. It was found that P preferred to locate inside the Si NCs, whereas B was more likely to be located in the matrix region. The extracted segregation coefficient of P and B in Si NCs/SiO2 system from the proxigram analysis was consistent with that in bulk Si/SiO2 system. The structure of Si NCs and the distribution of P and B in varieties of SiOx composition fabricated in different processes will help to further understand doped Si NCs for future applications.
Acknowledgments
This research has been supported by the Australian Government through the Australian Renewable Energy Agency (ARENA). Responsibility for the views, information, or advice expressed herein is not accepted by the Australian Government. The authors acknowledge the facilities and the scientific and technical assistance of the Australian Microscopy & Microanalysis Research Facility (AMMRF) at the Australian Centre for Microscopy & Microanalysis at the University of Sydney. This research was supported by the Faculty of Engineering & Information Technologies, The University of Sydney, under the Faculty Research Cluster Program. This work is partly supported by 2015 JST Visegrad Group (V4)-Japan Joint Research Project on Advanced Materials, and KAKENHI (16H03828). The authors thank T. Kanno (Kobe University) and Dr. T. C.-J. Yang (UNSW) for sample preparation, and the group of Prof. Zacharias (IMTEK) for providing part of the samples used in this study.