INTRODUCTION
Wheat is the principal staple under Mediterranean conditions. The use of wheat genetic resources is essential to support future genetic progress and is an insurance against unexpected threats to crop productivity such as diseases or abiotic stresses (Gepts Reference Gepts2006). Well-managed conditions in terms of agronomic inputs (mostly fertilization and support irrigation) make crops more resilient to future challenges posed by the levels of climate change predicted for the Mediterranean (Oweis et al. Reference Oweis, Pala and Ryan1998). Moreover, a higher yield potential frequently translates to increased productivity under Mediterranean drought conditions (Araus et al. Reference Araus, Slafer, Reynolds and Royo2002, Reference Araus, Slafer, Royo and Serret2008; Richards et al. Reference Richards, Rebetzke, Condon and Van Herwaarden2002; Tambussi et al. Reference Tambussi, Nogués, Ferrio, Voltas and Araus2005); therefore it is sensible to breed for high-yielding Mediterranean conditions (Del Pozo et al. Reference Del Pozo, Matus, Serret and Araus2014). In this regard, International Maize and Wheat Improvement Center (CIMMYT) germplasm developed for the high-yielding conditions of semi-arid north-western Mexico has been used extensively during recent decades in breeding programmes aimed at increasing bread wheat productivity under Mediterranean conditions (García del Moral et al. Reference García del Moral, Rharrabti, Villegas and Royo2003). In that context, looking for alternative sources of germplasm is strategically important for the Mediterranean cultivation of wheat. Conversely, studying the performance of high-potential Chinese wheat genotypes under less favourable conditions may also have implications for Chinese agriculture in relation to predicted climate change. Stagnation in yield for wheat and other cereals in response to climate constraints has occurred during recent decades, not only in Europe (Hawkesford et al. Reference Hawkesford, Araus, Park, Calderini, Miralles, Shen, Zhang and Parry2013) but also in other parts of the world. In fact there are reports for China (You et al. Reference You, Rosegrant, Wood and Sun2009; Piao et al. Reference Piao, Ciais, Huang, Shen, Peng, Li, Zhou, Liu, Ma, Ding, Friedlingstein, Liu, Tan, Yu, Zhang and Fang2010) and elsewhere (Graybosch & Peterson Reference Graybosch and Peterson2012; Oury et al. Reference Oury, Godin, Mailliard, Chassin, Gardet, Giraud, Heumez, Morlais, Rolland, Rousset, Trottet and Charmet2012) which show that breeding advances in yield potential during recent decades have not been fully realized due to climate constraints. Thus, over the last few decades warmer conditions and decreased rainfall has been accompanied by increased drought in Central-North China, the basket of wheat agriculture in China (Piao et al. Reference Piao, Ciais, Huang, Shen, Peng, Li, Zhou, Liu, Ma, Ding, Friedlingstein, Liu, Tan, Yu, Zhang and Fang2010; Cheng et al. Reference Cheng, Liu and Ma2011). This trend to a more Mediterranean-like environmental condition has produced a negative impact on Chinese agriculture.
Chinese wheat genotypes released during the last few decades, particularly those coming from the highly fertile provinces of central China surrounding the Yellow River (such as Henan and Shandong), are very productive (Zhou et al. Reference Zhou, He, Sui, Xia, Zhang and Zhang2007). Their growth cycle in terms of duration and calendar is more similar to the situation of Mediterranean wheat than, for example, northern European genotypes. Like CIMMYT wheat, genetic gains in yield potential for wheat bred in Henan and Shandong have been achieved largely through improvements in agronomic yield components, such as harvest index (HI) and grains/unit area (Zheng et al. Reference Zheng, Zhang, Yin, Wang, Han, Chen, Huang, Tang, Xia and He2011; Xiao et al. Reference Xiao, Qian, Wu, Liu, Xia, Ji and He2012). However, on top of that a higher biomass also appears to be involved in the genetic gains of these Chinese wheat genotypes (Zheng et al. Reference Zheng, Zhang, Yin, Wang, Han, Chen, Huang, Tang, Xia and He2011; Xiao et al. Reference Xiao, Qian, Wu, Liu, Xia, Ji and He2012).
The present paper reports on the agronomic and physiological responses of Chinese wheat genotypes from Henan Province (China) to high-yielding Mediterranean conditions. To that end, modern varieties and advanced wheat lines from Henan, developed during the past 15 years, were grown together with a number of modern Spanish varieties as controls. The rationale was that dissecting the causes of lower yields in the Chinese cultivars compared with the well-adapted Spanish controls would allow identification of traits for incorporation into future wheat breeding programmes for the central and north regions of China. It is predicted that these areas will be exposed to rising temperatures and decreasing precipitation (Piao et al. Reference Piao, Ciais, Huang, Shen, Peng, Li, Zhou, Liu, Ma, Ding, Friedlingstein, Liu, Tan, Yu, Zhang and Fang2010), so exposing Chinese cultivars to these constraints of climate change will assist in securing future gains in yield. Besides their yield and agronomic components, two categories of physiological traits were measured during grain filling, indicating (1) the water status and (2) the nitrogen (N) status of the crop. Among the first category, the traits measured were canopy temperature (CT) (Jones et al. Reference Jones, Serraj, Loveys, Xiong, Wheaton and Price2009) and instantaneous gas-exchange rates (stomatal conductance) measured in the flag leaf, together with time-integrated (i.e. during grain filling) traits, such as stable carbon (C) and oxygen (O) isotope composition (δ 13C and δ 18O, respectively) in the flag leaf, spike and mature grains (Barbour et al. Reference Barbour, Fischer, Sayre and Farquhar2000; Araus et al. Reference Araus, Bort, Steduto, Villegas and Royo2003; Cabrera-Bosquet et al. Reference Cabrera-Bosquet, Albrizio, Nogués and Araus2011). Among the second category of traits, N concentration and N isotope composition (δ 15N) of the flag leaf, ears and mature grains (Serret et al. Reference Serret, Ortiz-Monasterio, Pardo and Araus2008; Yousfi et al. Reference Yousfi, Serret, Márquez, Voltas and Araus2012, Reference Yousfi, Serret and Araus2013), together with the leaf chlorophyll (Chl) content at different crop stages, were evaluated. Moreover, green biomass was assessed in a non-destructive manner through a spectro-radiometrical vegetation index (Marti et al. Reference Marti, Bort, Slafer and Araus2007). The final aim was to identify which agronomical and physiological traits may be eventually involved in the performance of Chinese genotypes under high-yielding Mediterranean conditions. While these traits will not contribute to further genetic gains in yield potential, they may help to increase actual yields and sustainability of new cultivars through a better adaptation to moderate stress conditions.
MATERIALS AND METHODS
Plant material and growing conditions
Nine facultative (i.e. not strictly ‘winter’ genotypes) wheat genotypes from Henan province (China) plus two Spanish facultative wheat cultivars were planted in the experimental field of Instituto Nacional de Investigación y Tecnología Agraria y Alimentaria (INIA) of Colmenar de Oreja (Madrid, Spain: 40°03′N, 3°36′W, 552 m asl) during the 2011/12 cropping season. The Chinese genotypes were semi-dwarf facultative wheat with Rht1 and/or Rht2 genes and included six commercial cultivars (Yumai 35, Yumai 66, Aikang 58, Lankao 198, Zhoumai 18 and Zhoumai 25) released between 1995 and 2010, and widely distributed in the wheat zone of the Yellow and Huai valleys. In addition, three advanced lines (Lankao 298, Lankao 282 and Lankao 223) were selected from the top yielding lines among 10 000 genotypes evaluated during the 2010–11 season in the Henan Tianmin seed Co., Ltd. (Henan, China). The two Spanish genotypes chosen as controls (Gazul and Artur Nick) were, respectively, tall and Rht semi-dwarf facultative commercial varieties with high-yield performance under good Mediterranean agronomic conditions in Spain.
The experiment was carried out in a randomized complete block design with three replicates for each genotype. Each replication consisted of a plot of six rows, 7 m long and 0·25 m apart. Seeding rate was high (400 seeds/m2), aiming to resemble cultural conditions in Henan. The trial was sown on 14 November 2011, achieving maturity during the first half of June and harvested on 18 July 2012. The soil type was sandy clay, slightly alkaline (pH = 8·1), with 4·9 g/kg of organic matter, 233 g/kg of carbonates and 0·38 g N/kg in the top 50 cm. Before planting, 400 kg/ha of an Nitrogen/Phosphate/Potash (NPK) complex fertilizer, 15-15-15, was applied. At the end of tillering (growth stage (GS) 20-29, Poole Reference Poole2005) the plants were top-dressed with N, using a dose of 150 kg/ha of urea (460 g N/kg commercial urea). Accumulated precipitation during the whole cropping season was 183·4 mm. Sprinkler irrigation was provided at booting (GS40-49, Zadoks et al. Reference Zadoks, Chang and Konzak1974), heading or ear emergence (GS50-59) and grain filling (GS70-89), with one irrigation in March, two in April, three in May and one in June, providing 350 mm of irrigation in total throughout the season. Fungicides and pesticides were applied at booting and again at the beginning of grain filling (GS70) to prevent diseases and pests. A net with a mesh size of c. 15 × 15 mm2 was used to prevent grain loss by birds during grain filling.
The same genotypes were grown for the second year (2012/13 season) under an identical experimental design, planting density and fertilization. Seeds were sown on 11 November 2012 and again a net with a mesh size of c. 15 × 15 mm2 was used to prevent grain loss by birds during grain filling. The accumulated precipitation was 265 mm from 1 January to 1 July. Sprinkler irrigation was provided at booting, heading and flowering (GS 60–69) with two irrigations in April and another in early May, totalling c. 180 mm. The total rainfall was lower in the first compared with the second season. Moreover, during the second year most of the precipitation was received during the active growth period. Thus precipitation occurred on 69 days, and most of the continuous rains were concentrated during early April and mid-May. As a consequence, and in spite of the larger application of water as irrigation, the crop during the first season still suffered a slight water stress during the reproductive phase of the crop, which is the usual scenario for support irrigation in the Mediterranean basin, where the objective is to maximize yield per unit volume of water applied (Oweis et al. Reference Oweis, Pala and Ryan1998). The crop in the second year did not experience water stress due to the humid conditions, with some incidence of yellow rust being detected.
Plant sampling and grain yield components
In the first season (2011/12), flag leaf lamina and spikes were sampled from five main plant stems/plot at mid grain filling (GS80) and oven-dried at 70 °C for 48 h, weighed and ground to a fine powder. Plant height was measured before physiological maturity from the soil surface to the top of the spike, excluding awns. At harvest a 1 m length from two rows in the middle of each plot was harvested by hand to estimate the above-ground biomass, HI and spike number per unit area. Samples of ten representative spikes were selected randomly to calculate thousand grain weight (TGW), spike length, grains/spike, the spike fertility index (defined as the quotient between the number of grains and the spike dry weight at anthesis) and grains/unit area. All hand-harvested plants were threshed on the same day. The remaining plants in each plot were machine-harvested and grains were oven-dried for 48 h at 60 °C to constant weight. Additionally, a sub-sample of grains from each plot was ground to a fine powder for further analysis.
In the second season (2012/13), the entire plot was machine-harvested, threshed and the grains oven-dried to constant weight as described above. In addition, above-ground biomass was assessed indirectly through the remote sensing evaluation of vegetation index (see below).
Leaf stomatal conductance and chlorophyll content
Leaf stomatal conductance (g s) was measured during the 2011/12 season with a porometer (Decagon, SC-1, Pullman WA, USA) at tillering, heading and 2 weeks after anthesis. Each time, measurements were performed on the upper adaxial surfaces of the youngest fully expanded leaf of five main stems/plot (which correspond to the flag leaf at heading and grain filling), between 10.00 and 14.00 h on sunny days. Leaf Chl content was estimated during the 2011/12 season using a portable meter (Minolta SPAD 520 Meter, Plainfield, IL, USA) on the same days as the porometric measurements. During the 2012/13 season, leaf Chl content was also measured at tillering, heading and mid-grain filling. Each time five fully expanded leaves/plot were measured. For each, leaf measurements were performed at the bottom, middle and tip of the blade and then the average Chl content was calculated.
Total nitrogen content and stable isotope signatures
The total N concentration in dry matter and the stable carbon (13C/12C) and N (15N/14N) isotope signatures were analysed during the first season, in the dry matter of the flag leaf and whole spike sampled c. 2 weeks after anthesis, as well as in mature grains. Finely powdered samples of 1 mg (spike and grains) and 0·7 mg (flag leaf) dry matter were weighed into tin capsules and analysed by an elemental analyser (Flash 1112 EA; Thermo Finnigan, Breman, Germany), coupled with an isotope mass ratio spectrometer (Delta C IRMS, Thermo Finnigan, Germany), operating in continuous flow mode at the Scientific Service Facilities of the University of Barcelona (Spain). Nitrogen concentration in dry matter was expressed as mg N/g dry matter. Stable carbon isotope composition values were expressed in δ notation (Farquhar & Richards et al. Reference Farquhar and Richards1984):
 $${\delta ^{13}}{\rm C} = [{{(^{13}}{\rm C}{/^{12}}{\rm C})_{{\rm sample}}}/{{(^{13}}{\rm C}{/^{12}}{\rm C})_{{\rm standard}}}] - 1\hfill$$
where sample refers to plant material and standard to a secondary standard calibrated against Pee Dee Belemnite calcium carbonate standard. International isotope secondary standards of known 13C : 12C ratios (International Atomic Energy Agency standards IAEA CH7, IAEA CH6 and L-glutamic Acid USGS 40) were used for calibration with a precision of 0·1‰. The 15N : 14N ratio was expressed as δ 15N using the same δ notation as above, but the standard referred to N2 in air. International secondary isotope standards of known 15N : 14N ratios (IAEA N1, IAEA N2 and IAEA NO3) were used for calibration to a precision of 0·2‰. In addition the 18O : 16O ratios of mature grains were determined by Iso-Analytical Limited (Crewe, Cheshire CW2 8UY, UK). Finely powdered samples of c. 1 mg were placed in silver capsules, oven-dried at 60 °C for >72 h and loaded into an automatic sampler. Analyses were conducted by pyrolysis over glassy carbon at 1350 °C using a Thermo-Electron Thermo-Chemical Elemental Analyser coupled with a gas isotope ratio mass spectrometer (Thermo-Electron Delta Plus XL, Bremen, Germany). Results were expressed as δ notation, and calculated with the same equation as δ 13C. International secondary isotope standards of known 18O : 16O ratios (IAEA-CH-6, IAEA-C-3 and IAEA-601) were calibrated against the Vienna standard mean oceanic water, and the analytical precision was 0·2‰.
Spectro-radiometrical measurements and thermal image acquisition
The normalized difference vegetation index (NDVI) was assessed using a Greenseeker portable spectroradiometer (NTech Industries, Inc., Ukiah, CA, USA). During the 2011/12 season, evaluations were performed at tillering, heading and 2 weeks after anthesis, between 10.00 and 14.00 h, on the same days as for the stomatal conductance measurements. During the 2012/13 season, evaluation was performed at heading. The spectro-radiometer was active; that is, it had its own illumination source in both the red and near infrared (NIR) bands and measured in the red (656 nm) and NIR (770 nm) regions of the electromagnetic spectrum. Wheat canopy reflectance was obtained in order to calculate the formula NDVI = [(NIR770 − R656)/(NIR770 + R656)]. During the measurements, the sensor was carried parallel to the soil surface 0·6 m above the crop canopy; the operator held the trigger down for c. 10 s and walked through each plot maintaining a constant speed. Roughly 30 values were obtained per plot and the data were averaged.
Thermal image acquisition took place at tillering, heading and 2 weeks after anthesis of the 2011/12 season. During the second year, CT was measured again during grain filling. Images were taken with a portable Midas 320L infrared camera (Dias Infrared GmbH, Germany), which has an 8–14 µm spectral range and produces pictures with a spatial resolution of 320 × 240 pixels. Measurements were carried out between 10.00 and 14.00 h on sunny and non-windy days. The operator-held camera was kept a constant 1·5 m away from the canopy, the emissivity was set at 0·95 and the trigger was pushed once the touch-screen showed a complete and clear image. The images were analysed with Pyrosoft Professional Software, averaging the temperature of the canopy area.
Statistical analyses
All the data were analysed using the SPSS v. 16 statistical package (SPSS Inc., Chicago, IL, USA). The effect of different genotypes on the agronomical and physiological parameters was tested with analysis of variance (ANOVA), performed using the general linear model (GLM) procedure. Mean separation of genotypes for the measured parameters was done with a Tukey's-b multiple comparison test (P < 0·05). Series matrices of simple Pearson correlation coefficients were performed based on the different genotype yields and agronomical and physiological traits. For testing the association between grain yield and sets of physiological traits, linear stepwise models across genotypes were constructed with P = 0·05 as the criterion for variables to be either included or removed from the model. The data set was subjected to principle component analysis (PCA) using the correlation matrix in order to standardize each variable and a Varimax rotation was applied to aid interpretation of the parameters.
Broad sense heritabilities (H) were estimated as:
 $$H = \sigma _{\rm g}^2 /(\sigma _{\rm g}^2 + (\sigma _{yx{\rm g}}^2 /r\, + \,(\sigma _{\rm e}^2 /ry))\hfill$$
where σ 2 g, σ 2 yxg and σ 2 e are the estimates of genotype (varieties), genotype × year interaction and error, respectively, r is the number of replicates and y the number of years. The variance component estimates were obtained from the mean squares of the corresponding ANOVA (Johnson et al. Reference Johnson, Robinson and Comstock1955). The standard errors of the estimated heritabilities were obtained as the ratio of standard error of genotypic variance to phenotypic variance (Becker Reference Becker1992). Genetic correlations were estimated for each growing season by performing bivariate analysis of variance, fitting replicate as a fixed effect and variety as a random effect using the ANOVA option of the Statistical Analysis System Process General Liner Model (SAS PROC GLM). The standard error of a genetic correlation was calculated as Falconer & Mackay (Reference Falconer and Mackay1996).
RESULTS
Grain yield and related agronomical components
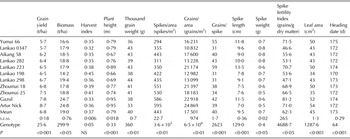
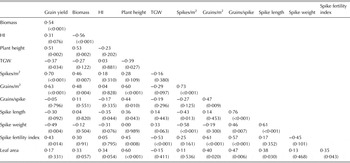
Grain yield ranged between 5·7 and 8·7 t/ha, with the two Spanish controls yielding the most (Table 1). Biomass, plant height, number of spikes and grains/unit ground area were also the highest in the two Spanish controls. For other traits such as HI, TGW, grains/spike, spike length and weight, and leaf area, the values of the Spanish controls did not differ significantly from those of some of the Chinese genotypes. Grain yield was positively related to biomass (r = 0·54, P < 0·001), plant height (r = 0·51, P < 0·01), spikes/unit area (r = 0·70, P < 0·001), and number of grains/unit area (r = 0·63, P < 0·001), and negatively related to spike weight (r = −0·49, P < 0·01) and to a lesser extent TGW (r = −0·37, P < 0·05) (Table 2). The greatest biomass was related to taller plants (r = 0·53, P < 0·01) with the smallest HI (r = −0·56, P < 0·001) and the largest number of spikes/m2 (r = 0·46, P < 0·01). Spike fertility index was positively correlated with grain yield and grains/unit area (r = 0·43; P < 0·05; r = 0·61, P < 0·001). The genotype effect was also significant when the two growing seasons (2011/12 and 2012/13) were combined (sum of squares 92·3, P < 0·001). In addition, year and genotype × year effects were also significant (160·5 and 42·6, respectively, both P < 0·001). Broad sense heritability (H) of grain yield calculated with the 2-year data was 0·50 (Table 3).
Mean values, standard error of means ( s.e.m. ), the genotypic effect evaluated as the sum of squares type III from a combined analysis of variance (Genotype) and significance (P) for grain yield and agronomic yield components of 11 facultative wheat genotypes assayed under high-yielding Mediterranean conditions during the 2011/12 season. For each genotype values are the means of three replications

Pearson correlation coefficients and level of signification P value of grain yield and agronomic yield components across a set of 11 facultative wheat genotypes and three replications per genotype (D.F. = 33) assayed under high-yielding Mediterranean conditions

HI, harvest index; TGW, thousand grain weight.
Broad sense heritability (H) of grain yield (GY), normalized difference vegetation index (NDVI) at heading, leaf chlorophyll content (Chl) at tillering, and heading, and canopy temperature (CT) during the beginning of grain filling, and the correlation coefficients of the genetic correlations (rg ) between GY and the other traits of the table

Photosynthetic and transpiration status
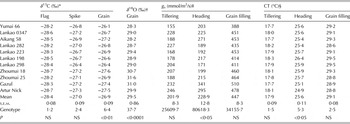
Mean carbon isotope composition (δ 13C) across genotypes was lower in the flag leaf compared with the spike and the grains (Table 4). No genotypic differences existed for the δ 13C of the flag leaf and the spike, whereas the δ 13C of the grains exhibited strong genotypic differences, with the two Spanish cultivars among the four genotypes exhibiting the most negative values. Grain oxygen isotope composition (δ 18O) exhibited strong genotypic differences, with Artur Nick having the highest value among all genotypes. Stomatal conductance (g s) was not significantly different across genotypes at tillering, whereas at heading and grain filling g s was statistically significant across genotypes with the two Spanish cultivars showing the highest values. Canopy temperature (CT) did not exhibit genotypic differences at either tillering or grain filling, whereas at heading the differences across genotypes were significant, (P < 0·05) with the two Spanish cultivars showing the lowest values. In agreement with the lack of genotypic variability, H of CT during grain filling across the two consecutive years was moderate (0·40) (Table 3).
Mean values, standard error of means ( s.e.m.), the genotypic effect evaluated as the sum of squares type III from a combined analysis of variance (Genotype) and significance (P) for water status physiological traits of 11 facultative wheat genotypes assayed under high-yielding Mediterranean conditions during the 2011/12 season. For each genotype values are the means of three replications

NS, not significant.
* Stable carbon isotope composition (δ 13C).
† Stable oxygen isotope composition (δ 18O).
‡ Stomatal conductance (g s) of the last fully expanded leaf.
§ Canopy temperature (CT).
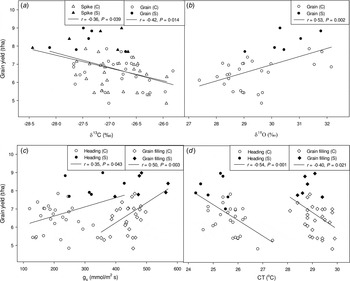
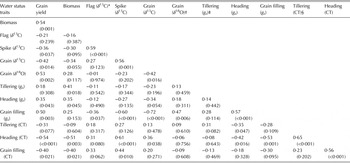
Grain yield in 2011/12 was negatively correlated among genotypes with the δ 13C of grains (r = −0·42, P < 0·05) from the same season (Fig. 1), whereas the relationships with δ 13C of the spike were also negative but weaker and δ 13C of the flag leaf did not correlate (Table 5). The above-ground biomass at harvest did not correlate significantly with δ 13C even when the δ 13C of grains was close to significance (P = 0·055). The grain δ 18O of the first year correlated positively with grain yield of the first year (r = 0·53, P < 0·01) and tended to correlate with above-ground biomass too. The relationship of leaf g s to grain yield increased in strength from tillering to heading and grain filling, reaching significance from heading onwards (r = 0·35, P < 0·05; r = 0·50, P < 0·01, respectively), whereas the opposite pattern occurred for the relationship between g s and biomass, with significant correlations existing with g s at tillering and heading (r = 0·41, P < 0·05 and r = 0·35, P < 0·05, respectively). Canopy temperature correlated negatively with both grain yield and biomass at heading (r = −0·54, P ⩽ 0·001 and r = −0·51, P < 0·01, respectively) and 2 weeks after anthesis (r = −0·40, P < 0·05 and r = −0·40, P < 0·05, respectively). Genetic correlation, calculated using the 2-year data of CT measured at grain filling against grain yield, was negative and of similar magnitude to the phenotypical correlation (Table 3). Only g s at post-anthesis correlated (negatively) with δ 13C, with the strength of the correlation increasing from δ 13C of the flag leaf to that of the grains (r = −0·36, P < 0·05, r = −0·60, P < 0·001 and r = −0·72, P < 0·001, respectively). Grain δ 18O was negatively correlated with δ 13C of grains and positively with grain filling g s (r = −0·42, P < 0·05 and r = 0·47, P < 0·01, respectively). Canopy temperature at heading correlated positively with δ 13C of the spike and to a lesser extent with that of grains (r = 0·61, P < 0·001 and r = 0·36, P < 0·05, respectively), as well as negatively with the g s of the flag leaf at heading and the beginning of grain filling (r = −0·42, P < 0·05 and r = −0·53, P ⩽ 0·001, respectively).
Linear regressions across the set of 11 wheat genotypes and replications grown under high-yielding Mediterranean conditions of grain yield with (a) water status traits, including carbon isotope composition (δ 13C) in spikes and mature grains and (b) oxygen isotope composition (δ 18O) in mature grains, and (c) stomatal conductance (g s) of the flag leaf and (d) canopy temperature (CT) at heading and beginning of grain filling. Data correspond to the 2011/12 season. Open symbols: Chinese genotypes; filled symbols: Spanish controls.

Pearson correlation coefficients and P values of grain yield, biomass and water status physiological traits across the 11 facultative wheat genotypes and three replications per genotype (n = 33) assayed under high-yielding Mediterranean conditions

* Stable carbon isotope composition (δ 13C) of the flag leaf, the spike and grains.
† Stable oxygen isotope composition (δ 18O) of grains.
‡ Stomatal conductance (g s) of the last fully expanded leaf at tillering, heading and mid grain filling.
§ Canopy temperature (CT) at tillering, heading and grain filling.
Nitrogen status and plant growth
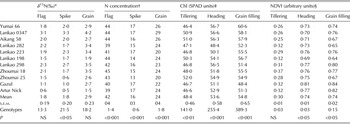
Nitrogen isotope composition (δ 15N) increased from the flag leaf and the spike to the grains (Table 6). Genotypic differences in δ 15N existed for the spike and to a lesser extent for the grains, whereas no differences existed for the flag leaf. In all three organs the lowest means were observed for Artur Nick, whereas the other Spanish control also showed low values compared with most of the other genotypes. Nitrogen concentration was the highest in the flag leaf and the lowest in the spike, with grain N exhibiting values in between. Genotypic differences existed for N concentration for the three plant parts studied. The two controls exhibited N values for the flag leaf and the spike that were lower and higher, respectively, than the majority of Chinese cultivars, whereas the N in grains was close to the mean for the set of genotypes studied. Chlorophyll content of the last expanded leaf increased slightly from tillering to heading and then remained almost unchanged at the beginning of grain filling, with the two last measurements being performed on the flag leaf lamina. Genotypic differences in Chl content were evident at the three measurement times, with the two controls exhibiting relatively lower values than the rest of the genotypes, particularly for the flag leaf during grain filling. The mean values of NDVI increased from tillering to heading and did not change after anthesis. Nevertheless, NDVI for the two controls increased from heading to 2 weeks after anthesis, whereas the Chinese genotypes showed a quite variable pattern. Genotypic differences in NDVI were present at heading and grain filling, with the two controls exhibiting the highest values. Genotypic differences in NDVI also existed at heading for the two growing seasons combined (sum of squares 0·031, P < 0·05). Year effect was also significant (0·156, P < 0·001), but not the genotype × environment interaction. In agreement with the existence of genotypic variability and the lack of genotype × year interaction, H for NDVI at heading across the two seasons was relatively high (Table 3).
Mean values, standard error of means ( s.e.m.), the genotypic effect evaluated as the sum of squares type III from a combined analysis of variance (Genotype) and significance (P) for nitrogen status physiological traits of 11 facultative wheat genotypes assayed under high-yielding Mediterranean conditions during the 2011/12 season

NS, not significant.
For each genotype values are the means of three replications.
* Nitrogen isotope composition (δ 15N).
† Nitrogen concentration (mg N/g dry matter).
‡ Leaf chlorophyll content (Chl) at tillering, heading and grain filling.
§ Canopy normalized difference vegetation index (NDVI) at tillering, heading and grain filling.
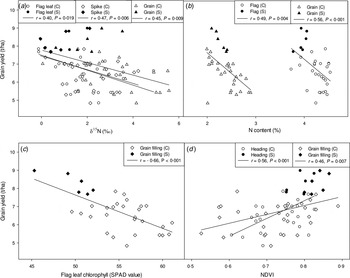
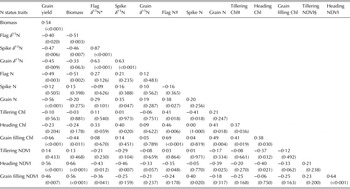
Grain yield was negatively correlated with δ 15N of the flag leaf, the spike and grain (r = −0·40, P < 0·05; r = −0·47, P < 0·01 and r = −0·45, P < 0·01, respectively), as well as with the N concentration of the flag leaf and the grains (r = −0·49, P < 0·01 and r = −0·56, P < 0·001, respectively) (Fig. 2) and the Chl content of the flag leaf during grain filling (r = −0·66, P < 0·001), and positively correlated with the NDVI during heading and grain filling (r = 0·56, P < 0·001 and r = 0·46, P < 0·01, respectively) (Fig. 2; Table 7). Genetic correlation, calculated using the 2-year data of NDVI at heading against grain yield, was positive and high (Table 3). In addition the genetic correlation of the leaf Chl content at tillering and grain filling against grain yield was also negative (Table 3). Biomass at harvest also correlated negatively with the δ 15N of the flag leaf and the spike (r = −0·51, P < 0·01 and r = −0·46, P < 0·01, respectively) as well as with the N concentration and Chl content of the flag leaf (r = −0·51, P < 0·01 and r = −0·44, P < 0·05, respectively), whereas it correlated positively with NDVI during the reproductive stages (r = 0·66, P < 0·001 and r = 0·56, P < 0·001 for heading and grain filling, respectively) (Table 7). The leaf Chl content correlated positively with the N concentration of the flag leaf, particularly when Chl content was measured in the same plant part (flag leaf) and phenological stage (early grain filling) than the N concentration (r = 0·69, P < 0·001). Flag leaf Chl content also correlated positively with the N concentration of grains, but less strongly than that of the N concentration of the flag leaf (r = 0·49, P < 0·01) (Table 7).
Linear regressions across the set of 11 wheat genotypes and replications grown under high-yielding Mediterranean conditions of grain yield with (a) nitrogen isotope composition (δ 15N) in flag leaves, spikes and mature grains, (b) N content in flag leaves and mature grains, (c) flag leaf chlorophyll content at grain filling and (d) the normalized difference vegetation index (NDVI) at heading and grain filling. Data correspond to the 2011/12 season. Open symbols: Chinese genotypes; filled symbols: Spanish controls.

Pearson correlation coefficients of grain yield, biomass and nitrogen status physiological traits across the 11 facultative wheat genotypes and three replications per genotype (n = 33) assayed under high-yielding Mediterranean conditions

* Nitrogen isotope composition (δ 15N) of the flag leaf, the spike and grains.
† Nitrogen concentration (N) of the flag leaf, the spike and grains.
‡ Leaf chlorophyll content (Chl) at tillering, heading and grain filling.
§ Canopy normalized difference vegetation index (NDVI) at tillering, heading and grain filling.
Defining the ideotype: physiological characteristics associated with grain yield and biomass
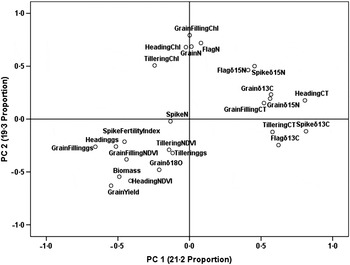
A PCA was performed to assess the contribution of the different physiological characteristics explaining grain yield and biomass across genotypes. The two first principal components explained >0·40 of the total variation (Fig. 3). Grain yield and biomass were close to each other. Both traits were positively associated with green biomass (NDVI) and g s, particularly during the reproductive stage, and positive associations were also found with grain δ 18O and the spike fertility index. However, negative associations with CT and grain δ 13C were found during the reproductive stage, as well as with the δ 15N of the flag leaf, spike and grains. In addition, negative associations were observed with the N concentration and Chl content during the reproductive stage.
Principal component analysis of grain yield, biomass, spike fertility index and the different physiological traits related to the photosynthetic, transpirative and nitrogen status of the crop were set for 11 facultative wheat genotypes grown under high-yielding Mediterranean conditions. Physiological traits included as variables: stable carbon and nitrogen isotope compositions (δ 13C, δ 15N) and nitrogen concentration (N) of the flag leaf, the spike and the grains, the stable oxygen isotope composition (δ 18O) of grains and the chlorophyll content (Chl) and stomatal conductance (gs) of the last developed leaf, and the canopy temperature (CT) and the normalized difference vegetation index (NDVI) at tillering, heading and grain filling.

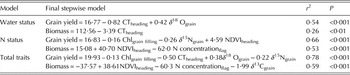
Stepwise analyses were performed with above-ground biomass at harvest and grain yield as dependent variables and the different categories of traits related to either water status, N status or both together as independent traits (Table 8). The main water-status trait, which explained a higher genotypic total biomass and grain yield, was a comparatively low CT at heading. For grain yield, a higher grain δ 18O was included as a second independent factor in the model, explaining 0·54 of the plot variability in grain yield. Concerning the traits related to N status, a higher NDVI at heading, together with a lower N concentration in the flag leaf, were the two factors involved in increased biomass. In contrast, a lower Chl content of the flag leaf at post-anthesis, together with a lower grain δ 15N and a higher NDVI at heading was selected, explaining 0·66 of the variability in grain yield. Combining the two categories of traits, a higher NDVI at heading, together with a lower N concentration of the flag leaf and a lower grain δ 13C, explained nearly 0·60 of the variability in biomass. However, a lower Chl content of the flag leaf, together with a lower CT at heading, as well as a higher δ 18O and a lower δ 15N of grains explained nearly 0·80 of variability in grain yield.
Multiple linear regressions (stepwise) explaining grain yield and biomass variation across genotypes based on traits associated with water status* (upper), N status† (middle) or both (lower) as independent variables

* Traits related to water status and included in the analysis were: the carbon isotope composition (δ 13C) of the flag leaf, the spike and grains, the oxygen isotope composition (δ 18O) of grains, stomatal conductance (g s) of the last fully expanded leaf and canopy temperature (CT) at tillering, heading and the beginning of grain filling.
† Nitrogen status traits were: nitrogen isotope composition (δ 15N) and nitrogen concentration (N concentration) of the flag leaf, the spike and grains and the chlorophyll content (Chl) of the last fully expanded leaf and the canopy normalized difference vegetation index (NDVI) at tillering, heading and the beginning of grain filling.
DISCUSSION
The modern varieties and advanced wheat lines used in the present work represent a set of the most productive wheat germplasm developed over the last 15 years for Henan and other very fertile zones of the wheat zone of the Yellow River and Huai Valleys. These genotypes were grown alongside two modern Spanish controls that attain a grain yield well within the range of values usually recorded for modern wheat cultivars under high-yielding agronomic conditions of the Mediterranean area (Del Pozo et al. Reference Del Pozo, Matus, Serret and Araus2014 and references herein). The grain yield of Chinese wheat was found to be less than the two controls and, with exception of the two ‘Zhoumai’ genotypes, with values clearly below the yield (potential) values reported for the modern (last decade) varieties of Henan and Shandong (Zhou et al. Reference Zhou, He, Sui, Xia, Zhang and Zhang2007; Yang et al. Reference Yang, Guo, Liu, Wang, Wang and Ma2008; Ye et al. Reference Ye, Wang, Zhu, Li and Huang2010; Zheng et al. Reference Zheng, Zhang, Yin, Wang, Han, Chen, Huang, Tang, Xia and He2011; Xiao et al. Reference Xiao, Qian, Wu, Liu, Xia, Ji and He2012). In fact, yields reported in Henan (including some of the Chinese genotypes tested in the present work) reached nearly 9 t/ha, slightly higher than the controls in the present work (Zheng et al. Reference Zheng, Zhang, Yin, Wang, Han, Chen, Huang, Tang, Xia and He2011), whereas the crop duration was comparable. Yumai 66, together with the ‘Lankao’ wheat and Aikang 58 had the lowest grain yield in the present study, which contrasts with studies performed in Henan where the ‘Lankao’ wheat and Aikang 58 were among the top-yielding varieties in trials under high-yielding conditions (Ma et al. Reference Ma, Guo, Wang, Zhu, Song, Wang and Yue2008; Guo et al. Reference Guo, Xu, Feng, Sheng and Zhu2009). Dissecting the causes of the poor performance of the genotypes from Henan under the so-called high yielding Mediterranean conditions is the aim of the present study.
The lower performance of Chinese cultivars under highly productive Mediterranean conditions cannot be attributed to substantial differences in the agronomic conditions of high-yielding trials in Henan in terms of date, density and pattern of sowing (Zhou et al. Reference Zhou, He, Sui, Xia, Zhang and Zhang2007; Zheng et al. Reference Zheng, Zhang, Yin, Wang, Han, Chen, Huang, Tang, Xia and He2011; Xiao et al. Reference Xiao, Qian, Wu, Liu, Xia, Ji and He2012). Moreover, the phenology of Chinese genotypes was similar to the controls. However the low performance in terms of grain yield of Henan genotypes under Mediterranean conditions may also be due to poor adaptation to other environmental conditions that differ between Henan and Spain. In this regard the N fertilization rate in the present study is well within the recommended range for the high-yielding Mediterranean conditions, but below the range of values used in the high-yielding conditions of Henan (Ye et al. Reference Ye, Wang, Zhu, Li and Huang2010; Zheng et al. Reference Zheng, Zhang, Yin, Wang, Han, Chen, Huang, Tang, Xia and He2011).
In the present study the higher yield of the controls was primarily related to a higher green biomass, which was associated with taller plants and more fertile culms/plant. In this sense the heritability of the NDVI at heading and its genetic correlation with grain yield across the 2 years support this statement. This suggests that Henan genotypes experienced sub-optimal conditions during growth. The differences between the controls and the set of Chinese genotypes are discussed below in terms of yield components and physiological characteristics.
Plant ideotype: yield components
In China, probably following the success of ‘super rice’, wheat breeding has targeted a number of traits amenable to visual selection (morphological ideotype) in order to raise yield (Fischer Reference Fischer2007). Among these traits moderate tillering and height, stronger stems (i.e. lodging resistance) and large spikes have been adopted. In the present study, the yield of the two ‘Zhoumai’ genotypes was at a level relatively close to those of the controls, whereas the rest of the Chinese genotypes, including the ‘Lankao’ series, clearly had a lower yield. The ‘Lankao’ genotypes are characterized by large spikes but low tillering, whereas the ‘Zhoumai’ genotypes exhibit a higher-tillering capacity but a lower spike size, closer to the ideotype of the controls. ‘Zhoumai’ genotypes have been reported as exhibiting the highest yield potential in Henan (Zheng et al. Reference Zheng, Zhang, Yin, Wang, Han, Chen, Huang, Tang, Xia and He2011); however no ‘Lankao’ genotypes were included in this previous study.
High-yielding Chinese wheat such as the ‘Lankao’ genotypes have been selected for a low adaptation (in terms of competition for resources) to canopy environment (communalism) and a low capacity to produce fertile tillers in order to perform well under high planting densities (Fischer Reference Fischer, Reynolds, Ortiz-Monasterio and McNab2001, Reference Fischer2007). By producing spikes on only the main and primary culms the average size of the spikes may increase and eventually the size of the grains. Moreover, reduced tillering is likely to be increasingly appropriate with the spread of direct seeding and higher sowing densities (Fischer Reference Fischer2007). In fact, although the ‘Lankao’ and Aikang 58 genotypes produced many tillers, it was at the beginning of stem elongation (GS30–39), when the main and primary culms develop very fast at the expense of the other tillers (Guo et al. Reference Guo, Xu, Feng, Sheng and Zhu2009).
Genetic changes aimed at decreasing the number of non-productive tillers could increase the grains/spike but may cause a decrease in grain yield. It has been reported that reduced tillering boosted spike fertility but decreased the grains/m2 (Duggan et al. Reference Duggan, Richards, Van Herwaarden and Fettell2005; Gaju Reference Gaju2007). In agreement with a higher tillering capacity and thus number of spikes/m2, TGW was lower in the two controls compared with most of the Chinese genotypes. In addition a reduced tillering capacity may limit the acclimation capacity of the crop even to sub-optimal growing conditions represented by mild water stress.
Another factor that characterized most of the Chinese genotypes is their lower spike fertility index, associated with a less compact spike structure, compared with the controls. However breeding for compact spikes is an objective of the present wheat breeding at Henan; this was not the case in past decades (Yang et al. Reference Yang, Guo, Liu, Wang, Wang and Ma2008; Guo et al. Reference Guo, Xu, Feng, Sheng and Zhu2009). This may explain why the Chinese genotypes in the present study (particularly most of the Lankao series), which are characterized by a less compact spike structure, exhibited the lowest spike fertility index.
Plant ideotype: canopy size and Nitrogen utilization
The two controls exhibited a higher biomass, grain yield and total amount of N accumulated in grains based on the unit of N fertilizer supplied than the Chinese genotypes. Differences between the Chinese genotypes compared with the controls may be (at least in part) the consequence of a selection for high N fertilization conditions in the former (Pask Reference Pask2009). Thus N concentration was markedly lower in the flag leaf of the controls compared with the Chinese genotypes. In the same sense, Chl content, which is usually strongly related to N content (Fox et al. Reference Fox, Piekielek and Macneal1994), was also lower in the leaves of controls compared with Chinese cultivars from tillering to grain filling. By contrast the controls exhibited higher NDVI during the same crop period, which means more green area. A trade-off between a lower N (and Chl) content in the leaves and a larger canopy area has also been found in previous studies with a similar set of genotypes under controlled environment pot conditions (Zhou et al. Reference Zhou, Sanz-Sáez, Elazab, Shen, Sánchez-Bragado, Bort, Serret and Araus2014) as well as in field conditions in response to the increasing seed rate (Spaner et al. Reference Spaner, Todd, Navabi, McKenzie and Goonewardene2005). Since total crop photosynthesis is dependent on the ability of the canopy to intercept and capture light for longer, increasing the amount of light captured by the canopy, by improving the rate of early leaf growth and also keeping a larger green area throughout the crop cycle, may contribute to higher crop photosynthesis and yield (Parry et al. Reference Parry, Reynolds, Salvucci, Raines, Andralojc, Zhu, Price, Condon and Furbank2011). This may be the case for the controls where larger canopies (as concluded by the larger NDVI) were evident.
In contrast, no clear differences existed in the N concentrations of the spikes between the controls and most of the Chinese genotypes. Besides its role as a photosynthetic organ during grain filling (Tambussi et al. Reference Tambussi, Bort, Guiamet, Nogués and Araus2007; Sánchez-Bragado et al. Reference Sánchez-Bragado, Elazab, Zhou, Serret, Bort, Nieto-Taladriz and Araus2014), the spike also has a key role in supplying N to growing grains (Lopes et al. Reference Lopes, Cortadellas, Kichey, Dubois, Habash and Araus2006). In fact, the N concentration of the control grains was close to the average value for the whole set of genotypes tested.
The lower flag leaf δ 15N of the controls compared with the Chinese cultivars suggested differences in N metabolism and uptake of N fertilizer. A lower δ 15N value in the most productive genotypes might be the consequence of a more intensive use of a chemical N fertilizer like urea, which was characterized by a low δ 15N (Serret et al. Reference Serret, Ortiz-Monasterio, Pardo and Araus2008).
Differences in water status
Advances in grain yield in Henan Province from 1981 to 2008 have been associated with increased g s during grain filling, with ‘Zhoumai’ genotypes exhibiting the highest values (Zheng et al. Reference Zheng, Zhang, Yin, Wang, Han, Chen, Huang, Tang, Xia and He2011). In the present study the two ‘Zhoumai’ genotypes tended to exhibit higher g s and lower temperatures during grain filling, together with a lower grain δ 13C, among the set of Chinese wheat assayed. Therefore, constitutive differences in stomatal opening appear to exist among Henan genotypes (Zheng et al. Reference Zheng, Zhang, Yin, Wang, Han, Chen, Huang, Tang, Xia and He2011). Besides that, the two controls showed higher g s and lower CT during the reproductive stage and lower δ 13C in grains than the two ‘Zhoumai’ cultivars. Therefore a relatively better water status of the controls compared with the Henan genotypes during the reproductive stage is inferred not only from the higher values of g s in the flag leaf, but also from their lower grain δ 13C and CT. Genotypes with a higher stomatal conductance appear to have a more efficient use of water in terms of the amount of water transpired (Araus et al. Reference Araus, Slafer, Reynolds and Royo2002, Reference Araus, Slafer, Royo and Serret2008; Blum Reference Blum2005, Reference Blum2009), which may result in a higher grain yield under optimal conditions and moderate water stress. Moreover, a lower temperature is also a positive trait in terms of optimizing photosynthesis, while decreasing respiration (Reynolds et al. Reference Reynolds, Delgado B, Gutiérrez-Rodríguez and Larqué-Saavedra2000) and transpiration losses.
The higher grain δ 18O of the more productive genotypes appears at first surprising, since a negative correlation between δ 18O and yield across genotypes has been frequently shown under water stress (Cabrera-Bosquet et al. Reference Cabrera-Bosquet, Sanchez and Araus2009, Reference Cabrera-Bosquet, Albrizio, Nogués and Araus2011; Araus et al. Reference Araus, Cabrera-Bosquet, Serret, Bort and Nieto-Taladriz2013). However, a higher δ 18O in grains may be a consequence of the plant using water enriched with δ 18O during grain filling. An enriched δ 18O of water may be the consequence of higher temperature and then might indicate that plants are able to take up water late in the crop cycle (e.g. during grain filling) when temperature clearly increases, which may cause the uptake of δ 18O enriched water. In fact, in the present study the last irrigation was performed in early June, which corresponded to the second half of grain filling.
Plant height
Plant heights reported in field trials for modern wheat cultivars of Henan (Zheng et al. Reference Zheng, Zhang, Yin, Wang, Han, Chen, Huang, Tang, Xia and He2011) and Shandong (Xiao et al. Reference Xiao, Qian, Wu, Liu, Xia, Ji and He2012) ranged between 0·8 and 0·9 m, somewhat below the 0·95 m achieved by the two controls in the present study. In another study with Henan genotypes (but under drip irrigation hydroponic), mean plant height was 0·83 m (Zhou et al. Reference Zhou, Sanz-Sáez, Elazab, Shen, Sánchez-Bragado, Bort, Serret and Araus2014). Therefore, under the high-yielding growing conditions of China the plant height of Henan genotypes was placed within the optimal plant height range, even if it was on the low side (Richards Reference Richards1992; Fischer Reference Fischer2007). Semi-dwarfism is a trait selected in high-yielding Chinese wheat where the aim has been for them to perform well under very intensive agronomic conditions (in terms of N fertilization and water applied) while preventing lodging. This type of wheat performed well under very high-input (water and fertilization) conditions (Zhou et al. Reference Zhou, He, Sui, Xia, Zhang and Zhang2007; Zheng et al. Reference Zheng, Zhang, Yin, Wang, Han, Chen, Huang, Tang, Xia and He2011; Xiao et al. Reference Xiao, Qian, Wu, Liu, Xia, Ji and He2012).
However, in the present study, all Chinese genotypes except one, exhibited plant heights clearly below (between 0·65 and 0·80 m) the optimal range (0·80–1·00 m). Although the relatively low N fertilization in the present study compared with usual conditions at Henan might cause a decrease in culm length, the decrease (up to 0·15 m) may be caused by other factors. Thus the reduced height may be the consequence of some degree of water stress experienced by the Chinese genotypes, even under high-yielding Mediterranean conditions, which may cause a reduction in the plant height below the range considered as optimal. In fact, reports on modern genotypes from Henan of plant heights between 0·70 and 0·80 m were not uncommon (Zhou et al. Reference Zhou, He, Sui, Xia, Zhang and Zhang2007, Reference Zhou, Sanz-Sáez, Elazab, Shen, Sánchez-Bragado, Bort, Serret and Araus2014). Sub-optimal plant heights in the Chinese cultivars may be associated with reductions in radiation-use efficiency (Li et al. Reference Li, Luo and Ma2011). This may be the cause of Chinese cultivars from Henan having the tendency to suffer yield penalties when certain stresses affect culm growth. In contrast, a canopy exhibiting an appropriate plant height together with proper leaf architecture may improve radiation use efficiency by permitting a light distribution profile that reduces the number of leaves experiencing wasteful and potentially destructive supersaturated light levels, while increasing light penetration to canopy levels where photosynthesis responds linearly to light.
However the fact that HI in the present study was comparable or even higher than the values reported for the Chinese genotypes under adequate agronomic conditions (Zheng et al. Reference Zheng, Zhang, Yin, Wang, Han, Chen, Huang, Tang, Xia and He2011; Xiao et al. Reference Xiao, Qian, Wu, Liu, Xia, Ji and He2012) suggests that Chinese wheat only suffered moderate water stress. Under high-yielding Mediterranean conditions some level of stress may be present, particularly during the second part of the crop cycle (reproductive stage), which may limit the growth of the culms.
Optimization of light and N distribution in the canopy may ensure not only higher yield potential (Long et al. Reference Long, Zhu, Naidu and Ort2006; Mussgnug et al. Reference Mussgnug, Thomas-Hall, Rupprecht, Foo, Klassen, McDowall, Schenk, Kruse and Hankamer2007) but also a better performance under sub-optimal conditions (which is frequently the case for high-yielding Mediterranean conditions). In fact modern cultivars selected for Mediterranean conditions are tall semi-dwarf, with plant heights somewhat higher than in the case of Chinese genotypes, and then amenable to some degree of reduction under water stress (Del Pozo et al. Reference Del Pozo, Matus, Serret and Araus2014).
CONCLUSIONS
The traits associated with the higher grain yields in the Spanish control cultivars compared with the Chinese cultivars appear to be higher harvest biomass, in turn linked to increased plant height and spike density. Chinese genotypes from Henan were characterized by a low tillering capacity and short stature since they have been selected for highly intensive agronomic (fertilization and irrigation) conditions. This may confer to these genotypes a low capacity of acclimation to less favourable conditions, making them prone to yield penalties even under moderate water stress conditions and/or with N fertilization levels somewhat lower than in Henan. In fact, under the conditions of the present study, Chinese genotypes exhibited poorer water status and lower N utilization compared with the controls. Another factor that has contributed to a lower grain yield of the Chinese genotypes is a lower spike fertility index, associated with a less compact spike structure than the controls.
For Chinese genotypes the present study does not support the conclusion that a high yield potential will translate directly to increased yield under less favourable (even moderate stress) conditions. Nevertheless genetic variability existed among the Chinese genotypes in terms of acclimation to sub-optimal conditions.
This work was supported by the FP7 European Project OPTICHINA (grant agreement number: 266045) and the Spanish project AGL2013-44147-R. Authors acknowledge Henan Tianmin Seed Co., Ltd, for its support.