
Introduction
Piezoelectric materials have long been investigated due to their unique characteristic of converting mechanical stress into electric charges and vice versa.[ Reference Sebastian and Jantunen 1 , Reference Xu, Yang, Zeng, Houghton, Wang, Murthy, Kim, Lin, Mignolet, Duan, Yu, Slepian and Jiang 2 ] Of the piezoelectric polymers and ceramics, poly(vinylidene fluoride) (PVDF) and barium titanate (BT) have seen wide applications in electronics, sensing/energy harvesting, and bioengineering.[ Reference Salimi and Yousefi 3 – Reference Kim, Shuvo, Karim, Noveron, Tseng and Lin 5 ] The combination of these two materials yields both excellent mechanical and piezoelectric properties so that BT/PVDF nanocomposites are attractive for energy harvesting and sensor applications due to their simple and convenient fabrication process, low cost, and excellent properties.[ Reference Jiang, Ye, Yu, Wu, Li, Xu and Xie 6 , Reference Kim, Torres, Wu, Villagran, Lin and Tseng 7 ] However, it has an intrinsic low direct piezoelectric coupling coefficient, which is a drawback with regard to the piezoelectric effect and sensor applications.[ Reference Kim, Torres, Wu, Villagran, Lin and Tseng 7 – Reference Kim, Torres, Villagran, Stewart, Lin and Tseng 9 ] Therefore, graphitic carbon such as graphene oxide or multiwall carbon nanotubes (MWCNTs) has been utilized to enhance both electric and stress transfer to the ceramic particles and uniform dispersion.[ Reference Ahn, Lim, Hong, Lee, Ha, Choi and Seo 10 – Reference Kim, Zhu, Qu, Aaronson, McCall, Chen and Sirbuly 12 ] In order to better enhance stress reinforcing, it is studied that a 3-trimethoxysilylpropyl methacrylate (TMSPM) linker molecular is covalently grafted on the BT particle surface. This surface modification of covalent bonding showed higher piezoelectricity than a graphitic carbon network.[ Reference Kim, Zhu, Qu, Aaronson, McCall, Chen and Sirbuly 12 ] In addition, there are several traditional methods for preparing BT/PVDF nanocomposites such as spin-coating, and hot-embossing. Nonetheless, these methods entail complicated and time-consuming processes, quality issues, etc.[ Reference Kim, Fernando, Li, Lin and Tseng 8 ] Recently, additive manufacturing technology has been introduced to printing piezoelectric three-dimensional (3D) structures.[ Reference Kim, Torres, Wu, Villagran, Lin and Tseng 7 , Reference Kim, Fernando, Li, Lin and Tseng 8 , Reference Lee and Tarbutton 13 ] It is reported that the fused deposition modeling (FDM) 3D printing process significantly improves homogeneous dispersion of BT nanoparticles in the PVDF matrix, enhancing piezoelectric properties.[ Reference Kim, Fernando, Li, Lin and Tseng 8 ] In addition, the FDM 3D printing technique is integrated with corona poling, which is one of the traditional poling processes, to simplify fabrication of piezoelectric PVDF films through sequential processes.[ Reference Kim, Torres, Wu, Villagran, Lin and Tseng 7 ] Kim et al. invented a 3D printing technique to optically fabricate photosensitive polymer-based BT nanocomposites with surface modification.[ Reference Kim, Zhu, Qu, Aaronson, McCall, Chen and Sirbuly 12 ] A photoliable polymer was induced to encapsulate piezoelectric nanoparticles during photo-polymerization. This technique can produce a 3D structure of piezoelectric nanocomposites but is limited to combination with photosensitive polymers.
Herein, we report FDM 3D printing of MWCNTs/BT/PVDF nanocomposite films, where BT ceramic nanoparticle fillers and a PVDF polymer matrix are used as piezoelectric constituents and MWCNTs as electrical and mechanical transfer network in the system for stress reinforcing, dispersant, and conducting function for nanoparticles. Various BT (0–18 wt%) and MWCNTs (0–0.4 wt%) weight percentages are tested by SEM, XRD, Fourier transform infrared spectroscopy (FTIR), fatigue load frame, and human hands to analyze piezoelectric properties for use in the pressure sensor.
Experimental details
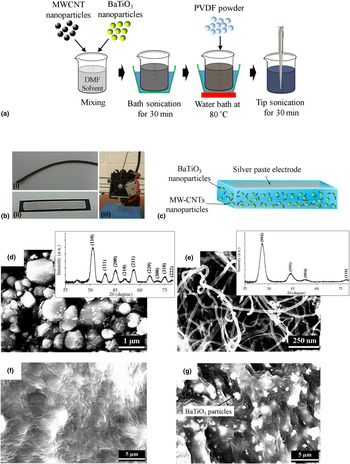
To fabricate continuous nanocomposites filament for printing, commercial PVDF powder (MW~534,000; Sigma-Aldrich, USA), BT powder (700 nm; Inframat®, USA), and MWCNTs powder (diameter: 8–15 nm, length: 10–50 µm, Cheaptubes®, USA) are mixed with N-dimethylformamide solvent (DMF, OmniSolv®, USA) via the solvent-casting method. As a schematic illustration of the synthesis process is shown in Fig. 1(a), the BT and PVDF powder are mixed via a solvent-casting process which is an alternative method of mechanical mixing for uniform distribution of BT nanoparticles. The solution is prepared by dissolving PVDF powder in DMF solvent (1:10 weight ratio). The solution is then placed in a water bath at 80 °C and is stirred using a magnetic stir bar at 300 rpm for approximately 30 min. After the PVDF powder fully dissolves, BT powder is introduced to the solution. This attained nanocomposite solution is then heated and stirred using the same parameters for approximately 15 min. BT build up at the bottom of the solution is addressed by ultra-sonication (Branson Sonifier 450) for 20 min. DMF solvent is then evaporated by dispersing nanocomposites solution onto a glass substrate and heated to a temperature of 80 °C for 12 h. The procedure yields a thin sheet of BT/PVDF nanocomposite, and these casted nanocomposites are sliced down to be easily extruded by filament extruder machine (Filabot). The diameter of the extruded filament and extruding temperature are 2.9 mm and 195 °C, respectively. These resultant thin sheets of nanocomposites are sliced down to be easily extruded by a filament extruder machine (Filabot®) and the nanocomposite filament [see Fig. 1(b)-i] is used to 3D print a thick film by a FDM 3D printer (Lulzbot® Taz 5) for a pressure sensor application [see detail in online Supplementary Method S1 and Figs. 1(b)-ii and 1(b)-iii]. This filament extrusion and 3D printing processes are proved in the literature to provide better dispersion of nanoparticles in the matrix than solvent-casting, therefore enhancing piezoelectric and mechanical properties.[ Reference Kim, Fernando, Li, Lin and Tseng 8 ]
(a) Schematic illustration of the synthesis process for MWCNT/BT/PVDF nanocomposites; (b) (i) extruded nanocomposite filament, (ii) 3D printed nanocomposite film device covered with silver paste, and (iii) FDM 3D printer; (c) schematic illustration of the printed nanocomposite sensor device, and SEM images of (d) BT nanoparticles (the inset shows XRD analysis for BT nanoparticles), (e) MWCNT (the inset shows XRD analysis on MWCNT), (f) 0.4 wt%-MWCNT/PVDF, and (g) 0.4 wt%-MWCNT/18 wt%BT/PVDF.

Results and discussion
The printed nanocomposites film is depicted in Fig. 1(c). BT particles and PVDF polymer are not compatible with each other because of their respective hydrophobic and hydrophilic characteristics, so the combinations of these two offer a low-stress transfer efficiency between the ceramic nanoparticles and the polymer matrix.[ Reference Kim, Torres, Villagran, Stewart, Lin and Tseng 9 , Reference Shen, Chang, Hsieh, Li, Chiang, Yang and Yip 14 ] MWCNTs are dispersed in this nanocomposites for stress reinforcing and conducting functional agents between BT particles and the PVDF polymer.[ Reference Park, Lee, Liu, Moon, Hwang, Zhu, Kim, Kim, Kim and Wang 11 , Reference Mandal and Nandi 15 ] Although MWCNTs are still hydrophobic, active mechanical stress reinforcing between the BT and PVDF will be significantly caused when applying external stress.[ Reference Park, Lee, Liu, Moon, Hwang, Zhu, Kim, Kim, Kim and Wang 11 , Reference Kim, Zhu, Qu, Aaronson, McCall, Chen and Sirbuly 12 ] These agents can efficiently load external stress onto BT particles through the PVDF matrix and the piezoelectric charges generated by BT particles are conducted through MWCNTs.[ Reference Ahn, Lim, Hong, Lee, Ha, Choi and Seo 10 ]
The morphology and crystalline structure of the materials are analyzed by scanning electron microscopy (SEM, TM-1000, Hitachi) and x-ray diffraction (XRD, D8 Discover diffractometer, Bruker). SEM images and spectra in Figs. 1(d) and 1(e) demonstrate commercially purchased pure BT nanoparticles and MWCNTs. Figures 1(f) and 1(g) indicate the well-distributed MWCNTs and agglomeration of BT nanoparticles are observed to increase as its percentage increases in the PVDF matrix (see details in Fig. S2).
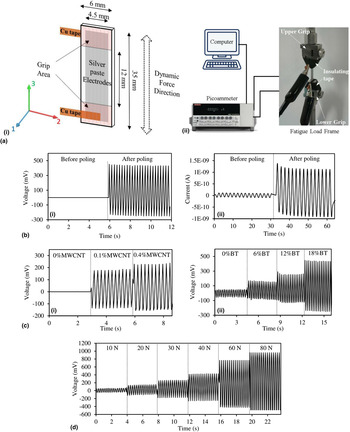
For piezoelectric property analysis, piezoelectric output voltage and current in a fatigue load frame (Bose ElectroForce-BioDynamic, TA Instruments) are measured by Voltmeter (InstruNet i-400), and Pico ammeter (Keithley 6485) as shown in Fig. 2(a)-ii.[ Reference Kim, Torres, Wu, Villagran, Lin and Tseng 7 , Reference Kim, Fernando, Li, Lin and Tseng 8 ] The sample can be fabricated with a large area, but due to the geometry of the fatigue grip, nanocomposites samples were printed with dimensions of 6 × 35 × 0.55 mm3 as shown in Fig. 2(a)-i. To quantify the piezoelectric property of the printed film, samples are prepared with silver conductive paint electrodes on both surfaces. The electrodes are then attached with copper (Cu) tape to allow a proper connection to the Pico ammeter as shown in Fig. 2(a)-ii. Cyclic force is applied on the printed nanocomposites to measure periodic output current and voltage; the fatigue load frame generated 30 cyclic loads on the sample at 0.5–4 Hz, while the Pico ammeter measured the current output.[ Reference Kim, Fernando, Li, Lin and Tseng 8 ] To prevent noise and artifacts from the fatigue machine during measurement, the two grips handling the film are covered with electrical insulating tape.
(a) Schematic illustration of (i) sample design and (ii) experimental setup for piezoelectric output measurement, (b) the measured (i) voltage and (ii) current output results generated by 0.4 wt%-MWCNT/18 wt%-BT/PVDF under 40 N before and after electric poling, (c) voltage output results generated by (i) various MWCNTs content of 12 wt%-BT/PVDF and (ii) various BT particle contents of 0.4 wt%-MWCNT/PVDF under 40 N, and (d) voltage output results generated by 0.4 wt%-MWCNT/18 wt%-BT/PVDF under various forces (10, 20, 30, 40, 60, and 80 N).

Electric poling is applied under 5.4 MV/m for 15 h to the printed nanocomposite films after 3D printing fabrication. Note that the three samples for each nanocomposite are tested for FTIR analysis and output electricity. Figure 2(b)-i and ii show output voltage and current produced by the printed nanocomposites film before and after the electric poling process. The amplitude of voltage outputs generated from the nanocomposite films before and after poling treatment increases from ±0 to ±340 mV and current outputs from ±0.084 to ±0.94 nA. BT nanoparticles dispersed in the matrix should be polarized through the post-poling process. This result indicates that electric poling has activated piezoelectricity of the BT particles and that the BT particles and MWCNTs are mechanically and electrically interacting with each other. Charges generated from BT particles and PVDF due to the MWCNTs interaction can be efficiently transferred to external electrodes through the conductive channel of MWCNTS. Figures 2(c)-i and 2(c)-ii indicate results of voltage outputs produced by various MWCNTs and BT nanoparticles percentages. In Fig. 2(c)-i, 12 wt%-BT/PVDF nanocomposites film is characterized without MWCNTs to study the role of MWCNTs within the printed nanocomposites. No reliable output signal is observed. However, with an increase in MWCNT content, the output voltages increased by ±192 mV under 0.4 wt%-MWCNTs, which is the maximum percentage over which electrical breakdown occurs during electrical poling. For electrical poling process, the least amount of coercive electric field for BT particles about 0.5–1.6 MV/m is required.[ Reference Kim, Torres, Villagran, Stewart, Lin and Tseng 9 , Reference Nagata and Kiyota 16 ] However, the breakdown strength lowers down as MWCNTs increase and 0.4 wt%-MWCNTs content is a limitation before experiencing a breakdown. This increase of the voltage amplitude indicates that MWCNTs play a significant role as a stress reinforcing agent within the nanocomposites. In Fig. 2(c)-ii, when there are 0.4 wt%-MWCNTs in the PVDF matrix and no BT nanoparticle content, the piezoelectric output voltage generated is ±49 mV. This is because PVDF β-phase was formed on high-specific surface areas of MWCNTs.[ Reference Ahn, Lim, Hong, Lee, Ha, Choi and Seo 10 ] As BT particle content increases, the voltage output increases up to ±340 mV at 18 wt%-BT, which is the maximum percentage of BT content that can be extruded in the FDM 3D printer nozzle. With 0.4 wt%-MWCNTs/18 wt%-BT/PVDF film (which showed the highest generated output voltage), output voltages were measured under various external forces applied by fatigue load frame. Figure 2(d) shows that a higher amplitude of output voltages was produced at higher external forces, increased by ±725 mV under 80 N.
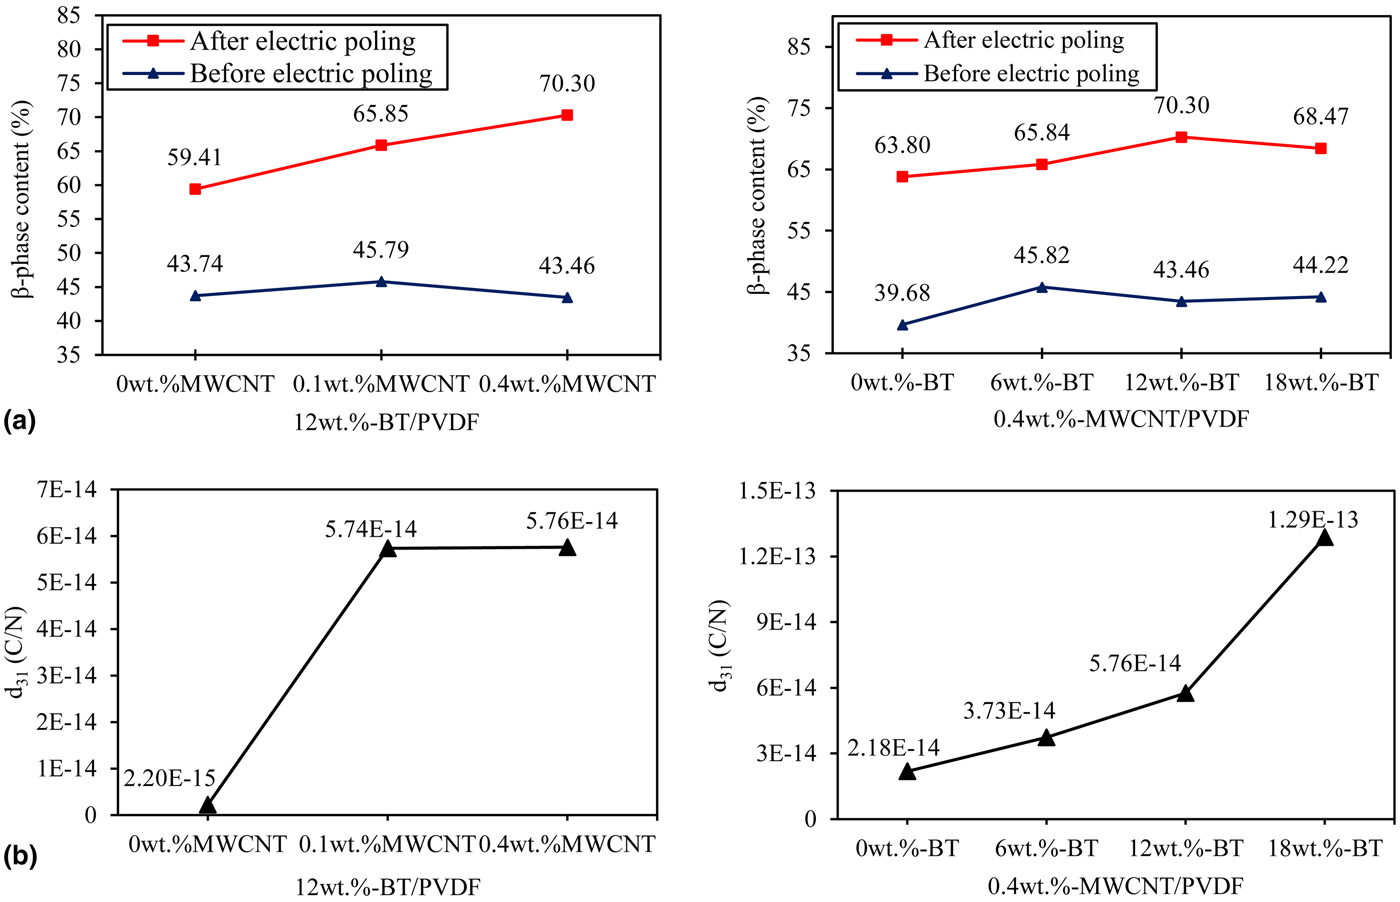
FTIR (Agilent Technologies Cary 630 ATR-IR) analyses are performed in the 600–1600 cm−1 wavenumber range at room temperature to characterize the degree of crystallinity of α- and β-phases of the PVDF before and after the electric poling process.[ Reference Cai, Lei, Sun and Lin 17 – Reference Matsushige, Nagata, Imada and Takemura 19 ] IR absorption bands at 766 and 840 cm−1, which are, respectively, characteristic of α- and β-phases, are observed for analysis of the phase transformation. Based on the results of the IR absorption bands (see Fig. S3), the β-phase contents of each printed nanocomposite film are calculated as described in online Supplementary Method S2. In Fig. 3(a), β-phase contents significantly increased after electric poling and as MWCNTs increased by 70.3% of β-phase at 0.4 wt%-MWCNTs/12 wt%-BT/PVDF. It is certain that MWCNTs led to a high degree of conversion from α- to β-phases. Under the same amount of MWCNTs (0.4 wt%), the analysis of β-phase contents showed an increasing trend as BT particles were increased.
(a) β-Phase contents of the printed nanocomposites with various MWCNTs and BT particle contents before and after electric poling process and (b) piezoelectric coefficients (d 31) of the printed nanocomposites with various MWCNTs and BT particles contents.
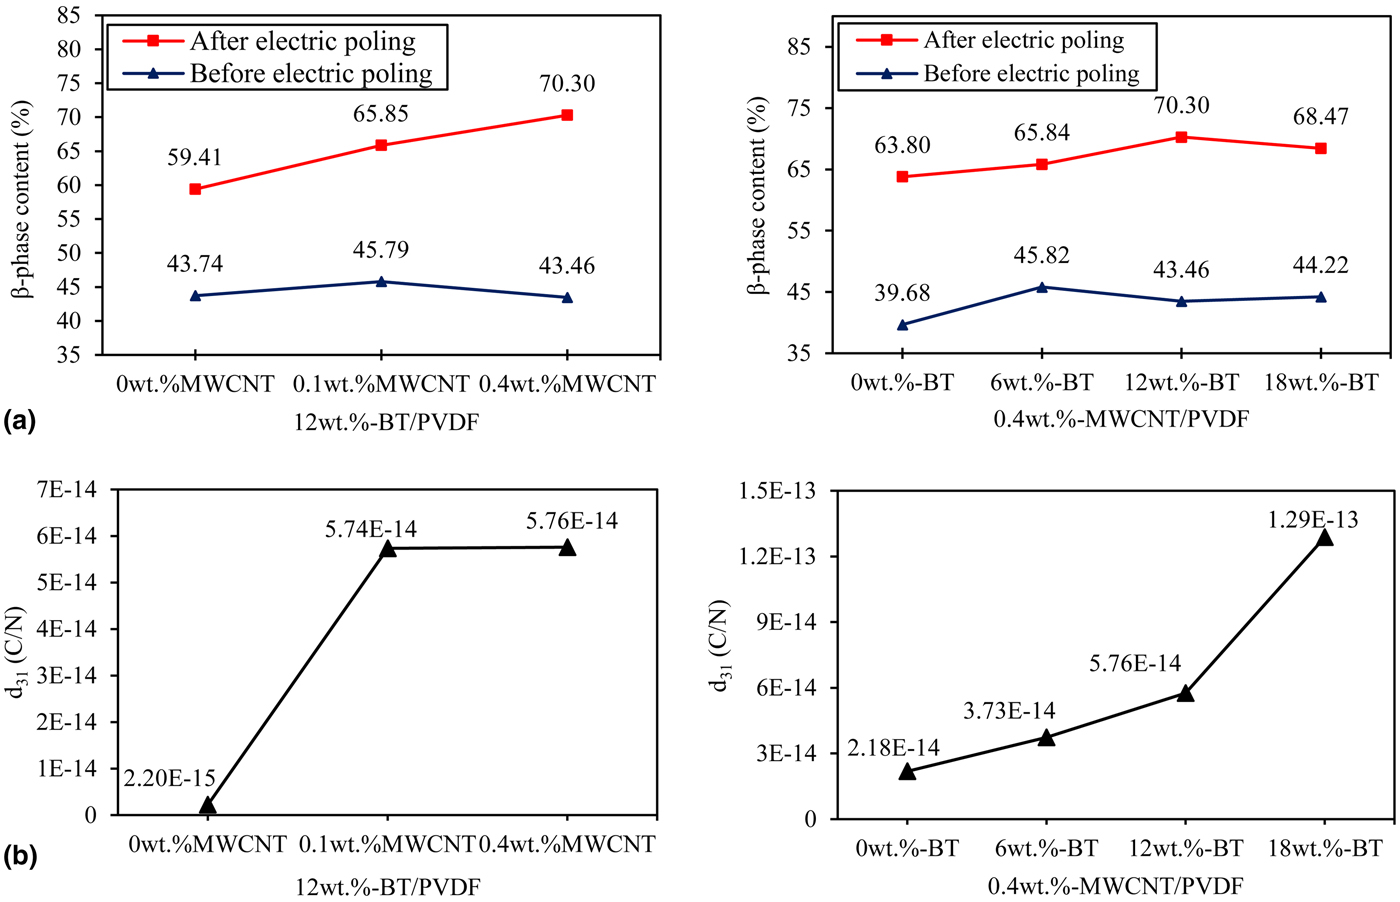
Based on the voltage output results of Figs. 2(c)-i and 2(c)-ii, piezoelectric coefficients (d 31) of each printed nanocomposite film are calculated with various compositions using measured relative permittivity (Table S1). The detailed calculation procedure is described in online Supplementary Method S3. In Fig. 3(b), d 31 has significantly increased from 0.002 to 0.058 pC/N when MWCNTs’ content increases under 12 wt%-BT. This indicates that the addition of MWCNTs enhances the performance of stress reinforcing between BT particles and the matrix. Under the same amount of MWCNTs (0.4 wt%), d 31 is tested with various percentage of BT particles. The result indicates that the d 31 increases from 0.022 (0 wt%-BT) to 0.13 pC/N (18 wt%-BT) as BT particles increase, a 492% increase.
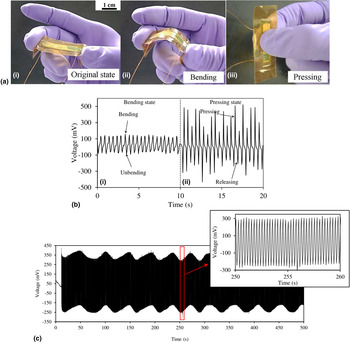
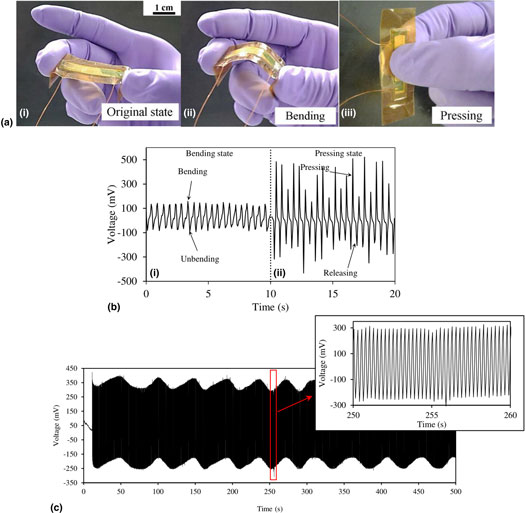
To further demonstrate the piezoelectric sensor application, the feasibility of using printed piezoelectric nanocomposites for pressure sensor application was demonstrated. The output voltage signal is measured when bending (90°) and pressing (40–50 N) by human fingers shown in Fig. 4(a)-i shows the printed nanocomposites film and hands covered, respectively, by Kapton film and gloves, to exclude external electrostatic charges. Two Cu wires attached on both silver electrodes are extended to connect to the data acquisition machine. In Fig. 4(a)-ii, upon bending the sample, the output voltage was measured to be ±120 mV. Upon pressing in the middle of the sample, the amplitude of the output voltage increased to ±435 mV at most. In Fig. 4(c), durability test is implemented at 4 Hz frequency for 2000 cycles to confirm the mechanical stability of the printed nanocomposite film. The amplitude of voltage output remains constant after 2000 cycles. The printed film also shows the same piezoelectric stability after 3 days. The bottom inset of Fig. 4(c) shows the magnified voltage signal from 250 to 260 s.
(a) Optical images of the printed nanocomposite sensor device in (i) original, (ii) bending, and (iii) pressing states; (b) the measured voltage output signals of 0.4 wt%-MWCNT/18 wt%-BT/PVDF film generated by (i) bending and (ii) pressing motions by human fingers, (c) the durability test result of 0.4 wt%-MWCNT/18 wt%-BT/PVDF film under 2000 periodic cycles (4 Hz) using fatigue load frame.

Conclusion
MWCNT/BT/PVDF nanocomposite film is printed by FDM 3D printing technique for use in sensor applications. The FDM 3D printing technique can simplify fabrication process of the piezoelectric film with lower cost and greater design flexibility compared with traditional fabrication processes. Various BT and MWCNTs percent nanocomposite films were printed, characterized, and tested by SEM, XRD, FTIR, fatigue load frame, and human finger to ensure the piezoelectric performance. It is demonstrated that MWCNTs play important roles of transforming PVDF α- to β-phase and enhancing the efficiency of mechanical to electrical conversion between the BT and PVDF interfaces. The increasing MWCNTs’ percent in the system results in an increase in electrical output, which indicates that the increased surface areas of the MWCNTs interact well with the BT nanoparticles, therefore providing a stress reinforcing effect between the BT and PVDF. In addition, increasing the BT particles’ percent in the system showed an increase in electrical output by ±340 mV under 40 N and ±725 mV under 80 N at 18 wt%. Piezoelectric coefficient (d 31) is calculated and the results show good agreement with electrical output generated by the printed nanocomposite films. The highest d 31 is 0.13 pC/N at 0.4 wt%-MWCNTs/18 wt%-BT/PVDF, comparable with pure BT ceramic. By bending and pressing with fingers, the printed film generates about ±120 and ±435 mV, respectively. The mechanical stability of the printed nanocomposite film is proved by durability test for 2000 cycles without any amplitude changes. These results demonstrate feasibility in its commercial application. These compounds and the FDM 3D printing technique are expected to broaden the use of additive manufacturing to print piezoelectric nanocomposite device for sensor applications.
Supplementary material
The supplementary material for this article can be found at https://doi.org/10.1557/mrc.2017.126.
Acknowledgments
This work is supported by the National Science Foundation (NSF) under NSF-PREM Grant No. DMR-1205302 and partially supported by the National Science Foundation (DUE-TUES-1246050).