1. Introduction
When the recent global financial crisis impacted real economies, policy-makers worldwide turned to fiscal policy to try to sustain production and employment. Subsequently, the sign of fiscal policy changed in many advanced countries, especially in the Euro area, as several governments switched to fiscal consolidation measures in an attempt to improve public finance conditions. This occurred despite many economies still experiencing weak conditions and with conventional monetary policy largely hampered by reaching zero interest rates. A large and heated debate ensued among economists and policy-makers on the effects of such policies, with predictions ranging from minimal and short-lived recessionary effects or even expansionary outcomes, the latter based on the so-called expansionary austerity theory (e.g. Alesina and Ardagna (Reference Alesina and Ardagna>2010)), to deep and long-lasting recessionary effects, with eventual hysteretic dynamics leading to very persistent/permanent falls in current and potential GDP (e.g. DeLong et al. (Reference DeLong, Summers, Feldstein and Ramey>2012)).
Since then, the last decade has seen a kind of renaissance in fiscal research, with a growing body of literature seeking to shed more light on fiscal policy by studying its macroeconomic effects through new and improved econometric techniques applied to better data (Ramey (Reference Ramey>2019)). This fresh vein of research has been particularly characterized by the progressive spread of nonlinear models aimed at empirically testing the intuition that the effects of fiscal policy may change depending on the state of the economy. Most of this literature has focused on fiscal multipliers, evaluating whether they vary by the state of the economy, especially in the case of public expenditure shocks. In particular, akin to the current paper, a first strand of literature has analyzed whether fiscal multipliers are higher in slack economic situations or recessions than in good economic situations or expansions (e.g. Auerbach and Gorodnichenko (Reference Auerbach and Gorodnichenko>2012), (Reference Auerbach and Gorodnichenko>2013); Ramey and Zubairy (Reference Ramey and Zubairy>2018)). A second strand of literature has focused, instead, on the interaction between fiscal and monetary policy, trying to assess whether public spending multipliers are higher in periods of zero-lower bound (e.g. Christiano et al. (Reference Christiano, Eichenbaum and Rebelo>2011); Miyamoto et al. (Reference Miyamoto, Nguyen and Sergeyev>2018); Bonam et al. (Reference Bonam, De Haan and Soederhuizen>2022)). Another strand of literature has focused on comparing multipliers between normal and financial crisis periods (e.g. Corsetti et al. (Reference Corsetti, Meier and Müller>2012); Ferraresi et al. (Reference Ferraresi, Roventini and Fagiolo>2015)). State dependency has been further evaluated by looking at the level of public finance distress, generally controlling for the public debt/GDP ratio (e.g. Perotti (Reference Perotti>1999); Corsetti et al. (Reference Corsetti, Meier and Müller>2012)), or by looking at private sector financial indebtedness (e.g. Bernardini and Peersman (Reference Bernardini and Peersman>2018)). Finally, the effectiveness of fiscal policy has been evaluated on the basis of demographic characteristics, such as population aging (Basso and Rachedi (Reference Basso and Rachedi>2021); Miyamoto and Yoshino (Reference Miyamoto and Yoshino>2022)).
This research effort has led to substantial advances in the methodologies and understanding of fiscal policy, with the merit of placing state dependency at the core of the analysis. However, a broad consensus on the macroeconomic effects of fiscal policy has not yet emerged. For example, very relevant issues such as whether public spending multipliers are lower or higher than one, on average, and whether they vary depending on the state of the economy remain widely debated in the literature, with conflicting empirical evidence (cf. Section 2). This is clearly unsatisfactory and urgently calls for more work on these relevant issues. This appears even more true, as several preceding analyses on state-dependent fiscal multipliers have recently been questioned for some methodological features (cf. Ramey and Zubairy (Reference Ramey and Zubairy>2018)), making the contribution of new analyses based on the most recent methodological improvements even more crucial.
The paper fits into this recent debate estimating public consumption multipliers and whether they vary by the slack of an economy. To this end, I apply linear and smooth-transition panel local projections to a data set composed of quarterly data on nine selected Euro area countries for the period 1999Q1−2018Q4. Following the “best practices” suggested by Ramey (Reference Ramey>2019), I compute fiscal multipliers in a cumulative way and use ex-ante conversion factors. Both methodological aspects are particularly relevant, especially to properly compare fiscal multipliers across different states (cf. Ramey and Zubairy (Reference Ramey and Zubairy>2018)). Several robustness checks were also carried out, including alternative indicators of slack and the inclusion of the forecasts in the model to control for fiscal foresight. Finally, some linear and state-dependent transmission channels of public consumption shocks are investigated.
The analysis contributes to the literature in at least three ways. First, as most of the state-dependent analyses have thus far focused either on the USA or on a set of advanced countries, there is an evident lack of research focused on the Euro area. The analysis contributes to filling this gap. Second, most of the studies have focused on public spending as a whole, considering public consumption and investment together. This study is less aggregate, as it focuses exclusively on public consumption. Finally, in contrast to several preceding studies, the paper builds upon the most recent methodological improvements, providing empirical results based on solid and fresh methodologies.
Regarding the results, I find that, not conditioning on the state of the economy, public consumption multipliers are approximately 1.3 in the medium term. This result is also confirmed excluding the post-crisis period and the periods of possible zero lower bound from the sample, indicating that these specific circumstances hardly explain my findings. Instead, I find strong evidence that the size of the multiplier varies according to the state of the economy. Particularly, the results show that the size of the public consumption multiplier is extremely different in slack and good periods, with a value generally below 0.5 in the good regime and around or above 2.0 in the slack regime. These results hold for all the variables used to capture the state of the economy, thus appearing extremely robust along this dimension. The state-dependent reactions of private consumption and investment largely inform these results, while they do not seem to be explained by differences in the way in which shocks are financed or in the reaction of the long-term real interest rate in the two regimes of the economy. This suggests more structural explanations behind these results.
The rest of the paper is organized as follows. Section 2 provides a brief literature review of the linear and state-dependent fiscal multipliers connected to public spending as a whole and to public consumption. In line with the objective of the paper, the review on state dependency is limited to the evidence relating to multipliers in periods of slack/recession and multipliers in good periods/expansionFootnote 1. In Section 3, I present the baseline model specifications and the data. Section 4 shows the linear and state-dependent public consumption multiplier estimates. Section 5 focuses on the fiscal foresight problem, how I address it, and how this affects estimates. In Section 6, some linear and state-dependent transmission channels of public consumption shocks are investigated. Section 7 concludes.
2. Review of the Empirical Evidence
Considering public spending as a whole, what does the empirical evidence tell us about the size of the multiplier? A first comprehensive answer to this question can be found in Ramey (Reference Ramey>2011a), which, based on a survey of the empirical literature available at that time, concludes that a reasonable range is between 0.8 and 1.5. Gechert and Rannenberg (Reference Gechert and Rannenberg>2018) extend the analysis to a broad set of empirical studies, finding a mean value of 0.9 and a sizable standard deviation of 0.8. Several reasons may explain this huge variability, ranging from the structural characteristics of the countries on which multipliers are estimated (Ilzetzki et al. (Reference Ilzetzki, Mendoza and Végh>2013))Footnote 2 to the definition of multipliers adopted, which may dramatically affect the estimates of the multiplier (cf. Ramey (Reference Ramey>2019)). In this regard, Ramey (Reference Ramey>2019) finds that when multipliers are computed in a cumulative way, which is likely the more convincing approach (cf. Mountford and Uhlig (Reference Mountford and Uhlig>2009))Footnote 3, the bulk of the empirical estimates shrink to the narrower range of 0.6−1.0. Cumulative multipliers outside this range and above one, in any case, are found in several analyses, such as Ben Zeev and Pappa (Reference Ben Zeev and Pappa>2017) and Deleidi (Reference Deleidi>2022).
However, few studies have analyzed public consumption explicitly. Among them, Burriel et al. (Reference Burriel, De Castro, Garrote, Gordo, Paredes and Pérez>2010) estimate cumulative public consumption multipliers for the Euro area, as a whole, and for the USA, finding multipliers above 1.0 in the first case and approximately 0.5 in the second case; Auerbach and Gorodnichenko (Reference Auerbach and Gorodnichenko>2012) find a public consumption multiplier of 1.2 for the United States; Ilzetzki et al. (Reference Ilzetzki, Mendoza and Végh>2013) estimate cumulative public consumption multipliers for a large set of countries, concluding that the size of the multipliers is between 0.3 and 0.7 for high-income countries; Boehm (Reference Boehm>2020) finds a value of 0.8 for the cumulative multiplier, using a panel of OECD countries; Deleidi (Reference Deleidi>2022) estimates cumulative public consumption multipliers above 2.0 for Italy, and Deleidi et al. (Reference Deleidi, Romaniello and Tosi>2021b) finds cumulative public consumption multipliers in the range of 2.0, using regional Italian dataFootnote 4.
The results reported above refer to linear multipliers. What about state dependency? In particular, what does the literature tell us about the size of the multipliers in slack/recession and in good/expansion periods? In this regard, a very influential contribution is provided by Auerbach and Gorodnichenko (Reference Auerbach and Gorodnichenko>2012), who apply a smooth-transition SVAR model to the US data and find that government spending multipliers are much higher in recession periods (2.5) than in expansion periods (0.3). This conclusion is also confirmed for public consumption, with a multiplier of approximately 2.1 in recessions and 0.5 in expansions. By applying a panel smooth-transition local projections model to a set of OECD countries, Auerbach and Gorodnichenko (Reference Auerbach and Gorodnichenko>2013, Reference Auerbach and Gorodnichenko>2017) confirm the evidence of state-dependent public spending multipliers for a broader set of countries and definitions of slack of an economy. Batini et al. (Reference Batini, Callegari and Melina>2012) estimate a threshold SVAR on a group of countries (United States, Japan, France, Italy, and Euro Area as a whole) and find that multipliers, associated with cuts in government expenditures, are larger during periods of a negative GDP growth rate (approximately 2.0) than in periods of a positive growth rate. Owyang et al. (Reference Owyang, Ramey and Zubairy>2013) apply a threshold local projections model and find evidence of higher multipliers in periods of high unemployment than in periods of low unemployment for Canada but not for the United States. Fazzari et al. (Reference Fazzari, Morley and Panovska>2015) apply a threshold SVAR to US data, using the capacity utilization rate as a measure of slack, and find that government spending multipliers are higher in slack (1.6) than in good periods (0.8). Caggiano et al. (Reference Caggiano, Castelnuovo, Colombo and Nodari>2015) estimate a smooth-transition SVAR on the US data and find evidence of higher government spending multipliers in “deep recessions” than in “strong expansionary periods,” but not the same evidence comparing “normal recessions” with “normal expansions.” Alloza (Reference Alloza>2017), estimating a nonlinear SVAR and a threshold local projections model on the US data, finds higher government spending multipliers in booms than in recessions and, therefore, procyclical multipliers. Ramey and Zubairy (Reference Ramey and Zubairy>2018) apply a threshold local projections model to a long sample of data for the USA and find no clear differences between government spending multipliers in periods of high and low unemployment rates, with multipliers below one in both states of the economy. This conclusion is also confirmed by comparing recessions vs. expansions. Gomes et al. (Reference Gomes, Sakurai and Soave>2022) investigate state dependency in a panel of emerging countries, finding government spending multipliers below one, regardless of whether the economy is in a slump or normal times, and find evidence of multipliers close to zero in slump conditions.
The empirical evidence on this relevant issue is therefore mixed. In addition, it is important to further highlight that some recent studies, such as Ramey and Zubairy (Reference Ramey and Zubairy>2018), have challenged the robustness of some of the most influential analyses supporting the conclusion of countercyclical government spending multipliers by showing that these results tend to be fragile to small changes in model specifications or improvements in the methods of calculating multipliersFootnote 5. Therefore, Ramey (Reference Ramey>2019, p.90) claims that “the evidence for higher spending multipliers during recessions or times of high unemployment is fragile, and the most robust results suggest multipliers of one or below during these periods.”
Finally, some studies have investigated the same question for the government fiscal stance and, therefore, have not specifically focused on public expenditure. In this regard, Jordà and Taylor (Reference Jordà and Taylor>2016), applying a panel threshold local-projections model to a set of OECD countries, find clear evidence of higher fiscal multipliers in recessions than in expansions for fiscal consolidation measures; Cohen-Setton et al. (Reference Cohen-Setton, Gornostay and Ladreit>2019), applying a panel smooth-transition local projections model to a set of OECD countries, find higher multipliers in slumps than in booms for large fiscal stimulus; and Banerjee and Zampolli (Reference Banerjee and Zampolli>2019) estimate a panel threshold local projections model to a set of advanced countries, finding that multipliers associated with consolidation policies are largely acyclical and less than one.
3. Methods and Data
3.1 Local projections and identification
In line with several recent contributions (cf. Section 2), I estimate public consumption multipliers using the local projections method (LP) proposed by Jordà (Reference Jordà>2005). This methodology presents some advantages compared to the structural vector autoregressive (SVAR) methodology. In particular, it tends to be more robust to model misspecification than the SVAR approach and can be easily adapted to accommodate state dependence and avoid bias in converting elasticities to multipliers. On the other hand, the SVAR methodology tends to be more efficient than LP, especially at long horizons, if it adequately captures the data-generating processFootnote 6. Another attractive feature of LP is its simplicity. For example, the dynamic effect of (identified) structural public consumption shocks (
 $shock$
) on a variable of interest (
 $y$
) can be easily retrieved with LP by estimating a series of regressions of this type:
 \begin{equation} y_{t+h} = \alpha _h + \beta _h shock_t + \upsilon _h controls + \epsilon _{t+h}; \hspace{20pt} h=0,\ldots,H \end{equation}
where
 $\{\beta _h\}_{h=0}^{h=H}$
captures the impulse response of interest.
The main difficulty in estimating an equation such as the previous one lies in the detection of structural fiscal shocks, that is, in assuring the exogeneity of the
 $shock$
regressor. This is, of course, crucial for the unbiasedness of the estimates. In the case of public expenditure, four main strategies have been proposed in the literature to identify structural fiscal shocks and address endogeneity (cf. Caldara and Kamps (Reference Caldara and Kamps>2008)). The first two rely on SVAR modeling and restrictions on the contemporaneous relations among the variables. Contemporaneous restrictions can take the form of recursive (Fatás and Mihov (Reference Fatás and Mihov>2001)) or nonrecursive restrictions (Blanchard and Perotti (Reference Blanchard and Perotti>2002); Perotti (Reference Perotti>2005)). The former implies assuming that contemporaneous relations can be represented by a lower triangular matrix, while the latter allows for a more complex contemporaneous relation among variables. The third approach is also grounded on SVAR, proposing to achieve identification by constraining the sign of the impulse responses to be consistent with theory predictions (Mountford and Uhlig (Reference Mountford and Uhlig>2009)). Finally, a more qualitative identification strategy is implemented in the so-called event-based or narrative approach, in which structural fiscal policy shocks are identified by carefully selecting episodes of changes in public spending deemed unrelated to the state of the economy. A classic example is the actual or announced/expected increase in military spending driven by war episodes (e.g. Barro (Reference Barro>1981); Ramey and Shapiro (Reference Ramey and Shapiro>1998); Ramey (Reference Ramey>2011b); Ramey and Zubairy (Reference Ramey and Zubairy>2018)).
The identification strategy followed in the present paper is grounded in contemporaneous restrictions. More specifically, denoting by
 $w\equiv \{g, gdp, nt, R\}$
the variables of the model, with
 $g$
,
 $gdp$
, and
 $nt$
, respectively, indicating the logarithm of quarterly real per capita and seasonally adjusted public consumption, gross domestic product, and net taxes, and
 $R$
indicating the long-term real interest rate (cf. Section 3.3. for more details), I assume that the structural public consumption shocks (
 $shock$
) can be retrieved as follows:
 \begin{equation} g_t = \sum _{l=1}^L \nu _{l} w_{t-l} + shock_t \end{equation}
namely, as the difference between the actual and predicted public consumption values, with predictions based on lagged variables. This is equivalent to ordering public consumption first in a Cholesky structure, that is, assuming that public consumption is not affected by contemporaneous shocks to the other variables.
The key insight here is the one advanced by Blanchard and Perotti (Reference Blanchard and Perotti>2002), according to which the government generally takes more than a quarter to adjust fiscal policy decisions to unexpected macroeconomic dynamics due to the presence of decision making and implementation delaysFootnote 7. This hypothesis has become a milestone in the literature and, indeed, has been extensively exploited both in the SVAR context (e.g. Fatás and Mihov (Reference Fatás and Mihov>2001); Blanchard and Perotti (Reference Blanchard and Perotti>2002); Perotti (Reference Perotti>2005); Caldara and Kamps (Reference Caldara and Kamps>2008); Auerbach and Gorodnichenko (Reference Auerbach and Gorodnichenko>2012); Ilzetzki et al. (Reference Ilzetzki, Mendoza and Végh>2013); Fazzari et al. (Reference Fazzari, Morley and Panovska>2015); Alloza (Reference Alloza>2017)) and, more recently, within the local projections approach (e.g. Auerbach and Gorodnichenko (Reference Auerbach and Gorodnichenko>2013), (Reference Auerbach and Gorodnichenko>2017); Bernardini and Peersman (Reference Bernardini and Peersman>2018); Ramey and Zubairy (Reference Ramey and Zubairy>2018)). Combining this with the fact that public consumption is acyclical by construction, as it is not affected by automatic stabilizers, the absence of contemporaneous feedback going from aggregate output to public consumption can be easily justified. Similar reasoning applies to the contemporaneous relation between public consumption and interest rates by noting that public consumption does not include interest payments. Finally, despite being more questionable, excluding the possibility that public consumption reacts to net-taxes shocks is in line with most of the previous analyses and generally not crucial for the results (e.g. Blanchard and Perotti (Reference Blanchard and Perotti>2002))Footnote 8.
3.2 Linear and nonlinear baseline specification
Applying the previously specified identification strategy within local projections is particularly convenient. Indeed, exploiting the panel structure of the data set, I retrieve the dynamic effects of structural public consumption shocks by estimating a series of regressions of this type:
 \begin{equation} y_{i,t+h} = \alpha _{i,h} + \beta _h g_{i,t} + \sum _{l=1}^L \phi _{l,h} w_{i,t-l} + \tau _{t,h} + \epsilon _{i,t+h}; \hspace{20pt} h=0,\ldots,H \end{equation}
where
 $i$
and
 $t$
index countries and time,
 $\alpha$
and
 $\tau$
are country and time fixed effects,
 $g_{i,t}$
and
 $w_{i,t-l}$
are the variables defined in the previous section, and
 $\{\beta _h\}_{h=0}^{h=H}$
captures the effect of interestFootnote 9. As is standard in the fiscal multiplier literature based on quarterly data, I set
 $L=4$
.
Fiscal multipliers are computed in cumulative way using the ex-ante conversion procedure. This procedure, proposed by Hall (Reference Hall>2009) and Barro and Redlick (Reference Barro and Redlick>2011), controls for potential biases in converting elasticities to multipliers (Ramey and Zubairy (Reference Ramey and Zubairy>2018)) by expressing dependent variables in terms of lagged GDP. In this way, regression coefficients are in the same units, and cumulative multipliers can be directly computed as
 \begin{equation} Mult_p = \frac{\sum _{h=0}^{h=p} \beta ^{(gdp)}_h}{\sum _{h=0}^{h=p} \beta ^{(g)}_h} \hspace{20pt} 0\leq p \leq H \end{equation}
where
 $\beta ^{(gdp)}_h$
and
 $\beta ^{(g)}_h$
are the coefficients attached to the public consumption variable in equation (3) when, as the left-hand side variable we have, respectively, the growth rate of gross domestic product and the growth rate of public consumption in lagged GDP units, that is,
 $\frac{GDP_{i,t+h} - GDP_{i,t-1}}{GDP_{i,t-1}}$
and
 $\frac{G_{i,t+h} - G_{i,t-1}}{GDP_{i,t-1}}$
with
 $GDP$
and
 $G$
, respectively, indicating real per capita and seasonal adjusted gross domestic product and public consumption in levels.
To analyze whether public consumption multipliers vary with the state of the economy, following Auerbach and Gorodnichenko (Reference Auerbach and Gorodnichenko>2012, Reference Auerbach and Gorodnichenko>2013), the linear specification is extended into the following panel smooth-transition local projections model:
 \begin{align} y_{i,t+h} & = \alpha _{i,h} + \beta _{1,h} g_{i,t} * F(z_{i,t-1}) + \sum _{l=1}^L \phi _{1,l,h} w_{i,t-l} * F(z_{i,t-1}) \nonumber\\ & \quad +\beta _{2,h} g_{i,t} * (1-F(z_{i,t-1})) + \sum _{l=1}^L \phi _{2,l,h} w_{i,t-l} * (1-F(z_{i,t-1})) \nonumber\\ & \quad +\theta _h* F(z_{i,t-1}) + \tau _{t,h} + \epsilon _{i,t+h}; \hspace{20pt} h=0,\ldots,H \end{align}
where 1 and 2 index the two regimes of the economy, namely, slack and good regimes,
 $z$
is the state (transition) variable capturing the slack in the economy,
 $F(z)$
is the transition function, and
 $\{\beta _{1,h}\}_{h=0}^{h=H}$
and
 $\{\beta _{2,h}\}_{h=0}^{h=H}$
, respectively, capture the impulse response function in the first and second regimes of the economyFootnote 10.
To close the model, the state variable and the functional form of the transition function must be specified. Regarding the state variable, I test a range of possible variables constructed considering several indicators of slack used in the fiscal multipliers literature. Specifically, I built the state variables in such a way that
 $Var(z_i)=1$
, alternatively using data on the unemployment rate (Shoag et al. (Reference Shoag>2010); Barro and Redlick (Reference Barro and Redlick>2011); Owyang et al. (Reference Owyang, Ramey and Zubairy>2013); Ramey and Zubairy (Reference Ramey and Zubairy>2018)), the employment rate (Auerbach and Gorodnichenko (Reference Auerbach and Gorodnichenko>2013)), and the “dynamics” of GDP (Auerbach and Gorodnichenko (Reference Auerbach and Gorodnichenko>2012), (Reference Auerbach and Gorodnichenko>2013), (Reference Auerbach and Gorodnichenko>2017)). Since there is no compelling reason to prefer one state variable over the other, the results for all the state variables tested are reported. This is important as it allows testing and evaluating the robustness of the findings extensively. I select, in any case, a “preferred” state variable to use as the benchmark scenario. This choice is made by looking at the empirical performance of the different nonlinear models in a quarter head prevision of public consumption.
Regarding the transition function, the following functional form is assumed:
 \begin{equation} F(z_{i,t-i}) = \frac{exp({-}\gamma z_{i,t-1})}{1 + exp({-}\gamma z_{i,t-1})}; \hspace{20pt} \gamma \gt 0 \end{equation}
This transition function takes values from potentially unlimited support and transforms them into values between zero and one. An equal weight between the two regimes—
 $F(z)=0.5$
—is obtained for
 $z=0$
. The parameter
 $\gamma$
defines the “speed” of the transition between the regimes: the higher
 $\gamma$
, the faster the transition between the regimes of the economy. I calibrate
 $\gamma$
in such a way that the economy spends approximately
 $20\%$
of the time in slack, where slack is defined as a period in which
 $F(z)\gt 0.8$
Footnote 11. This translates into a value for
 $\gamma$
between 1.5 and 1.75, depending on the specific state variable considered.
3.3 Data
The models are estimated using a data set composed of quarterly data for nine Euro area counties, covering the period 1999Q1−2018Q4Footnote 12. A major advantage of the selected sample is that all the countries share the same Central Bank. As such, any change in monetary policy is virtually absorbed by the time-fixed effect as it is shared by all countries. This is particularly useful in our case for controlling unconventional monetary policies, which are otherwise not so easy to consider.
The data set is constructed using the OECD statistic database as a source. The variables in real terms are obtained by deflating nominal variables with the GDP deflator. The variables in per capita terms are obtained by dividing by the total population. Regarding seasonality, most of the variables are seasonally adjusted by the source. Where this is not the case, the time series are seasonally adjusted using the X-13-ARIMA-SEATS procedure.
Regarding the variables entering the baseline models, in addition to gross domestic product, public consumption refers to the “Government final consumption expenditure,” that is, the sum of collective and individual consumption expenditure of the government; the variable net taxes is constructed as in Blanchard and Perotti (Reference Blanchard and Perotti>2002) and refers to the total revenues minus total transfers; and the long-term real interest rate refers to an ex-post interest rate and is calculated as the difference between the 10-year nominal interest rate on treasury bonds and the inflation rate, calculated as the percentage change on the same quarter of the previous year.
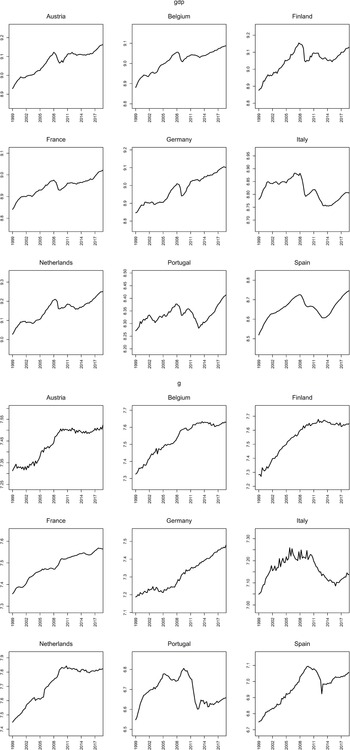
Details on real per capita and seasonally adjusted gross domestic product and public consumption are shown in Figure 1. The double recession connected to the global financial crisis of 2008, first, and the sovereign debt crisis, then, is clearly visible in the per capita GDP time series. The amplitude and persistence of these recessionary episodes have been not homogeneous between countries and are particularly marked in southern European countries (Italy, Portugal, and Spain) and in Finland. Among these countries, in 2018, Italy and Finland have still not recovered the pre-crisis per capita GDP level.
Real per capita and seasonally adjusted gross domestic product (
 $gdp$
) and public consumption (
 $g$
) at the country level. Logarithmic values. 1999Q1−2018Q4.

At the same time, in most of the countries analyzed, public consumption dynamics have clearly changed in the post-crisis period compared to the pre-crisis years. This is particularly evident after the explosion of the sovereign debt crisis. Indeed, with the exception of France and Germany, public consumption has started to stagnate in Austria, Belgium, Finland, and the Netherlands and to drastically fall in southern European countriesFootnote 13. The drop in public consumption reached approximately 20% in Italy and Portugal compared to the pre-crisis peak. This is a clear indicator of the size of the austerity policies implemented during these years, especially in southern European countries.
4. Linear and State-Dependent Estimates of the Multipliers
Turning to the results, Figure 2 shows the linear impulse response of GDP and public consumption, in GDP units, to a
 $1\%$
shock to public consumption (i.e.
 $\beta ^{gdp}_{h}$
and
 $\beta ^{g}_{h}$
). Both impulse responses are shown together with their
 $90\%$
confidence intervalsFootnote 14. Two interesting results emerge from the analysis of these responses. First, public consumption shocks produce a statistically significant and long-lasting positive effect on GDP. The GPD reaction is hump-shaped, with a peak effect approximately 2−3 years after the shock. Second, public consumption shocks are highly persistent over time, with half of the shocks still there after 4 years.
By transforming these impulse responses to multipliers, I obtain the (cumulative) public consumption multipliers shown in the top row of Table 1 (baseline). The size of the multiplier is approximately 0.7 in the first year and above 1.0 in the medium term, stabilizing around a value of 1.25. Therefore, in the medium term, an increase (decrease) in public consumption of one euro raises (decreases) output by approximately
 $1.25{\unicode{x20AC}}$
.
Linear cumulative multipliers

Linear impulse responses of GDP and public consumption to a
 $1\%$
shock to public consumption. Impulse responses in GDP units. Shaded areas represent
 $90\%$
confidence intervals based on Driscoll and Kraay (Reference Driscoll and Kraay>1998) standard errors.

Table 1 also reports the results for subsample periods. In particular, it is interesting to control whether inclusion in the analysis of the period after the global financial crisis or periods of possible zero lower bound affects the results. The results show that this is not the case, as the estimates indicate strong subsample stability. Particularly, I do not find any clear difference between pre-crisis (Pre GFC) and post-crisis (Post GFC) multipliers, using 2008Q2 as the break period. I also find that the exclusion of zero lower bound periods (No ZLB), identified as periods of a zero or negative shadow monetary policy rate (cf. Wu and Xia (Reference Wu and Xia>2016), (Reference Wu and Xia>2017); Amendola et al. (Reference Amendola, Di Serio, Fragetta and Melina>2020)), does not affect the estimates.
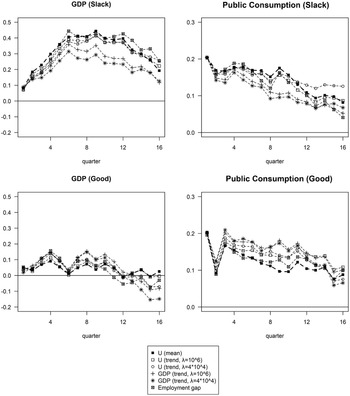
In contrast, estimates from the nonlinear models reveal that public consumption multipliers clearly differ between slack and good economic conditions. Starting with the benchmark state variable that, using the metric described in the previous section, is represented by (negative) standardized deviations of the unemployment rate from the country mean, Figure 3 shows the state-dependent impulse responses of GDP and public consumption, in GDP units, to a
 $1\%$
shock to public consumption. As it emerges from the figure, the GDP reaction turns out to be highly different in the two regimes of the economy, resulting in a strong, long-lasting and statistically significant response in the slack regime and a rather weak and never significantly different from zero response in the good regime. Regarding the persistence of the shocks, as in Ramey and Zubairy (Reference Ramey and Zubairy>2018), I find greater persistence in the slack regime than in the good regime, but the difference is mild. Therefore, transforming these impulse responses to cumulative multipliers, the values of the public consumption multiplier turn out to be utterly different in the two regimes. In the medium term, multipliers are approximately 2.2 in the slack regime, whereas they are between 0.3 and 0.4 in the good regime (cf. Table 2, Baseline). The difference is sizeable even over shorter horizons. Two years after the shock, for example, multipliers are approximately 1.7 and 0.4 in the two regimes, respectively.
State-dependent impulse responses of GDP and public consumption to a
 $1\%$
shock to public consumption. Impulse responses in GDP units. Shaded areas represent
 $90\%$
confidence intervals based on Driscoll and Kraay (Reference Driscoll and Kraay>1998) standard errors. State variable: negative standardized deviations of the unemployment rate from the country mean.

State-dependent cumulative multipliers

Are these results robust to alternative state variables? In this regard, an interesting robustness check is to consider (negative) standardized deviations of the unemployment rate from the Hodrick−Prescott (HP) trend as the state variable. Indeed, a possible concern with the benchmark state variable is, being based on the country-mean unemployment rates, that it imposes a constant “threshold” (location parameter) over time, ruling out potential structural changes in the labor market. This alternative state variable does not introduce such an assumption, thus representing an important robustness check. Regarding the smoothing parameter (
 $\lambda$
) of the HP trend, I test two possibilitiesFootnote 15: (i) a very high
 $\lambda$
equal to
 $10^6$
; and (ii) a smaller
 $\lambda$
equal to
 $4*10^4$
. Table 2 (Baseline) shows that the results are highly robust to the use of these alternative state variables.
Turning from the unemployment rate to other variables, I then consider both standardized deviations of GDP from the HP trend and, as in Auerbach and Gorodnichenko (Reference Auerbach and Gorodnichenko>2013), standardized deviations of the (log) employment rate from the HP trend, as the state variableFootnote 16. As clearly emerges from Table 2 (Baseline), previous results are largely confirmed considering these alternative indicators of slack.
All in all, these results provide clear evidence in favor of higher public consumption multipliers in slack than in good economic conditions, with a sizable difference between the two regimesFootnote 17. This conclusion appears very robust, holding regardless of the specific state variable used and the horizon consideredFootnote 18. Remarkably, considering all the tested state variables, estimates suggest a medium-term multiplier between 1.9 and 2.2 in the slack regime and between 0.1 and 0.4 in the good regimeFootnote 19.
5. Addressing the Fiscal Foresight Problem: The Expectations-Augmented Model
A well-known potential concern with the result shown in the previous section is that, due to possible implementation lags in fiscal policy, retrieved fiscal shocks may be “nonfundamental,” meaning that they are unable to recover the true structural shocks of the underlying data-generating process. This, known as the fiscal foresight problem, is particularly problematic, as it can bias and undermine estimates if economic agents are responsive to fiscal news (e.g. Leeper et al. (Reference Leeper, Walker and Yang>2013)). If this is the case, in fact, due to lags between announcement and effective implementation of fiscal policy, economic agents may start reacting to shocks before they are observable by the econometricians. This, of course, leads to incorrect results.
Concerns about anticipation effects in the fiscal multiplier literature have recently gained particular attention, as several studies have shown that standard “SVAR-based” identification methodologies tend to produce fiscal shocks that are partly predictable using additional external information, such as professional forecasts or narrative shocks (Ramey (Reference Ramey>2011b); Auerbach and Gorodnichenko (Reference Auerbach and Gorodnichenko>2012), (Reference Auerbach and Gorodnichenko>2013)). This indicates that these methodologies are effectively exposed to the fiscal foresight problem, which, according to Ramey (Reference Ramey>2011b), produces strong distortions in the estimates if anticipation effects are not properly considered. However, several studies claim that the potential distortion due to fiscal foresight is relatively small in practice, somehow preserving the reliability of results based on standard approaches (Mertens and Ravn (Reference Mertens and Ravn>2010); Sims (Reference Sims>2012); Perotti (Reference Perotti>2014)). The actual relevance of the problem, thus, turns out to be an empirical question.
Nonfundamentalness can be seen as an omitted-variables problem that leads econometricians to have a smaller set of information than that of economic agents (Kilian and Lütkepohl (Reference Kilian and Lütkepohl>2017)). As such, whenever feasible, a solution is to add variables in the econometric model to align the two information sets. Accordingly, in line with Ramey (Reference Ramey>2011b) and Auerbach and Gorodnichenko (Reference Auerbach and Gorodnichenko>2012, Reference Auerbach and Gorodnichenko>2013), I tackle fiscal foresight by incorporating real-time professional forecasts into the model. Particularly, following Auerbach and Gorodnichenko (Reference Auerbach and Gorodnichenko>2012, Reference Auerbach and Gorodnichenko>2017), I use the forecasts provided by the OECD in the “Economic Outlook.” These forecasts are reliable and perfectly fit the present analysis, as they explicitly refer to public consumption expenditures and cover all the countries and the timespan considered in the workFootnote 20. Accordingly, I augment the baseline models with these forecasts to directly control for expectations on public consumption:
 \begin{equation} y_{i,t+h} = \alpha _{i,h} + \beta _h g_{i,t} + \rho g^{fc}_{i,t-1} + \sum _{l=1}^L \phi _{l,h} w_{i,t-l} + \tau _{t,h} + \epsilon _{i,t+h}; \hspace{20pt} h=0,\ldots,H \end{equation}
 \begin{align} y_{i,t+h} & = \alpha _{i,h} + \beta _{1,h} g_{i,t} * F(z_{i,t-1}) + \rho _1 g^{fc}_{i,t-1}*F(z_{i,t-1}) + \sum _{l=1}^L \phi _{1,l,h} w_{i,t-l} * F(z_{i,t-1}) \nonumber\\ &\quad +\beta _{2,h} g_{i,t} * (1-F(z_{i,t-1})) + \rho _2 g^{fc}_{i,t-1}*(1-F(z_{i,t-1})) + \sum _{l=1}^L \phi _{2,l,h} w_{i,t-l} *(1-F(z_{i,t-1})) \nonumber\\ &\quad +\theta _h* F(z_{i,t-1}) + \tau _{t,h} + \epsilon _{i,t+h}; \hspace{20pt} h=0,\ldots,H \end{align}
where
 $g^{fc}_{t-1}$
is the forecast on public consumption made in period
 $t-1$
. This helps in purifying public consumption shocks from their potentially predictable component and in constructing impulse responses based on unanticipated structural shocks (Auerbach and Gorodnichenko (Reference Auerbach and Gorodnichenko>2012); Perotti (Reference Perotti>2014); Boehm (Reference Boehm>2020); Deleidi et al. (Reference Deleidi, Romaniello and Tosi>2021b))Footnote 21. Indeed, directly controlling for public consumption expectations, the coefficients
 $\{\beta _h\}_{h=0}^{h=H}$
and
 $\{\beta _{1,h}\}_{h=0}^{h=H}$
,
 $\{\beta _{2,h}\}_{h=0}^{h=H}$
can now be interpreted as the linear and state-dependent impulse responses of
 $y$
to “unanticipated” public consumption shocks, as these shocks are orthogonal, by construction, to the set of information contained in the forecasts and lagged time series. I call this specification the E-model, which stands for the expectations-augmented model.
Multipliers estimated with the linear E-model are reported in the right part of Table 1. The results show that the inclusion of the forecasts in the model does not sizably affect the estimates, leaving the multipliers on values above one in the medium term. Furthermore, as emerges from the right part of Table 2, I continue to find strong evidence of higher public consumption multipliers in the slack regime than in the good regime, even controlling for expectations. As with the previous results, this conclusion holds regardless of the horizon and the state variable considered.
Summing up, it can be argued that the results are extremely robust to the inclusion of the forecasts into the model and, therefore, to potential problems connected to the predictability of the public consumption shocksFootnote 22.
5.1 An IV approach to test the significance of state-dependent results
Up to now, no statistical test has been performed on the difference between multipliers in slack and good periods. This is due to the difficulty of comparing results that are the ratio between two impulse responses. A possible solution to that, proposed by Ramey and Zubairy (Reference Ramey and Zubairy>2018), is to use an instrumental variable approach to estimate multipliers in a single step. This has the advantage of directly providing the standard errors associated with the multipliers, thus allowing, for example, to easily test state dependency.
To this aim, the method proposed by Ramey and Zubairy (Reference Ramey and Zubairy>2018) is adapted to the context of a panel smooth-transition model, and the following model is estimated:
 \begin{align} & \sum _{j=0}^{j=h} \frac{GDP_{i,t+h} - GDP_{i,t-1}}{GDP_{i,t-1}} = \alpha _{i,h} + \beta _{1,h} \sum _{j=0}^{j=h} \frac{G_{i,t+h} - G_{i,t-1}}{GDP_{i,t-1}} * F(z_{i,t-1}) + \rho _1 g^{fc}_{i,t-1}*F(z_{i,t-1}) \nonumber \\[5pt] &\quad +\sum _{l=1}^L \phi _{1,l,h} w_{i,t-l} * F(z_{i,t-1}) + \beta _{2,h} \sum _{j=0}^{j=h} \frac{G_{i,t+h} - G_{i,t-1}}{GDP_{i,t-1}} + \rho _2 g^{fc}_{i,t-1} + \sum _{l=1}^L \phi _{2,l,h} w_{i,t-l} \nonumber\\[5pt] &\quad +\theta _h* F(z_{i,t-1}) + \tau _{t,h} + \epsilon _{i,t+h}; \hspace{20pt} h=0,\ldots,H \end{align}
where
 $\sum _{j=0}^{j=h} \frac{G_{i,t+h} - G_{i,t-1}}{GDP_{i,t-1}} * F(z_{i,t-1})$
and
 $\sum _{j=0}^{j=h} \frac{G_{i,t+h} - G_{i,t-1}}{GDP_{i,t-1}}$
are instrumented by
 $ g_{i,t} * F(z_{i,t-1})$
and
 $g_{i,t}$
, respectively. The coefficient
 $\beta _{1,h}$
now reads as the difference between multipliers in slack and good regimes. The standard error attached to this coefficient reveals the significance of this difference. As seen from the results shown in Table 3, multipliers in slack and good periods are significantly different at high confidence levels. State-dependent results are, therefore, clearly supported from a statistical perspective.
Size and significance level of the differences between multipliers in slack and good regime

The p-values reported are based on Driscoll and Kraay (Reference Driscoll and Kraay>1998) standard errors.
6. Transmission Channels
This section examines some transmission channels underlying previous results by analyzing the linear and state-dependent impulse responses of variables other than the gross domestic product. Specifically, the reaction of private consumption, private investment, net taxes, and the real interest rate is analyzedFootnote 23. The impulse responses are expressed in GDP units, except for the real interest rate, which is in basis points.
Linear and state-dependent cumulative multipliers for private consumption and investment

State-dependent values are the averages across different state variables.
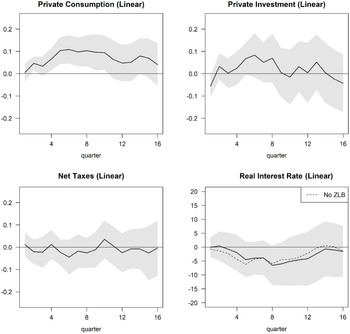
Figure 4 reports linear impulse responses. As it emerges from the figure, in line with the findings of several studies analyzing the effects of shocks to public spending (e.g. Blanchard and Perotti (Reference Blanchard and Perotti>2002); Galí et al. (Reference Galí, López-Salido and Vallés>2007); Caldara and Kamps (Reference Caldara and Kamps>2008); Mertens and Ravn (Reference Mertens and Ravn>2010); Auerbach and Gorodnichenko (Reference Auerbach and Gorodnichenko>2013)), I find a clear crowding-in effect on private consumption, which positively reacts to a positive public consumption shock. The reaction is statistically significant and long lasting. In terms of cumulative multipliers, the results suggest that an increase in public consumption of one euro stimulates approximately 0.45
 ${\unicode{x20AC}}$
of additional private consumption (cf. Table 4). Controlling for expectations, such crowding-in dynamics strengthen slightly, with an increase in the medium-term private consumption multiplier of 0.1 units. The reaction of private investment is less clear. There is some evidence of crowding-out on impact and then some tendency of crowding-in in the short term, which explains the low but positive multipliers shown in Table 4 (0.1). In any case, the reaction of private investment is not significantly different from zero at any horizon, so no robust conclusions can be drawn.
Linear impulse responses of private consumption, private investment, net taxes, and real interest rate to a
 $1\%$
shock to public consumption. Impulse responses in GDP units, except the real interest rate response, which is in basis points. Shaded areas represent
 $90\%$
confidence intervals based on Driscoll and Kraay (Reference Driscoll and Kraay>1998) standard errors.

Net taxes and the real interest rate turn out to be largely insensitive to public consumption shocks (cf. Figure 4). Concerning net taxes, this means that the results likely capture the effects of public consumption shocks in a scenario of no “offsetting forces” coming from this variable. The estimates can, therefore, be interpreted as the effects of “fully deficit-financed” public consumption shocks. The fact that the real interest rate does not show any increasing tendency in response to a positive public consumption shock is particularly interesting and in line with several empirical analyses (e.g. Ramey (Reference Ramey>2011b); Corsetti et al. (Reference Corsetti, Meier and Müller>2012); Batini et al. (Reference Batini, Callegari and Melina>2012); d’Alessandro et al. (Reference d’Alessandro, Fella and Melosi>2019)). Interestingly, this is also confirmed by excluding potential zero lower bound periods from the analysis.
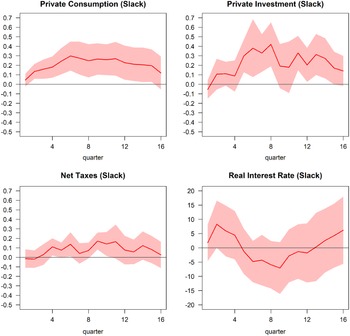
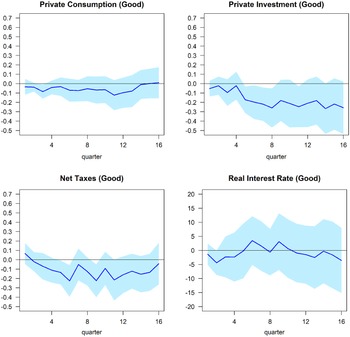
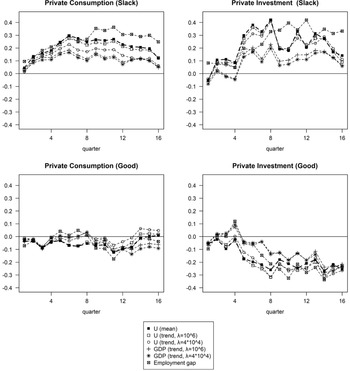
Shifting the focus to the nonlinear analysis, the results show that the difference in the size of the multiplier between slack and good conditions is mainly driven by a completely different reaction of the private components of the GDP in the two regimesFootnote 24. Indeed, while both variables are strongly crowded in the slack regime, they tend to be crowded out in the good regime, even if the absence of crowding out cannot be rejected, especially for consumption (cf. Figures 5, 6). In terms of medium-term multipliers, my findings suggest that (i) an increase in public consumption of one euro stimulates approximately 1.25
 ${\unicode{x20AC}}$
of additional private consumption in the slack regime, while it crowds out approximately 0.30
 ${\unicode{x20AC}}$
of private consumption in the good regime and (ii) one euro of increase in public consumption triggers approximately 1.3
 ${\unicode{x20AC}}$
of additional private investment in slack conditions, while it translates into a reduction of private investment of about 1.1
 ${\unicode{x20AC}}$
in the good regime (cf. Table 4).
Slack regime impulse responses of private consumption, private investment, net taxes, and real interest rate to a
 $1\%$
shock to public consumption. Impulse responses in GDP units, except the real interest rate response, which is in basis points. Shaded areas represent
 $90\%$
confidence intervals based on Driscoll and Kraay (Reference Driscoll and Kraay>1998) standard errors. State variable: negative standardized deviations of the unemployment rate from the country mean.

Good-regime impulse responses of private consumption, private investment, net taxes, and real interest rate to a
 $1\%$
shock to public consumption. Impulse responses in GDP units, except the real interest rate response, which is in basis points. Shaded areas represent
 $90\%$
confidence intervals based on Driscoll and Kraay (Reference Driscoll and Kraay>1998) standard errors. State variable: negative standardized deviations of the unemployment rate from the country mean.

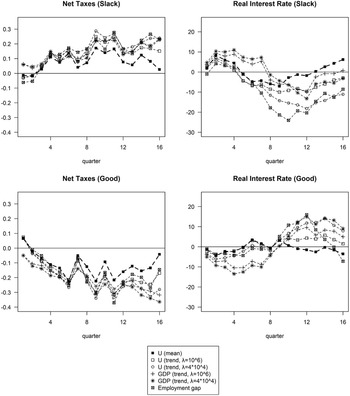
The analysis of the state-dependent impulse responses of net taxes and the real interest rate reveals that these variables do not seem to play a crucial role in explaining previous state-dependent findings (cf. Figures 5, 6). Regarding net taxes, this means that the cause behind state dependency does not seem to be sought in a less favorable way of financing public spending, that is, recurring less to the deficit and more to additional taxes, in the good than in the slack regime. Moreover, the response of the real interest rate hardly informs the results, as it remains not significantly different from zero in both regimes. Therefore, all in all, this suggests that the state-dependent effects of the public consumption shocks lie in more structural mechanisms at work in the economic systems analyzed here.
Further investigation of such potential mechanisms is beyond the scope of this paper, leaving room for future analysis. However, it is interesting to briefly mention some of the mechanisms highlighted by recent literature that seek to rationalize and model state dependency. Bachmann and Sims (Reference Bachmann and Sims>2012), for example, find that the confidence of private agents increases when public spending increases during periods of economic slack, thereby stimulating private activity and production. Hence, a possible channel behind state dependency can be sought in the effect of fiscal policy on the confidence of the private sector. Second, if financial frictions are more relevant during periods of slack, expansionary fiscal policies can stimulate private activity more in such circumstances by relaxing these frictions (Canzoneri et al. (Reference Canzoneri, Collard, Dellas and Diba>2016)). Empirical support for this channel is provided by Glocker et al. (Reference Glocker, Sestieri and Towbin>2019) for the UK. Similarly, the effects of fiscal shocks can be amplified if the fraction of hand-to-mouth consumers is higher in conditions of slack since this increases the economy’s (mean) marginal propensity to consume and, therefore, the responsiveness of private consumption to changes in current income (e.g. Galí et al. (Reference Galí, López-Salido and Vallés>2007)). Finally, Ghassibe and Zanetti (Reference Ghassibe and Zanetti>2020) build a model where search-and-matching frictions in the goods market generate fiscal multipliers that vary according to the level of congestion of this market, as this defines the level of the crowding-out of private consumption. Under conditions of demand-driven slack, congestion is low, crowding-out is low, and multipliers are higherFootnote 25.
7. Conclusions
In this paper, I have investigated the size of the public consumption multiplier and whether it varies depending on the slack of the economy. The analysis was conducted by applying linear and smooth-transition panel local projections models to a set of Euro area countries over the period 1999Q1−2018Q4.
The results show that public consumption shocks produce a sizable effect on aggregate output, with a medium-term multiplier above one (1.3). This is, however, an “average result,” as a major finding concerns the strong and robust evidence in favor of higher public consumption multipliers in slack than in good economic conditions. The difference is sizable and statistically significant, with multipliers around, and even above, 2.0 in the slack regime and positive but generally below 0.5 in the good regime.
The policy implications of these results are considerable. For example, my findings raise significant concerns about procyclical fiscal consolidation measures, based on cuts to public consumption, as substantial negative effects on aggregate output, private consumption and investment are expected from these policies. In contrast, in line with Keynesian intuitions, my findings show that public consumption stimuli may be crucial to sustain aggregate production and stimulate private consumption and investment in slack economic conditions. In particularly good economic conditions, the story is different, as the effects of public consumption shocks are mild, crowding-out effects are likely, and multipliers are low.
These conclusions are in line with several previous analyses but contrast with other recent studies and with the conclusions of Ramey (Reference Ramey>2019). Note, however, that the divergence between my findings and Ramey’s conclusions can hardly be explained by methodological issues. Indeed, the results shown in the present paper are based on an econometric specification built upon the “best practices” suggested by Ramey. The reasons behind this divergence, therefore, should be sought elsewhere.
As such, the present work leaves many avenues open for future research. For example, as the present analysis is one of the first attempts to estimate state dependency in the Euro area, an interesting question is whether my results are due to some peculiar features of the sample considered. Extending the current analysis to other advanced countries and comparing results inside and outside the Euro area can be particularly useful to shed more light on this point. In a related way, the possible mechanisms behind state-dependent fiscal multipliers could be further investigated. Finally, it may be interesting to extend the current analysis to other fiscal instruments, such as public investments. In fact, except for some recent analyses (e.g. Burriel et al. (Reference Burriel, De Castro, Garrote, Gordo, Paredes and Pérez>2010); Deleidi et al. (Reference Deleidi, Iafrate and Levrero>2020), (Reference Deleidi, Iafrate and Levrero>2021a)), there is not much literature on the values of public investment multipliers in the Euro area, and even less that analyses this issue in a nonlinear way. These are some of the research questions that could be explored in future works.
A. Appendix A - Additional results
Linear and state-dependent cumulative multipliers

Ex-post conversion procedure.
State-dependent impulse responses of GDP and public consumption to a
 $1\%$
shock to public consumption. Impulse responses in GDP units. Alternative state variables.

Linear and state-dependent cumulative multipliers

First differences specification
State-dependent impulse responses of private consumption and private investment to a
 $1\%$
shock to public consumption. Impulse responses in GDP units. Alternative state variables.

State-dependent impulse responses of net taxes and real interest rates to a
 $1\%$
shock to public consumption. Impulse responses in GDP units for net taxes and in basis points for real interest rates. Alternative state variables.