1. Introduction
While there is growing agreement that policies to reduce emissions from tropical deforestation are essential to combat global climate change, the extent to which forestry and other land sectors should be linked to compliance markets for greenhouse gas (GHG) emission reductions remains a critical policy issue. A key question is how to balance funding emission reductions from forest conservation and other land-based opportunities available in the near term with incentives for technological innovation in energy and other sectors over the longer run. Both technology innovation (Tavoni et al., Reference Tavoni, Sohngen and Bosetti2007) and greater near-term abatement enabled by reducing deforestation and other relatively low-cost opportunities (Golub, Reference Golub, Bosetti and Lubowski2010; Fuss et al., Reference Fuss, Szolgayovat, Golub and Obersteiner2011) could also provide flexibility in the event, for example, that new scientific information requires a tightening of emission constraints. This paper uses a global climate-energy-economy model to study implications of linking credits from reducing emissions from deforestation (RED) to a global carbon market, with a focus on energy technology innovation and future flexibility to increase emission targets.
Policies for reducing emissions from deforestation and forest degradation (REDD) in developing countries have the potential to mitigate about 15 per cent of global GHG emissions (more than the global transport sector) faster and at lower costs using current technologies (Stern, Reference Stern2007). While the Kyoto Protocol framework excluded mechanisms to reduce deforestation, the Cancun Agreements of December 2010 call for implementing REDD plus other forest carbon activities in developing countries and for exploring both public and market-based options to finance mitigation (United Nations Framework Convention on Climate Change (UNFCCC), 2010). Governments and other organizations have offered multiple proposals for financing REDD, including market approaches with different degrees of fungibility between forestry credits and GHG reductions in other countries and sectors (Parker et al., Reference Parker, Mitchell, Trivedi and Mardas2008, Reference Parker, Brown, Pickering, Roynestad, Mardas and Mitchell2009). Policymakers in the United States are also developing financing mechanisms for REDD within emerging regional GHG compliance markets as well as proposed cap-and-trade legislation at the Federal level (Boyd, Reference Boyd, Bosetti and Lubowski2010).
Under a carbon market system, mitigation of deforestation emissions – perhaps measured against a reference level at a national or interim subnational scale, as requested in Cancun – would generate credits that could be traded in a market for GHG emissions permits (allowances) to help satisfy legally binding emissions control obligations in the most cost-effective manner. One concern is that linking such forest carbon credits to GHG compliance markets could lower carbon prices (flood the market) at the expense of reductions in developed countries and incentives to develop critical low-carbon technologies. In particular, the European Commission cited a potential ‘imbalance’ between the supply and the demand for international forestry credits as one basis for its recommendation to defer the potential inclusion of REDD in the EU's Emission Trading Scheme (ETS) (Commission of the European Communities (EC), 2008; Piris-Cabezas, Reference Piris-Cabezas, Bosetti and Lubowski2010a).
A growing literature analyzes the potential role of reductions in deforestation and other land-based mitigation activities as part of global climate change policies. Researchers have estimated that forestry, largely in the tropics, would contribute half as much abatement as the total energy sector under an economically optimal strategy that balances the costs versus the benefits of avoiding climate change (Sohngen and Mendelsohn, Reference Sohngen and Mendelsohn2003). Other studies have used integrated economy-climate models to evaluate the contribution of forestry and other land-based activities to a least-cost portfolio of mitigation options for stabilizing GHG concentrations at particular target levels. Results from the Energy Modeling Forum 21 at Stanford University and related efforts indicate that reducing deforestation and other land-based abatement can play a significant role in achieving and reducing the costs of stabilization policies over the next century (Fisher et al., Reference Fisher, Nakicenovic, Alfsen, Morlot, de la Chesnaye, Hourcade, Jiang, Kainuma, La Rovere, Matysek, Rana, Riahi, Richels, Rose, Van Vuuren, Warren, Metz, Davidson, Bosch, Dave and Meyer2007; Rose et al., Reference Rose, Ahammad, Eickhout, Fisher, Kurosawa, Rao, Riahi and van Vuuren2011). Other modeling finds that policies to reduce emissions from fossil fuels could perversely increase deforestation emissions as bioenergy crops expand, if parallel incentives are not in place to avoid emissions from land use (e.g., Edmonds et al., Reference Edmonds, Clarke, Dooley, Kim, Izaurralde, Rosenberg, Stokes, Gale and Kaya2003; Melillo et al., Reference Melillo, Reilly, Kicklighter, Gurgel, Cronin, Paltsev, Felzer, Wang, Sokolov and Schlosser2009; Wise et al., Reference Wise, Calvin, Thomson, Clarke, Bond-Lamberty, Sands, Smith, Janetos and Edmonds2009).
Reduced deforestation and other land-based mitigation may enable greater global emissions reductions by lowering policy costs. A study coupling the World Induced Technical Change Hybrid (WITCH) model of the energy sector and climate system with the Global Timber Model (GTM) of the forestry sector indicates that forestry mitigation enables an atmospheric target of 550 CO2 parts per million by volume (ppmv)Footnote 1 for the same total cost as a 600 ppmv target under an energy-only policy (Tavoni et al., Reference Tavoni, Sohngen and Bosetti2007). The estimated net cost savings of US$2 trillion (40 per cent of policy costs in discounted terms) could finance an estimated additional 0.25°C less warming over this century at no added cost compared with energy-sector-only reductions. These cost savings come, however, with an estimated delay in energy-intensity reductions. On the basis of the induced innovation feature of WITCH, the authors estimate that forestry crowds out some abatement in the energy sector in the first three decades, delaying deployment of carbon capture and storage on coal plants from 2015 to 2030 and lowering the role of nuclear power. Estimated energy-intensity research and development (R&D) investments also fall by 10 per cent and there is lower learning-by-doing, which delays declines of wind and solar energy costs.Footnote 2
Integrated assessments of the role of forests and land in climate stabilization policies (e.g., Rose et al., Reference Rose, Ahammad, Eickhout, Fisher, Kurosawa, Rao, Riahi and van Vuuren2011) have, in general, abstracted from institutional details of climate policy and carbon market designs. Studies have assumed that all countries immediately embark on the most profitable emissions control trajectory. A more realistic pattern of participation results in an economically less efficient global emissions path. Incomplete and delayed participation, in terms of both countries and activities, misses low-cost mitigation opportunities and causes international leakage (shifts in emissions) requiring more costly future measures (e.g., Calvin et al., Reference Calvin, Patel, Fawcett, Clarke, Fisher-Vanden, Edmonds, Kim, Sands and Wise2009; Rose and Sohngen, Reference Rose and Sohngen2011).
More recently, partial equilibrium studies have examined impacts from different types of forest carbon credits within a carbon market under different policy scenarios and market architectures. Studies based on a static framework highlight the effect on carbon prices of limitations on REDD purchases during a single global market period ending in 2020 (Anger and Sathaye, Reference Anger and Sathaye2008; Anger et al., Reference Anger, Dixon and Livengood2009) and within the EU's ETS (Eliasch, Reference Eliasch2008). Piris-Cabezas and Keohane (Reference Piris-Cabezas and Keohane2008), Murray et al. (Reference Murray, Lubowski and Sohngen2009), US Climate Action Partnership (USCAP; 2009) and US Environmental Protection Agency (US EPA; 2009) analyze the inclusion of REDD credits in a global market by using a multiperiod framework in which participants can save or ‘bank’ excess reductions from year to year. When banking is active, the estimated impact of REDD supplies is distributed over time, and resulting carbon prices are generally higher in the near term and lower in the long term compared with analyses without these dynamics (Piris-Cabezas, Reference Piris-Cabezas, Bosetti and Lubowski2010b).
The analysis in the present paper combines advantages of integrated assessment studies with the institutional realism of recent partial equilibrium carbon market analyses, including the possibility of banking. We build upon Tavoni et al.'s (Reference Tavoni, Sohngen and Bosetti2007) study using WITCH but, rather than assuming global profit-maximizing participation, assume that national climate targets follow recent announcements over the near to medium term and that global trading is initially constrained. We also evaluate the effect of allowing the banking of emission permits throughout the century.
Our use of WITCH provides three advantages. First, WITCH enables us to treat technological change endogenously, as in Tavoni et al. (Reference Tavoni, Sohngen and Bosetti2007). We model how deforestation mitigation alters incentives through the carbon market and how these, in turn, affect energy technology innovation and deployment. Second, our study is dynamic, which is essential for modeling endogenous evolution of technological change and for exploring the role of credit banking. Third, WITCH is an integrated assessment model linking the economy and the climate, which enables explicit analysis of GHG concentration scenarios, as well as the degree to which forestry mitigation can enable greater climate benefits without raising costs. The climate module also allows us to examine the role of deforestation in meeting GHG concentration targets while accounting for alternative business-as-usual (BAU) emission projections across forest and land-use models.
2. The WITCH model and the deforestation estimates
The analysis supplements an optimal growth integrated assessment model (WITCH) with cost curves for reducing emissions from deforestation from different forestry and land-use models. We focus on reducing deforestation (the first ‘D’ of REDD) because a range of cost estimates is available and this is the focus of policy discussions. While most integrated assessment models do not directly examine land-based mitigation, they can be linked to forestry and land-use models. Studies have used both ‘soft’ and ‘hard’ link approaches to study the role of land-based activities in climate stabilization. We take a ‘soft link’ approach, augmenting WITCH with estimates generated by separate land-use and forestry models under exogenous carbon price scenarios.
While Tavoni et al. (Reference Tavoni, Sohngen and Bosetti2007) iterated between WITCH and GTM to increase consistency, we draw on results now available from a broader set of forestry and land-use models, preserving the full richness of the modeling on both the energy and forestry sides. The disadvantage is that, without a complete integration of models, we do not capture potentially significant feedbacks between the energy and forestry sectors as well as with other economic sectors and the overall climate system. Integration of forestry and other land uses within economy-wide models is an ongoing area of research (see Hertel et al., Reference Hertel, Rose, Tol, Hertel, Rose and Tol2009), including consideration of trade effects (Golub et al., Reference Golub, Hertel, Lee, Rose and Sohngen2009) and feedbacks between climate change and agricultural productivity (Ronneberger et al., Reference Ronneberger, Berrittella, Bosello, Tol, Hertel, Rose and Tol2009). Our approach uses WITCH to focus on the energy sector and technology innovation impacts and then explores the sensitivity of results to alternative estimates from separate forestry and land-use models.
2.1 Climate-energy-economy model
The WITCH model (Bosetti et al., Reference Bosetti, Carraro, Galeotti, Massetti and Tavoni2006) is a climate-energy-economy model designed to study the socioeconomic dimensions of climate change. The model provides information on the economically optimal responses to climate damages and identifies impacts of climate policy on global and regional economies.Footnote 3 In addition to CO2 emissions, non-CO2 gases are specified, with explicit modeling of emissions of CH4, N2O, SLF (short-lived fluorinated gases, i.e., HFCs with lifetimes under 100 years) and LLF (long-lived fluorinated, i.e., HFC with long lifetimes, PFCs and SF6).Footnote 4 The model also accounts for the direct cooling effects of SO2 aerosols. WITCH does not model agricultural practices, which largely drive non-CO2 gases, and relies on estimated reference emissions and mitigation supply curves, with resulting abatement levels determined endogenously.
Reference-case land-use CO2 emissions are also exogenous, based on BAU estimates from other studies, which are then reduced by the endogenously calculated levels of RED, as discussed below. The sum of these land-use CO2 emissions plus the energy sector emissions is an input to a three-box model used to mimic the carbon cycle. A simple relationship translates CO2 concentrations into radiative forcing (Intergovernmental Panel on Climate Change (IPCC), Reference Houghton, Ding, Griggs, Noguer, van der Linden, Dai, Maskell and Johnson2001, table 6.2, first row). WITCH uses the global warming potential methodology for other GHGs, based on the potentials and base year stocks from IPCC (Reference Parry, Canziani, Palutikof, van der Linden and Hanson2007a). A reduced form climate module calibrated with the Model for the Assessment of Greenhouse-gas Induced Climate Change (MAGICC) climate model is then used to derive temperature increases from radiative forcing (Meinshausen et al., Reference Meinshausen, Raper and Wigley2008).
WITCH is a hybrid model that combines both top-down and bottom-up features: the top-down component is an intertemporal optimal growth model in which the energy input of the aggregate production function is expanded to yield a bottom-up description of the energy sector. The model provides a fully intertemporal allocation of investments in energy technologies and R&D that is used to evaluate responses to different policy measures. In WITCH, technological progress in the energy sector is endogenous, thus enabling analysis of the effects of different stabilization policies on induced technical change, via both innovation and diffusion processes. Endogenous technical change plays a critical role in the modeling of climate policies, as analyzed in detail in Bosetti et al. (Reference Bosetti, Carraro, Duval, Sgobbi and Tavoni2009). The model's dynamic system also accounts for feedback effects from economic variables to climatic variables and vice versa.Footnote 5
Countries are grouped in 12 world regions whose strategic interactions are modeled through a dynamic game.Footnote 6 The game theory setup accounts for interdependencies and spillovers across regions, and equilibrium strategies reflect inefficiencies induced by global strategic interactions. This allows the analysis of fully cooperative equilibria (for example, in the case in which all regions of the world sign a climate agreement) and more partial and regional coalitional equilibria.
Several features of WITCH allow investigation of several issues in greater detail compared with other energy and climate models. First, though relatively rich in its energy modeling and close in spirit to bottom-up energy models, WITCH is based on a top-down framework that guarantees the coherent, fully intertemporal allocation of investments. Second, the model tracks all the actions that impact mitigation, including mitigation options in both the electric power and nonelectricity energy sectors. The options in the electric power sector include nuclear, hydroelectric, integrated gasification combined cycle plus carbon capture and storage (IGCC–CCS), renewables (e.g., wind and solar) and a backstop option that can substitute for nuclear. In the nonelectricity sector, mitigation options include advanced biofuelsFootnote 7 and a backstop option that can substitute for oil. Other important options are the endogenous improvement of overall energy efficiency, as a result of dedicated energy R&D, and reduced deforestation emissions, as detailed below. R&D expenditures, investment in carbon-free technologies, and purchases of emission permits/credits or carbon tax expenditures are simultaneously evaluated at equilibrium.
Diffusion and innovation processes are modeled to capture advancements in mitigation technologies, through both learning-by-doing and research. WITCH explicitly includes international technology spillovers and reflects innovation market failures. The detailed representation of endogenous technical change and the inclusion of spillovers in technologies and knowledge are crucial for assessing the impact of forestry mitigation on energy sector innovation.
The WITCH forecast of baseline emissions falls in the middle range of other integrated assessment models, with estimated fossil fuel CO2 emissions growing from the current 30 billion tons (Gt) to 47 in 2030 and 86 in 2100 under BAU. Through 2030, the BAU emissions are roughly 10 per cent above the forecasts of the Energy Information Administration (EIA; 2008) and International Energy Agency (IEA; 2007). The drivers of these emissions can be decomposed into carbon intensity of energy, energy intensity of the economy, per capita GDP and population (Kaya and Yokobori, Reference Kaya and Yokobori1997). Since 1980, rising per capita GDP and population have been the major drivers of emissions growth, whereas carbon intensity improvements reined back emissions. In WITCH's BAU scenario, economic growth remains an impetus for emissions over the century. Population growth contributes to rising emissions until 2075, when population starts to decline with a negative impact on emissions. Decreasing energy intensity of GDP slows emissions growth but does not countervail economic and population pressures until 2050, when total emissions trend down. The carbon content of global energy production rises only slightly over time along with rising coal use in China, India and other fast-growing countries.
2.2 Forestry and land-use models
Given uncertainty surrounding both tropical forestry emission baselines and the costs of reducing emissions from deforestation for different regions and time periods, we consider three different sets of RED cost curves derived from distinct models external to WITCH. By abstracting from institutional details, transaction costs and other real-world complications, these models estimate theoretical potentials for RED but likely understate the actual economic costs of reducing deforestation emissions in practice. Greater estimated RED supplies provide greater scope for detecting potential suppression of technological innovation.
One set of supply curves comprises the estimated compensation needed to cover 30 years of opportunity costs of reducing deforestation emissions in the Brazilian Amazon on the basis of modeling from the Woods Hole Research Center (WHRC) (Nepstad et al., Reference Nepstad, Soares-Filho, Merry, Moutinho, Oliveira Rodrigues, Bowman, Schwartzman, Almeida and Rivero2007).Footnote 8 This analysis integrates spatially explicit partial equilibrium models of potential land rents from soy, timber and cattle ranching within a deforestation simulation model (Soares-Filho et al., Reference Soares-Filho, Nepstad, Curran, Cerqueira, Garcia, Ramos, Voll, McDonald, Lefebvre and Schlesinger2006). Brazil alone accounts for up to one half of global deforestation in the humid tropics in recent periods (Hansen et al., Reference Hansen, Stehman, Potapov, Loveland, Townshend, DeFries, Pittman, Arunarwati, Stolle, Steininger, Carroll and DiMiceli2008). Given Brazil's institutional and land-use monitoring capabilities, climate policy commitments and market developments supporting low-deforestation agriculture, Brazil-only RED is potentially a realistic near-term policy scenario (see Nepstad et al., Reference Nepstad, Soares-Filho, Merry, Lima, Moutinho, Carter, Bowman, Cattaneo, Rodrigues, Schwartzman, McGrath, Stickler, Lubowski, Piris-Cabezas, Rivero, Alencar, Almeida and Stella2009). Nevertheless, the WHRC's model does not account for potential ‘leakage’ shifts in deforestation to other parts of the world, such that their estimates will likely understate the costs of achieving global emissions reductions through RED efforts limited to the Brazilian Amazon.
We also consider two estimates of the global potential for RED, based on a scenario in which all tropical forest nations immediately join a carbon trading system and have the capacity to fully implement deforestation reduction programs. These estimates are for the total reductions in deforestation emissions that could be profitably achieved at different levels of prices applied at the global level. In reality, countries vary widely in both their willingness and ability to reduce and monitor deforestation. The global model estimates are for an idealized policy in which all gains in the modeled stocks of forest carbon relative to BAU are continually rewarded according to the prevailing carbon market price. In practice, a global REDD system could provide a less comprehensive set of incentives. Fewer sources of mitigation and greater potential for leakage would undermine the effectiveness of reductions achieved in any particular location and further increase the costs of reducing deforestation emissions.Footnote 9 For these reasons, the global estimates used for this analysis may also underestimate the costs of RED under less than comprehensive policies.
The global RED estimates used for this study are from two of the leading economic models of global forests, based on scenarios for rising carbon prices that approximate those in our policy simulations. We consider results from the GTM prepared for the Energy Model Forum 21 (EMF-21) at Stanford University (Sohngen and Sedjo, Reference Sohngen and Sedjo2006).Footnote 10 GTM is a dynamic partial equilibrium model that optimizes changes in deforestation, afforestation and forest management across 10 world regions, accounting for the competition between forests and agricultural uses. This model was used in the previous analysis based on WITCH by Tavoni et al. (Reference Tavoni, Sohngen and Bosetti2007) and is also used by the US Environmental Protection Agency for its analyses of proposed Federal climate legislation. We use the GTM estimates to approximate marginal abatement cost curves based on carbon prices rising at a real rate of about 5 per cent annually.Footnote 11 This scenario is consistent with the exponential growth of carbon prices predicted by WITCH under the scenarios with banking but will tend to overestimate RED supply in cases without banking, which result in a lower price through 2040 and higher price thereafter, as discussed below. Although GTM also predicts forest management and afforestation responses, we only include the estimates for reducing deforestation emissions.
As an alternative, we also incorporate estimated costs of RED from linked runs of the International Institute for Applied Systems Analysis (IIASA) model cluster (Gusti et al., Reference Gusti, Havlik and Obersteiner2008), used by the UK Office of Climate Change in the review by Eliasch (Reference Eliasch2008). These estimates are from a spatially explicit global model of forestry and agricultural land use (The Global Forestry Model, G4M) linked to a partial equilibrium model (Global Biomass Optimization Model, GLOBIOM) that accounts for feedbacks between land-use and land-based commodity prices. We use IIASA's estimates on the basis of carbon prices rising at a cubic rate, as the most consistent with our policy scenarios. In contrast to the GTM results, IIASA's cubic price path approximates the carbon price trajectory predicted by WITCH under scenarios without banking, while relatively underestimating RED potential in cases with banking, which result in higher near-term and lower long-term carbon prices.Footnote 12 While IIASA also models afforestation/reforestation and forest biomass for bioenergy, we only incorporate the results for reducing deforestation.
These models differ in the BAU levels of forestry emissions as well as in the estimated costs and quantities of available reductions.Footnote 13 The varying baselines arise from differences in the underlying data on land use and carbon, assumptions over deforestation drivers and regional coverage (see Kindermann et al., Reference Kindermann, Obersteiner, Sohngen, Sathaye, Andrasko, Rametsteiner, Schlamadinger, Wunder and Beach2008). We adjust the BAU land-use emissions in WITCH to be consistent with each RED scenarioFootnote 14 but do not attempt to reconcile any socioeconomic assumptions in WITCH with those underlying the different deforestation scenarios. This means there is only partial consistency in our modeling of the forestry and nonforestry sectors.
The models provide a range of estimated RED potential, with IIASA estimating the greatest total supply. At prices of $11, $23 and $55 per ton of CO2, IIASA estimates global deforestation emission reductions of 1.8, 2.6 and 3.1 Gt of CO2 respectively in 2010 and 3.0, 3.7 and 3.9 Gt in 2030. The estimated reductions at these prices from the GTM runs we use are about 25–50 per cent lower in 2010 and 50–65 per cent lower in 2030, largely due to lower projected baseline deforestation emissions.Footnote 15 At $11, $23 and $55 per ton of CO2, the respective GTM estimates are 0.8, 1.8 and 1.9 Gt in 2010 and 0.7, 1.0 and 1.6 Gt in 2030.
Although limited to the Brazilian Amazon, the WHRC modeling estimates significant potential reductions from deforestation as the estimated opportunity costs of avoiding deforestation are lower than those from the global models. One reason is that the global models incorporate price feedbacks, with avoided deforestation efforts raising the global market price of agricultural land, thus making reductions in deforestation more costly. Another reason is that WHRC considers timber revenues from sustainable forest management as a benefit from conserving forests, in contrast to the GTM and IIASA models where this is not necessarily the case. The WHRC study assumes constant baseline emissions from deforestation in the Brazilian Amazon of 916 million tons (Mt) of CO2 per year and estimates the upfront payment necessary to cover 30 years of opportunity costs. This methodology is consistent with a carbon price trajectory rising over time at the real interest rate of 5 per cent in their model and thus most consistent with our policy scenarios with banking. WHRC estimates that 570 Mt of CO2 would be reduced at a price of $11 per ton in 2010, with costs rising sharply for higher quantities. In 2030, WHRC estimates reductions of 760 and 800 Mt of CO2 for prices of $11 and $24 per ton, respectively.Footnote 16
Finally, we note limitations of the study. We do not consider the mitigation opportunities from afforestation/reforestation and changing forest management. We also do not model potential interactions between the forest and energy sectors, other than via RED credits in the carbon market, such as impacts of climate policy on bioenergy demand and consequences for deforestation. Similarly, we do not model interactions between deforestation and agriculture, which could be especially important for non-CO2 emissions. Feedbacks between the climate and forests, which could affect both emissions and mitigation potential, were also beyond the scope of this study.
3. Policy scenarios
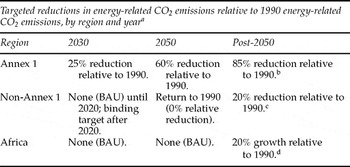
The basic policy scenario, rather than stemming from purely scientific and economic concerns (e.g., the least-cost path for stabilizing GHGs), draws from a potentially more realistic set of targets for broad country groups. We consider industrialized countries adopting binding emission-reduction commitments initially and developing countries committing to reductions later. By tuning the level of effort during the second half of the century, we then construct a scenario that hits the atmospheric concentrations target of 535 ppmv CO2 equivalent (CO2e) by 2100. This is at the upper end of the 450–550 ppmv stabilization range considered necessary by Stern (Reference Stern2007) to avoid dangerous human interference with the climate under the mandate of the UNFCCC. We are conservative in the assumed targets that the global community may be able to agree upon and explore how RED could contribute to deepening these goals. The basic policy architecture is shown in table 1.
CO2 targets for different groups of countries in the basic policy architecture

aThe allowable emissions of other Kyoto gases are allocated in proportion to the allowed shares of CO2 emissions under these targets.
bLinear emission reductions such that cumulative abatement effort over century is about 75% with respect to BAU.
cLinear emission reductions such that cumulative abatement effort over century is about 65% with respect to BAU.
dEmissions stabilized at 2050 levels (cumulative abatement effort over century is about 30% with respect to BAU).
Our basic climate policy scenario assumes that Annex 1 countries reduce emissions to 25 per cent below 1990 levels by 2030 and 60 per cent below 1990 levels by 2050. These targets are in the range of the EU's ‘shared vision’ for industrialized countries, which proposes cutting emissions relative to 1990 levels by 20–30 per cent by 2020 and 60–90 per cent by 2050. By considering Annex 1 reductions of 60 per cent below 1990 levels by 2050, we consider the relatively less stringent range of the proposed long-term targets, which are the most important factor in providing incentives for technological R&D and investments in our modeling framework.Footnote 17 This provides greater scope for estimating potential reductions in technology innovation from linking RED to the market for GHG reductions.
In our base case scenario, developing countries continue along their BAU emissions path until 2020, as also modeled in other recent studies (e.g., Paltsev et al., Reference Paltsev, Reilly, Jacoby, Gurgel, Metcalf, Sokolov and Holak2007) and the US EPA's (2009) analyses. After 2020, Africa continues along BAU until 2050, while all other developing countries linearly reduce to 1990 levels by 2050. After 2050, Africa's emissions remain constant, while other countries continue to reduce, producing cumulative abatement with respect to BAU over the century of about 65 and 75 per cent for non-Annex 1 and Annex 1, respectively. Restrictions on other GHGs are allocated to regions in proportion to their share of CO2 allocations. These targets result in radiative forcing around 3.5 W/m2 by the end of the century.
Our basic policy scenario models a global market that is limited until 2020 such that Annex 1 countries can only buy up to 10 per cent of their allocated emissions from international sources and is unconstrained thereafter. This restriction mimics the ‘supplementarity’ constraints proposed for EU and US carbon market designs. Our market scenario allows full flexibility of trading across gases, with permits for CO2 and non-CO2 emissions fungible on a GHG-equivalent basis.
Figure A1 (in online Appendix available at http://journals.cambridge.org/EDE) shows what this basic scenario means in terms of global emissions, mitigation efforts of OECD and non-OECD countries and GHG concentrations and predicted temperature increases. Estimates relative to the basic policy scenario are compared against estimates for the baseline (BAU) scenario. While emissions and GHG concentrations rise under BAU, producing a mean predicted value of warming close to 4°C by the end of the century, the policy scenario stabilizes concentrations around 535 ppmv CO2e and is estimated to limit the mean global temperature rise to less than 2.5°C below preindustrial levels. The OECD countries undertake the major share of estimated global reductions domestically in the early years and continue reducing in absolute terms until around 2075. Estimated reductions outside the OECD equal reductions within the OECD by 2025 and double the OECD reductions by 2100.
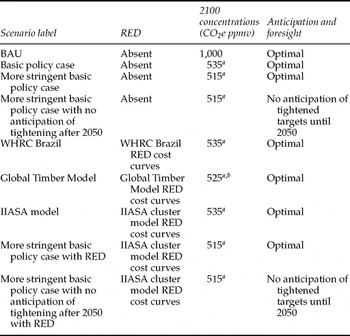
To examine the impact of linking RED to the carbon market, we run variations of the basic policy scenario with and without availability of RED as a mitigation option, using each of the three estimates of RED supplies described above. A full account of all simulation runs is provided in table 2. In these scenarios, credits from RED are freely fungible with permits for emissions in other sectors. We also run two additional variations of each scenario, fully allowing banking flexibility and not allowing banking at all. With banking, each region can flexibly bank or borrow permits to minimize costs of meeting its cumulative GHG emissions constraint through 2100.Footnote 18
Policy scenarios

aResults reported are for scenarios without banking. Each case is also modeled with full banking, producing slightly different emission paths over the century, though resulting 2100 concentration levels vary by under 1%.
bBAU land-use emissions are lower in the GTM estimates such that the same policy leads to lower 2100 concentrations.
To explore the potential role of RED and technology innovation in the event of a future need to tighten climate targets, we consider another set of scenarios that continue as in the base case through 2050, at which point the world adopts a more stringent climate target. This target is assumed to require the strictest policy that WITCH predicts is feasible as of that point in time, which achieves concentrations of 515 ppmv CO2e by 2100. We run this scenario both with and without RED, focusing, for simplicity, on the RED cost curves from IIASA, and consider cases with and without anticipation of the new emissions targets as of 2050. ‘With anticipation’ represents the most cost-effective case when the new target is perfectly foreseen by market actors. ‘Without anticipation’ represents the other extreme of no anticipation when market participants follow their optimal responses to the original target up until 2050 and only then adjust to the new constraints.
4. Results and discussion
The results on the role of RED in the abatement portfolio and the effects on deforestation and policy costs are summarized in table A1 (available in online Appendix at http://journals.cambridge.org/EDE). RED represents a relatively important although declining share of overall global abatement, particularly when banking enables countries to take greater advantage of cost-effective opportunities in the early periods. The global RED estimates differ in terms of costs, quantities and regional distribution but yield similar aggregate patterns. In the cases with banking and the GTM and IIASA models, respectively, RED represents between a 19 per cent and 20 per cent share of cumulative abatement by 2020, falling to about 9 per cent by 2050 and 4 per cent for both models by 2100. Without banking, the contribution of RED is less than half as much over the first decades and slightly lower over the century, providing 3–8 per cent of cumulative abatement by 2020, 7 per cent by 2050 and 3–4 per cent by 2100 in the GTM and IIASA cases.
Using the WHRC Brazil estimates, RED is still a significant source of abatement and actually represents a larger share of total abatement in the case without rather than with banking. RED from Brazil is estimated to be a relatively cost-effective source of abatement in the early years which, given its more limited scale, is largely pursued even without banking. In this case, RED represents 5.6 per cent (9.4 per cent), 2.9 per cent (3.1 per cent) and 1.6 per cent (1.6 per cent) share respectively of cumulative abatement by 2020, 2050 and 2100 with (and without) banking. As noted earlier, modeling deforestation leakage to other world regions would tend to reduce the estimated global contribution of Brazil-only RED.
The flexibility to better optimize the timing of abatement through banking shifts forward the time profile of abatement and slightly more so when RED is available. For example, in the IIASA case without banking, 22.6 per cent of abatement is achieved by 2050, both with and without RED. With banking, the share of abatement achieved by 2050 rises to 24.1 and 23.9 per cent with and without RED, respectively. The higher initial effort given banking reveals the suboptimal timing of abatement when reductions are fixed to a set of policy commitments.
In the base case, without RED and without banking, the permit price is estimated to begin at $4/tCO2e in 2010, rising sharply to $36 by 2020 and almost $400 by 2050. With banking, the price trajectory is flattened, with higher prices in early years and lower prices in later years (see figure A2 in online Appendix available at http://journals.cambridge.org/EDE).Footnote 19 With banking, the price rises to $87 over 2015–2019 but only to $330 over 2045–2049.Footnote 20 The availability of RED moderates the level of prices (see table A2 in online Appendix at http://journals.cambridge.org/EDE). In the no-banking cases, RED has negligible impacts on the price prior to 2020, as other abatement opportunities are relatively plentiful and international trading is restricted. However, the price falls by an estimated 11, 26 and 20 per cent in 2045–2049 and 12, 22 and 25 per cent in 2095–2099 in the WHRC Brazil, GTM and IIASA cases, respectively. With banking, prices are higher from the beginning because of the elevated demand for abatement, but RED consistently lowers the carbon price trajectory throughout the century, lowering prices by about 8–23 per cent in each of the periods 2015–2019, 2045–2049 and 2095–2099.
The estimated effect of linking RED to a global carbon market is to reduce deforestation emissions significantly and rapidly (see the middle rows in table A1). Under banking, global deforestation emissions fall by an estimated 16 per cent (WHRC Brazil), 72 per cent (GTM) and 50 per cent (IIASA) by 2020 and by 22 per cent (WHRC Brazil), 88 per cent (GTM) and 64 per cent (IIASA) by 2050. With global RED, declines in deforestation convert global forests into a net sink (i.e., negative net emissions) by 2050. While RED increases carbon market transactions, the lowered price means that international financial flows remain stable overall. Developing regions gain the value of forestry mitigation, which reaches $183–$216 billion per year over 2010–2049 under the global RED scenarios with banking.Footnote 21
The basic policy without RED results in cumulative global world product (GWP) losses over 2010–2099 of 2.5 per cent (1.8 per cent) at a 3 per cent (5 per cent) discount rate.Footnote 22 The flexibility of banking lowers these losses to 2.1 per cent (1.6 per cent) at a 3 per cent (5 per cent) discount rate. Despite the restrictions on trading and the modest relative contribution to global abatement, RED decreases the estimated global costs of the climate policy, depending on the modeled supplies and the availability of banking. Without banking, RED lowers policy costs for the century by 11, 24 and 22 per cent respectively, based on the WHRC Brazil, GTM, and IIASA estimates. Irrespective of RED, banking lowers costs. With banking, RED further reduces costs by 10, 21 and 23 per cent, respectively.Footnote 23 These estimated effects of a global RED scenario have a greater impact on policy costs than the availability/absence of different carbon-free and low-carbon technologies analyzed in other studies (e.g., Bosetti et al., Reference Bosetti, Carraro, Duval, Sgobbi and Tavoni2009).
The cost savings from introducing RED indicate that a more stringent target is feasible for the same costs as in the case without RED. Focusing on the IIASA estimates, we simulate a series of more stringent scenarios in which we escalate proportionally all regional efforts after 2050 until we reach the same costs as in the basic policy scenario without RED (a 2.5 per cent estimated decline in GWP). This exercise suggests that introducing RED enables a policy achieving 20 ppmv of CO2e concentrations below the base policy case without any added discounted costs.
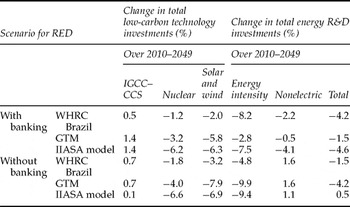
We now examine technology development in the energy sector. Our results indicate a generally negative but modest overall effect of RED on energy technology R&D and low-carbon technology investments, although we also find small positive impacts for particular technologies (see table 3). The effect of RED on technology R&D, investments and resulting innovation follows two channels. On one hand, RED makes it possible to attain the policy target while slightly relaxing the need to reduce energy emissions. RED allows for a 2, 8 and 10 per cent increase in the cumulative energy sector emissions over 2010–2049 in the WHRC Brazil, GTM and IIASA REDD scenarios, respectively. With RED, the pressure to improve carbon efficiency in 2030 and 2050 is lower, expanding the market for fossil fuel technologies, compared with the policy without RED. Under BAU, energy efficiency improves slightly, while carbon efficiency slowly declines relative to the past 30 years, primarily due to increased coal use in developing countries. Both with and without RED, energy and carbon efficiencies improve dramatically under the climate policy (see figure A3 in online Appendix available at http://journals.cambridge.org/EDE).
Impact of RED on cumulative technology investments over 2010–2049a

aChanges are reported relative to the corresponding base policy case without RED for each scenario with and without banking.
By granting some leeway to the fossil fuel sector, linking RED to the carbon market decreases investments in the development of renewable (wind and solar) and nuclear energy sources, as well as in energy-intensity R&D. Estimated investment in the global RED cases is 2–8 per cent below the non-RED climate policy case. The order of magnitude is modest compared with the substantial estimated increases in all these investments as a result of the climate policy relative to the no-policy cases (ranging from 60 to 80 per cent for solar/wind and energy-intensity R&D). Comparing the three RED models, the IIASA cases show the highest overall impacts in the cases with banking, due to the greater cumulative RED supplies estimated with this model. The impacts from GTM become larger relative to those from the other models in the scenarios without banking, as GTM predicts greater RED supplies at the low initial prices of the no-banking scenarios.
While there is a trade-off between relaxing the constraint on energy sectors emissions and investments in renewable, nuclear and energy-intensity R&D, a different story explains investments in IGCC–CCS technologies. This technology is not entirely carbon-free given an estimated emissions capture rate of 90 per cent, such that relaxing constraints on energy emissions improves the competitiveness of the IGCC–CCS option. Over the medium run, investments in IGCC–CCS technologies thus expand slightly from the introduction of RED (around 1 per cent in the global cases, as shown in table 3).
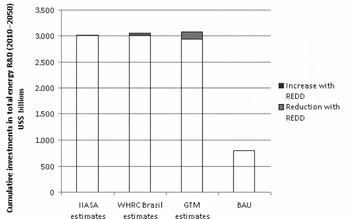
The second channel through which RED affects the estimated patterns of energy technology investments is via the impact on fossil fuel prices. Because RED permits greater flexibility in reducing fossil fuel consumption, the prices of fossil fuels, particularly oil, are slightly higher under the RED versus no-RED policy scenarios. This increases the relative profitability of investments in alternative carbon-free technologies in the nonelectricity sector and boosts the associated R&D efforts. This second channel interacts with the first in determining the optimal level of R&D in nonelectric breakthrough technologies which compete with oil in the transportation sector. Thus, the overall estimated effect of RED on nonelectric R&D is either slightly negative or positive (in the cases with and without banking, respectively). With banking, R&D in all technologies is higher in the baseline, and the overall effect of RED in lowering the need for innovation dominates the impact on nonelectric R&D, compared with the case without banking, where the influence of oil prices predominates. Figure 1 illustrates the effect of RED on innovation investments for total energy R&D, focusing on the policy cases without banking (figure A4, in the online Appendix at http://journals.cambridge.org/EDE, shows the impact on carbon-free technologies). These effects are again modest compared with the leap in investment spurred by the climate policy relative to the BAU scenario.
Impact of RED on cumulative investments in total energy R&D over 2010–2049, under scenarios without banking

We now consider the more stringent policy case with a tightening of targets after 2050. When targets are anticipated, introducing RED has smaller impacts on innovation. Focusing on the IIASA case without banking, introducing RED lowers nuclear investments over the first half of the century by 1 per cent with anticipation and almost 7 per cent without anticipation. Similarly, the decrease in wind and solar investments falls from about 7 per cent to less than 4 per cent, while the contraction of energy intensity R&D falls from over 9 per cent to less than 7 per cent in the case with versus without anticipation.
The interaction between RED, technology innovation and banking affects the ability of the global economy to respond to both expected and unexpected increases in the stringency of climate policy. For the case with banking and the RED estimates from IIASA, table A3 (in online Appendix available at http://journals.cambridge.org/ED) summarizes the loss of GWP under the scenarios with tightening of the targets after 2050. In the cases without anticipation, the introduction of RED lowers pre-2050 investments in nuclear, solar and wind, and energy-intensity-improving technologies below the cost-effective levels achieved with full anticipation. Regardless, total discounted climate policy costs over the century are still lower in the cases where RED is available, outweighing the costs of the lower technology investments.
Lower costs are incurred before as well as after 2050 in the cases with versus without RED. The reduction in costs after 2050 when RED is available stems principally from the additional banked abatement achieved through RED by mid-century. Even with no anticipation, the availability of RED spurs greater reductions prior to 2050 in the cases where banking is possible. Fewer reductions are thus needed after 2050 if targets are then tightened, as the banked abatement provides a head start on the additional mitigation required. This cushion from banked abatement increases flexibility, containing costs from an unexpected increase in policy stringency. In a case with no anticipation and RED limited to just the first part of the century, estimated policy costs after 2050 are still lower in the RED case because of the greater levels of banked abatement.Footnote 24
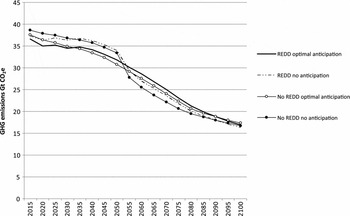
The combination of RED and banking contains the increased costs from an unexpected tightening of climate targets by more than the additional investments in energy technologies that are made in the cases without RED. Figure 2 illustrates the estimated path of GHG emissions under the different scenarios. The simple black line is the least-cost path under RED and full policy anticipation. This involves lower emissions through 2035 and more thereafter compared with the case of full anticipation without RED. Without anticipation, the emissions path with RED is significantly closer to the cost-effective path than without RED over the early and later parts of the century (though emissions are slightly higher with RED over 2030–2050, when the banked abatement begins to be used). Without RED and without anticipation, emissions are significantly higher over the first part of the century but then must drop farther to meet the more stringent targets after 2050.
Impact of RED and policy anticipation on path of global GHG emissions under policy with tightening after 2050 (banking cases)

In the cases with optimal anticipation, costs are higher in the beginning of the century but substantially lower after 2050, both with and without RED, compared with the case without anticipation. Anticipation of the future target combined with RED provides the ability to deploy greater investments in RED as part of a larger and more optimal mitigation portfolio, including greater technology investments earlier in the century. This increases benefits from both policy foresight and from RED. At a 3 per cent discount rate, introducing RED lowers policy costs by 27 per cent with no anticipation but 30 per cent with optimal anticipation (table A3). Similarly, optimal anticipation lowers costs by 3 per cent without RED versus 7.5 per cent with RED, compared with the cases without anticipation.Footnote 25 These results suggest that opportunities created by RED are a synergistic element of strategies to control costs when more stringent climate policy targets may be needed in the future.
5. Conclusions
Efficient policies to address climate change over the long term will minimize the costs of reducing emissions while preserving flexibility to adapt to new circumstances that may require course corrections. This paper analyzes the effects of linking credits for reductions in emissions from deforestation to a global carbon market. The analysis is based on a dynamic integrated assessment framework, which explicitly models induced technological change in the energy sector. We incorporate expected patterns of global participation and institutional features, such as initial limits on international trading and potential for permit banking, and also use scenarios to explore the effect of RED on policy flexibility to tighten targets in the future.
Our research confirms that integrating RED into global carbon markets can provide significant incentives for curbing deforestation while mitigating emissions at lower costs, particularly when coupled with the flexibility of banking. Despite initial limitations on international trading, introducing RED lowers the discounted cumulative costs of achieving 535 ppmv concentrations by 2100 by an estimated 10–23 per cent depending on the estimated RED potential from only the Brazilian Amazon as well as all regions; the absolute and relative cost savings from RED are even larger if the stringency of global climate policy tightens after 2050. By the same token, we find that RED could enable further reductions of about 20 ppmv of CO2 equivalent by 2100 with no added discounted costs compared with the basic policy without RED.
Our estimated cost savings from RED are in the range reported in earlier studies. Our estimates indicate a 7–9 per cent share of global abatement from RED through 2050, declining to about 4 per cent through 2100, both with and without banking. This is lower than Tavoni et al.'s (Reference Tavoni, Sohngen and Bosetti2007) estimate that non-OECD and global forests could, respectively, contribute one quarter and one third of cost-effective abatement by 2050, with forestry defraying the costs of 50 ppmv additional reductions by 2100 compared with an energy-only policy. Their large estimated share of abatement from forestry stems partly from the more moderate global target considered (550 ppmv versus 450 ppmv CO2 only in our base policy case), requiring lower relative reductions from nonland sectors, and partly from their inclusion of RED along with afforestation/reforestation and changes in forest management.
Our estimated abatement shares from RED are higher for the first half of the century and lower for the second half of the century compared with the forestry abatement shares from the Model for Energy Supply Strategy Alternatives and their General Equilibrium impacts (MESSAGE) EMF-21 estimates reported in Rose et al. (Reference Rose, Ahammad, Eickhout, Fisher, Kurosawa, Rao, Riahi and van Vuuren2011). These MESSAGE EMF-21 estimates are 2–5 per cent for 2000–2050 and 8–11 per cent for the century, with the lower and upper ends corresponding to radiative forcing stabilization scenarios of 3.0 and 4.5 W/m2 (compared with 3.5 W/m2 in 2100 in our base policy case). For the 4.5 W/m2 scenario (about 650 CO2e), Rose et al. (Reference Rose, Ahammad, Eickhout, Fisher, Kurosawa, Rao, Riahi and van Vuuren2011) report estimated forestry shares of global abatement ranging from 1 to 55 per cent for 2000–2050 and 8 to 11 per cent for the century from the runs of the Global Relationship Assessment to Protect the Environment (GRAPE) model and the A2r as well as the EMF-21 versions of MESSAGE. Beyond differences in RED potentials, the larger estimated shares in some of these 4.5 W/m2 runs, relative to our study, may be due to the modeling of a less-stringent stabilization scenario (lowering relative mitigation required from nonland sectors), of an optimal policy scenario and of including afforestation strategies, which may be significant throughout the century.Footnote 26 Conversely, the smaller shares estimated with MESSAGE for the first half of the century could, at least in part, derive from the modeling of more land mitigation options, including agriculture and bioenergy, which could lower the relative contribution of forestry as well as directly compete for land.
Results from our different scenarios indicate that policy costs, carbon prices and technology innovation depend critically on the possibility of banking, both with and without RED. Previous studies have estimated the savings in costs from RED in the range of one third for 2020 (Anger et al., Reference Anger, Dixon and Livengood2009) and 25–50 per cent for 2030 (Eliasch, Reference Eliasch2008). For our base policy case, we find cost savings in the range of 7–20 per cent over 2010–2049, depending on the scale of RED and the possibility of banking. Our lower estimated savings are likely due to the modeled restrictions on international trading prior to 2020 as well as differences in the forestry models and climate targets. In terms of carbon prices, previous models without banking estimate reductions of 0–20 per cent in 2020 when the RED market is limited and as high as 45 per cent when the market is not restricted.Footnote 27 For 2015–2019, without banking, we estimate negligible carbon price impacts in line with Eliasch (Reference Eliasch2008). With banking, the price declines by an estimated 7 per cent in the Brazil-only case and by 22–23 per cent in the global RED scenarios, in the range of 18–22 per cent estimated by USCAP (2009) and Murray et al. (Reference Murray, Lubowski and Sohngen2009), respectively.
We find that RED generally reduces the portfolio of investments and R&D into lower-carbon energy technologies by about 1–10 per cent, depending on the RED estimates and policy case. These effects are relatively modest compared with the overall impacts of the policy versus no-policy cases and span a broader range than those reported by Tavoni et al. (Reference Tavoni, Sohngen and Bosetti2007), which correspond to the upper end of our energy-intensity R&D impacts. We also identify effects that vary across technologies. Notably, by relaxing the limit on fossil fuel emissions, linking RED to the carbon market slightly increases estimated investments in IGCC–CCS by 0.1–1.4 per cent. We estimate that RED provides flexibility that lowers demand for mitigation in the energy sector, thus slightly enhancing investments in fossil energy technologies. This, in turn, marginally raises the price of oil and other fossil fuels, increasing the relative competitiveness of alternative carbon-free technologies in the nonelectric sector. These results support Fuss et al. (Reference Fuss, Szolgayovat, Golub and Obersteiner2011) and Golub's (Reference Golub, Bosetti and Lubowski2010) findings that REDD could complement investments in CCS and other capital-intensive energy technologies, although we consider different mechanisms than the hedging of mitigation investment portfolio volatility examined in their studies.
Moreover, while reduced clean energy innovation could in principle hinder future efforts to reduce emissions, we find that linking RED to the carbon market overall enhances the ability to adopt more stringent policies in 2050. In particular, synergies between RED and permit banking provide a head start on mitigation, lowering the costs of greater cuts in global emissions after midcentury. Introducing RED lowers costs even when the policy tightening is completely unexpected, but benefits are largest when tightening is anticipated such that mitigation activities as well as technology investments can be planned accordingly. These results imply that enhanced near-term investments in RED and other low-cost mitigation options could help hedge downside economic risks from uncertain future climate policies, as suggested by Fuss et al. (Reference Fuss, Szolgayovat, Golub and Obersteiner2011) and Golub (Reference Golub, Bosetti and Lubowski2010).
An important area for future modeling includes tighter coupling of forestry and other land-based activities with the analysis of mitigation options, such as bioenergy, in other sectors of the economy. Our assessment of the impacts of RED in a global carbon market considered mitigation from reducing deforestation only, without considering other possible sources of forest sector abatement, such as afforestation/reforestation, as well as other sources of land-based abatement from changes in agricultural practices. Incorporating these additional opportunities would likely lead to additional cost savings, while lowering the relative impact of RED. Future research could further examine the value of forestry and other land-based mitigation in reducing costs and maintaining flexibility under different second-best policy settings, including delays in national abatement actions or incomplete global participation in RED and other GHG reduction efforts.