











1. Introduction
Recent launches of Imaging X-ray Polarimetry Explorer (IXPE; Weisskopf et al. Reference Weisskopf2016) and X-ray Polarimeter Satellite (XPoSat)Footnote a Missions have renewed interest in measuring X-ray polarisation from diverse astrophysical systems, in particular from accreting black hole (BH) systems of all scales. Accreting matter puffs up at the inner region of the disc, which not only upscatters soft photons through inverse Comptonization (Sunyaev & Titarchuk Reference Sunyaev and Titarchuk1980; Haardt & Maraschi Reference Haardt and Maraschi1993; Chakrabarti & Titarchuk Reference Chakrabarti and Titarchuk1995; Done, Gierliński, & Kubota Reference Done2007; Mondal & Chakrabarti Reference Mondal and Chakrabarti2013; Iyer, Nandi, & Mandal Reference Iyer, Nandi and Mandal2015, and references therein) but also polarises the radiation depending on its thermodynamic properties, geometry, and inclination (Connors, Piran, & Stark Reference Connors, Piran and Stark1980; Sunyaev & Titarchuk Reference Sunyaev and Titarchuk1985). Therefore, the measurement of polarisation angle (PA) and degree (PD) depends on both corona (Compton cloud) properties as well as the photon energy. Additionally, the presence of outflows from the disc can also produce significant polarisation due to scattering effects (Begelman & McKee Reference Begelman and McKee1983). The dependence of PD and PA on the optical depth and disc inclination was studied using different geometry of the corona in detail (Dovčiak et al. 2008; Li, Narayan, & McClintock Reference Li, Narayan and McClintock2009; Schnittman & Krolik Reference Schnittman and Krolik2010, and references therein). Therefore, if the corona properties of a system is well constrained, the PD can be estimated or the vice-versa. Hence, the spectro-polarimetric studies using broadband data may shed more light on the measurement of polarisation and the environment of the corona around BHs.
MCG-5-23-16 is a Seyfert 1.9 galaxy (Veron et al. Reference Veron, Lindblad, Zuiderwijk, Veron and Adam1980) located at redshift
 $z=0.00849$
(Wegner et al. Reference Wegner2003). The source is relatively bright in X-rays with F
 $_{2-10}$
=
 $7-10\times10^{-11}$
erg cm
 $^{-2}$
s
 $^{-1}$
(Mattson & Weaver Reference Mattson and Weaver2004) and characterised by moderate neutral absorption (
 $N_H \sim 10^{22}$
cm
 $^{-2}$
). It has been extensively studied in the X-ray band to estimate corona properties and spectral high-energy cut-off using INTEGRAL and NuSTAR observations (Beckmann et al. Reference Beckmann, Courvoisier, Gehrels, Lubiński, Malzac, Petrucci, Shrader and Soldi2008; Molina et al. Reference Molina, Bassani, Malizia, Stephen, Bird, Bazzano and Ubertini2013; Baloković et al. Reference Baloković2015; Zoghbi et al. Reference Zoghbi2017).
Furthermore, the X-ray spectrum of this source showed the presence of a soft excess and complex Fe K
 $\alpha$
emission with broad and asymmetric narrow line features in ASCA (Weaver et al. Reference Weaver, Yaqoob, Mushotzky, Nousek, Hayashi and Koyama1997), BeppoSAX, Chandra, and XMM-Newton (Dewangan, Griffiths, & Schurch Reference Dewangan, Griffiths and Schurch2003; Balestra, Bianchi, & Matt Reference Balestra, Bianchi and Matt2004; Braito et al. Reference Braito2007; Liu, Zoghbi, & Miller Reference Liu, Zoghbi and Miller2024) observations. It indicates the presence of two reflectors, one for a narrow core at 6.4 keV and the other for the broad component, possibly originating closer to the BH. Later, the broad line was explored with Suzaku (Reeves et al. Reference Reeves2007) and reported that the inner radius of the disc is 20 r
 $_s$
that originated the line, where r
 $_s$
=
 $2GM_{BH}/c^2$
is the Schwarzschild radius, with an inclination
 $50^\circ$
. Additionally, an absorption feature at 7.7 keV was unveiled in these data, pointing to the possible presence of ionised iron outflowing at
 $\sim0.1c$
. Recently, Serafinelli et al. (Reference Serafinelli2023) estimated the disc inclination of 41
 $^\circ$
from the broad Fe K
 $\alpha$
line study using NuSTAR observations. Marinucci et al. (Reference Marinucci2022) estimated the disc inclination
 ${48^\circ}^{+12}_{-8}$
from broad Fe K
 $\alpha$
line profile. The disc inclination also found to lie between
 $40^\circ-50^\circ$
(see also Weaver & Reynolds Reference Weaver and Reynolds1998). The mass of the central supermassive BH (SMBH) is
 $2\times10^7$
M
 $_\odot$
derived independently from both X-ray variability (Ponti et al. Reference Ponti, Papadakis, Bianchi, Guainazzi, Matt, Uttley and Bonilla2012) and infrared lines (Onori et al. Reference Onori2017).
Along with spectral and timing studies, X-ray polarisation provides an independent tool to constrain the accretion properties and coronal geometry. It has been reported that the polarisation is extremely sensitive to the geometry of the radiation emitting region and the photon field (Schnittman & Krolik Reference Schnittman and Krolik2010; Beheshtipour, Krawczynski, & Malzac Reference Beheshtipour, Krawczynski and Malzac2017; Tamborra et al. Reference Tamborra, Matt, Bianchi and Dovčiak2018, and references therein). To constrain the source coronal geometry, MCG-5-23-16 was targeted by two pointings in 2022 with IXPE.
The joint analysis of XMM-Newton, NuSTAR, and IXPE observations in May 2022 by Marinucci et al. (Reference Marinucci2022) obtained a 4.7% (at 99% confidence level) upper limit for the polarisation degree (PD) in the 2–8 keV energy band and ruled out the slab geometry of the corona. Authors also found a hint of alignment between the polarisation angle and the accretion disc spin axis. Later, Tagliacozzo et al. (Reference Tagliacozzo2023) analysed the IXPE data from both May and November 2022 epochs in coordination with NuSTAR and estimated the upper limit of PD to be 3.2 % (at 99% confidence level for one parameter of interest). Their preferred polarisation angle in the
 $\sim50^\circ$
direction may hint that the polarisation of the primary emission is aligned with the Narrow Line Region, which was observed at
 $\sim40^\circ$
position angle in Hubble Space Telescope’s WFPC2 images (Ferruit, Wilson, & Mulchaey Reference Ferruit, Wilson and Mulchaey2000) and therefore, parallel to the accretion disc axis, similar to what was found in NGC 4151 (Gianolli et al. Reference Gianolli2023). Such alignments may contribute to the polarisation measurement just below detection. The authors further compared their observed estimations with Monte Carlo simulations of the expected polarisation properties for different geometries of the corona and disfavoured the lamppost and cone-shaped corona.
Therefore, we see that polarisation can be used as a probe to understand the geometry of the corona and accretion-ejection behaviour around the central SMBH. The continuum models applied to study the spectral properties of the source MCG-5-23-16 mostly take into account radiative transfer processes. However, to date, no physically motivated accretion-ejection based models have been directly employed to fit and understand the polarisation properties with the corona geometry or accretion flow parameters. In this work, we have re-analysed the IXPE observations to confirm the previous studies jointly with NuSTAR data for both epochs (May and November 2022). Further, other data sets available in the NuSTAR archive were also analysed to constrain the corona properties and to predict the polarisation behaviour. Moreover, we have also estimated the mass outflow rate for all epochs, that connect the disc-corona-outflow geometry with polarisation from a single framework.
The paper is organised as follows: in Section 2, we discuss the observation and data reduction procedure. In Section 3, we describe the spectro-polarimetric data analysis results, and finally, we draw our conclusions in Section 4.
2. Observation and data reduction
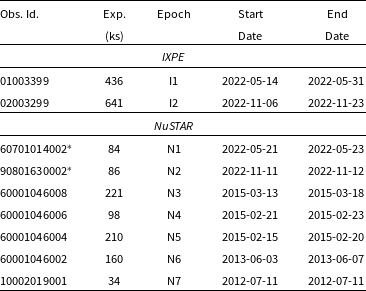
Over the past decade, MCG-5-23-16 was observed by NuSTAR (Harrison et al. Reference Harrison2013), spanning from 2012 to 2022. Most recently, the source was observed in May and November 2022 by IXPE (Weisskopf et al. Reference Weisskopf2016), launched on 2021 December 9, consisting of three Wolter-I telescopes, with 3 units of polarisation-sensitive imaging X-ray detector units (DUs) at the respective foci. We used all archival data from both observatories for this source and analysed them. The observation log is given in Table 1.
Log of observations of MCG-5-23-16. The
 $^\ast$
denotes data used for joint spectro-polarimetric analysis.
IXPE provides Level-2 data, which we cleaned and calibrated using standard FTOOLS tasks with the latest calibration files (CALDB 20230526) available in IXPE database. A circular region centred at the source of radius
 $60^{\prime\prime}$
(see Tagliacozzo et al. Reference Tagliacozzo2023, for details) is used for all detectors. A source-free background region of radius
 $100^{\prime\prime}$
is used to produce background subtracted spectra for I, Q, and U Stokes for all three DUs. Additionally, we applied a weighting scheme, STOKES = NEFF (Di Marco et al. Reference Di Marco2022) in XSELECT to generate the final Stokes spectra in the 2–8 keV energy band.
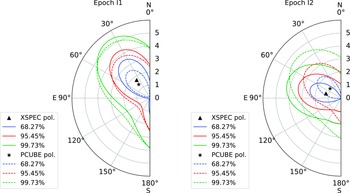
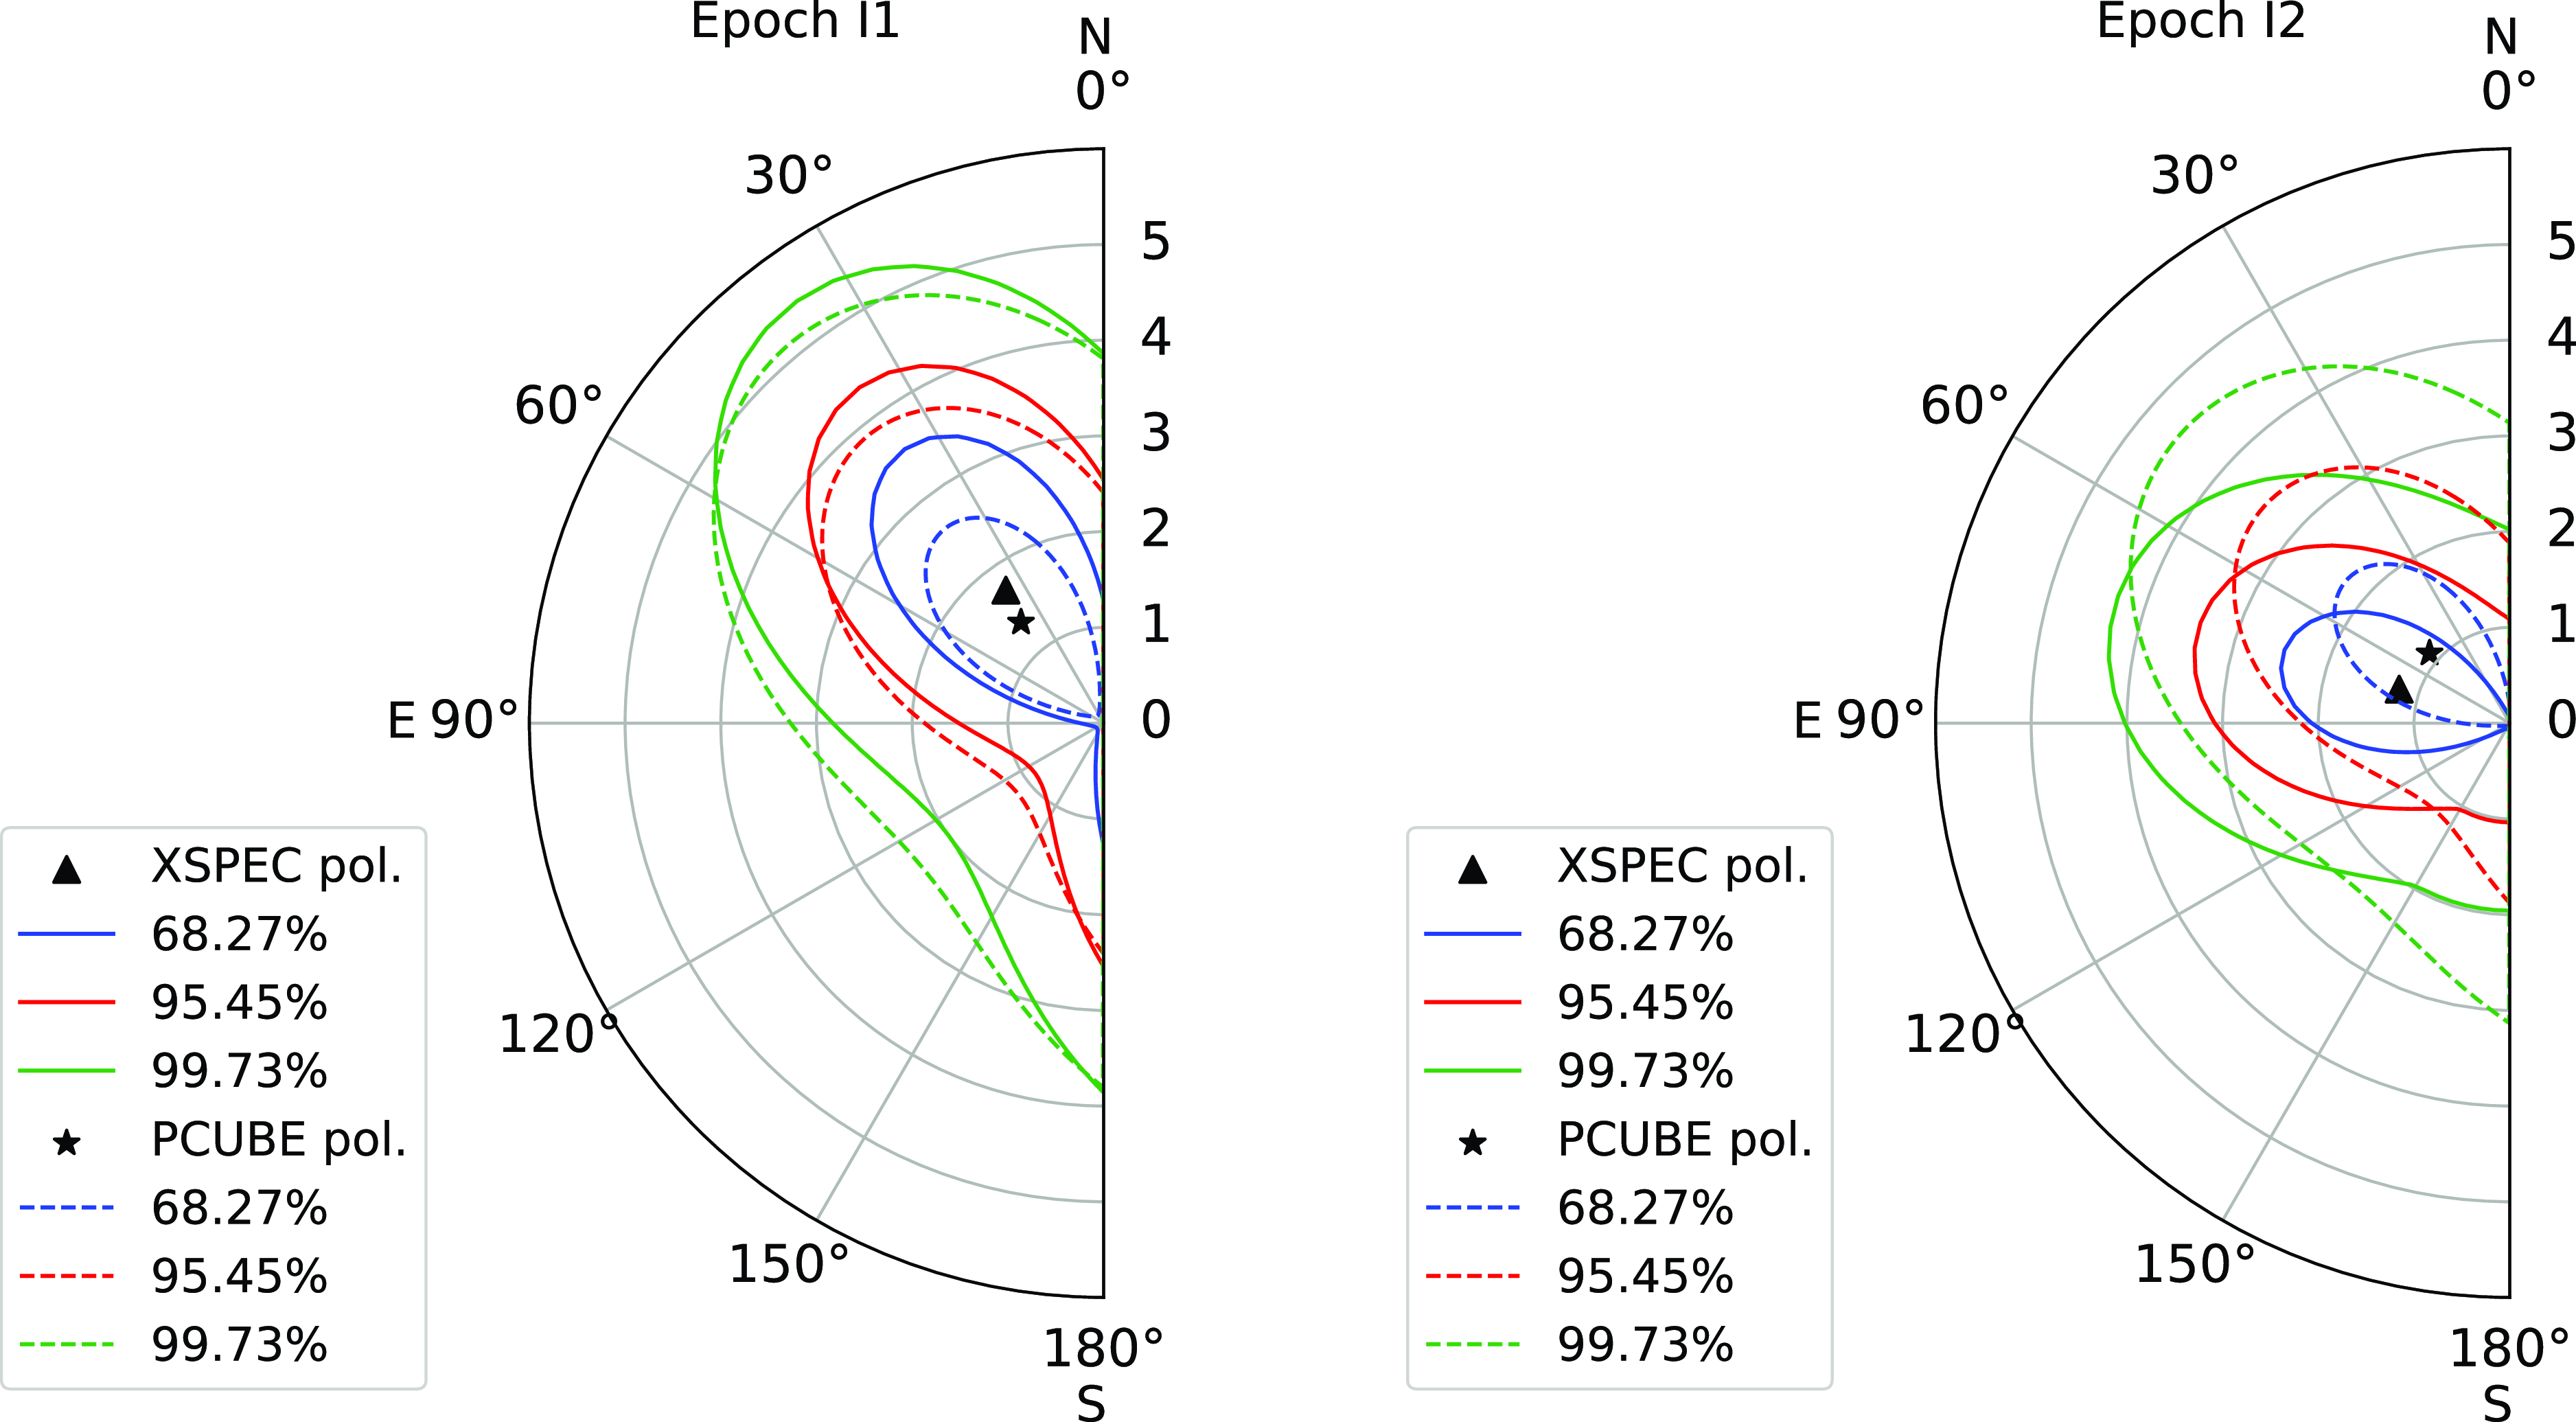
XSPEC (solid lines) and PCUBE (dashed lines) contour plots between polarisation degree PD and angle PA for May (I1; left) and November (I2; right) epochs in 2022. The blue, red, and green contours denote
 $1\sigma$
,
 $2 \sigma$
, and
 $3\sigma$
confidence levels. See the text for details.
The NuSTAR data were extracted using the standard NUSTARDAS v1.3.1
Footnote
b
software. We ran a nupipeline task to produce cleaned event lists and nuproducts along with CALDB version 20231121 to generate the spectra. We used a region of
 $25^{\prime\prime}$
for the source and
 $40^{\prime\prime}$
for the background using ds9 (Joye & Mandel Reference Joye, Mandel, Payne, Jedrzejewski and Hook2003). The data were grouped with a minimum of 30 counts in each bin using grppha command. For the analysis of each epoch of observation, we used the data of both IXPE and NuSTAR in the energy range of 2–8 and 3–79 keV. We used XSPEC
Footnote
c
(Arnaud Reference Arnaud, Jacoby and Barnes1996) version 12.12.0 for spectral analysis. The hydrogen column density for Galactic absorption set fixed to
 $7.8\times 10^{20}$
cm
 $^{-2}$
(HI4PI Collaboration et al. 2016; Kalberla et al. Reference Kalberla, Burton, Hartmann, Arnal, Bajaja, Morras and Pöppel2005) during the spectral fitting throughout.
3. Data analysis and results
3.1 Model-independent and model-dependent IXPE analysis
The processed Level-2 data were used for polarimetric analysis, using IXPEOBSSIM software v30.0.0 (Baldini et al. Reference Baldini2022). Source and background events were extracted using XPSELECT task. We obtained the polarisation parameters in the entire IXPE band of 2–8 keV using the model-independent PCUBE algorithm of the XPBIN task (Kislat et al. Reference Kislat, Clark, Beilicke and Krawczynski2015). Although, there are reports in the literature on the estimation of polarisation, here we have re-done the analysis for the sake of completeness.
Results of model-independent polarimetric analysis in the 2–8 keV band.
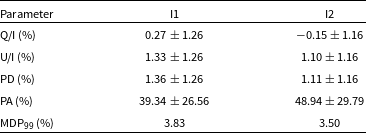
The results of our model-independent polarimetric analysis for the two epochs are summarised in Table 2. We obtain only upper limits of the PD for both epochs (below the minimum detectable polarisation at the 99% level). The measured PD and PA in 2–8 keV for the two epochs (I1 and I2) are shown in Fig. 1 along with the contours. The dashed lines correspond to PCUBE contours with 1
 $\sigma$
(blue), 2
 $\sigma$
(red), 3
 $\sigma$
(green) levels. The PD upper limit (99% confidence level) is
 $3.8\%$
and
 $3.5$
% in epochs I1 and I2 respectively. Our estimated upper limit of PD in I2 is consistent with the literature, however, in I1 is lower (Marinucci et al. Reference Marinucci2022; Tagliacozzo et al. Reference Tagliacozzo2023).
Further, we also performed a spectro-polarimetric model-dependent fit (Strohmayer Reference Strohmayer2017) using a phenomenological model, consisting of an absorbed CUTOFFPL convolved with a constant polarisation POLCONST which reads in XSPEC as CONST*ZTBABS*POLCONST*CUTOFFPL. The CUTOFFPL model has two spectral parameters, viz. cutoff energy (E
 $_{\mathrm{cut}}$
) and photon index (
 $\Gamma$
). The Stokes spectra for all three DUs in the energy band 2–8 keV are fitted simultaneously. A wilm abundance (Wilms, Allen, & McCray Reference Wilms, Allen and McCray2000) is used throughout the analysis. Since the determination of hydrogen column density may not be reliable owing to the lower energy limit of IXPE or NuSTAR, we freeze the value of intrinsic
 $N_H$
to
 $2.1\times 10^{22}$
cm
 $^{-2}$
, which is the average value determined from Chandra observations from 2000 to 2020 (Liu et al. Reference Liu, Zoghbi and Miller2024) and the Galactic
 $N_H$
fixed to
 $7.8\times 10^{20}$
cm
 $^{-2}$
.
We began by leaving all the spectral and polarimetric parameters to vary freely. We found that the obtained values of PD and PA are highly sensitive to the values of the spectral parameters. Keeping in mind the limited energy band and the spectral sensitivity of IXPE, we turned to simultaneous NuSTAR observations for obtaining robust spectral fits. In addition to the CUTOFFPL model, the NuSTAR data also required an emission feature at the Fe K line energy for a good fit. The full model reads in XSPEC as ZTBABS*(GAUSS+CUTOFFPL), which returned cutoff energy
 $\sim120$
keV, which is consistent with the previous findings by Marinucci et al. (Reference Marinucci2022) and Tagliacozzo et al. (Reference Tagliacozzo2023).
Subsequently, we re-did the IXPE fits by freezing the values of
 $E_{\mathrm{cut}}$
and
 $\Gamma$
to the best-fit values from the NuSTAR fit of the respective epoch, which is expected to give a more robust estimation of PD and PA. Note that the addition of a Gaussian line and reflection component neither improves the quality of the fit nor affects the value of the polarisation parameters, hence we did not include these two components while fitting the IXPE data. We obtain good fits for I1 and I2 using this model, with
 $\chi^2_{\mathrm{red}}=0.99$
and 0.92 respectively. We determine the PA =
 $36.3^\circ\pm19.4^\circ$
and
 $72.9^\circ\pm23.8^\circ$
and the PD (%) =
 $1.72\pm1.08$
and
 $1.21\pm0.89$
for the epochs I1 and I2 respectively. However, since the polarisation measurements have a low significance, their values as well as their apparent variation across the epochs should be interpreted with caution. The confidence contours from the model-dependent analysis are shown in Fig. 1. The model-dependent polarimetric results are summarised in Table 3. Note that it was mentioned in Tagliacozzo et al. (Reference Tagliacozzo2023) that the model-dependent contours match with the PCUBE contours. However, for I2, we found a small difference between the PA obtained using the two approaches, and the possible reason for this is not clear yet.
All Stokes spectra for all three DUs of IXPE are fitted using ZTBABS*POLCONST*CUTOFFPL model. The best-fitted parameters of the model-dependent polarimetric analysis are summarised here. All errors are estimated at the
 $1\sigma$
level. The
 $N_H$
value is frozen to
 $2.1\times 10^{22}$
cm
 $^{-2}$
.
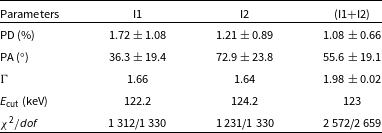
Further, since the PD measurements for both epochs have a low significance (from both model-dependent and model-independent approaches), we attempt to fit the two epochs simultaneously seeking a more significant polarisation estimation. Since the E
 $_{\mathrm{cut}}$
and
 $\Gamma$
values obtained from the NuSTAR fits do not vary significantly, we tie these values across I1 and I2. Then, we perform the simultaneous fit by constraining them across the epochs. A constant multiplicative factor has been included in the model to account for the cross-calibration across DUs as well as flux changes across epochs. The simultaneously fitted PD is
 $\sim$
10–40% less than the individual epochs and the PA is nearly the mean of the individual analysis since it is done under the assumption that the polarisation characteristics across the two epochs do not differ significantly. The model parameters are summarised in Table 3.
3.2 Spectral analysis of IXPE and NuSTAR
We performed a broadband spectroscopic analysis combining the 2–8 keV IXPE spectra and the 3–79 keV NuSTAR spectra from May and November 2022. The broadband energy range (2–79 keV) covered by the spectra of MCG-5-23-16 showed a broad Fe K line and a Compton hump above 10 keV. A Gaussian component was required which was free to vary, however, the line energy fitted at
 $\sim6.3$
keV for all observations.
As discussed earlier, the spectra showed the presence of another component that produces the excess emission, which can either be due to reflection (Done, Gierliński, & Kubota Reference Done2007) or a signature of mass loss (Chakrabarti Reference Chakrabarti1999) from the corona region. Therefore, we have used two different sets of models one is the accretion-ejection based JeTCAF model (Mondal & Chakrabarti Reference Mondal and Chakrabarti2021), and the others are reflection-based pexrav (Magdziarz&Zdziarski Reference Magdziarz and Zdziarski1995) and relxillCp models (Dauser et al. Reference Dauser, Garcia, Parker, Fabian and Wilms2014; Garcia et al. Reference Garcia2014). Additionally, we have analysed all the NuSTAR archival data for the source MCG-5-23-16 covering a decade of observations (see Table 1) to understand the variation of accretion and reflection parameters and predict the polarisation degree from the model-fitted accretion disc parameters.
3.2.1 Accretion-ejection based JeTCAF model
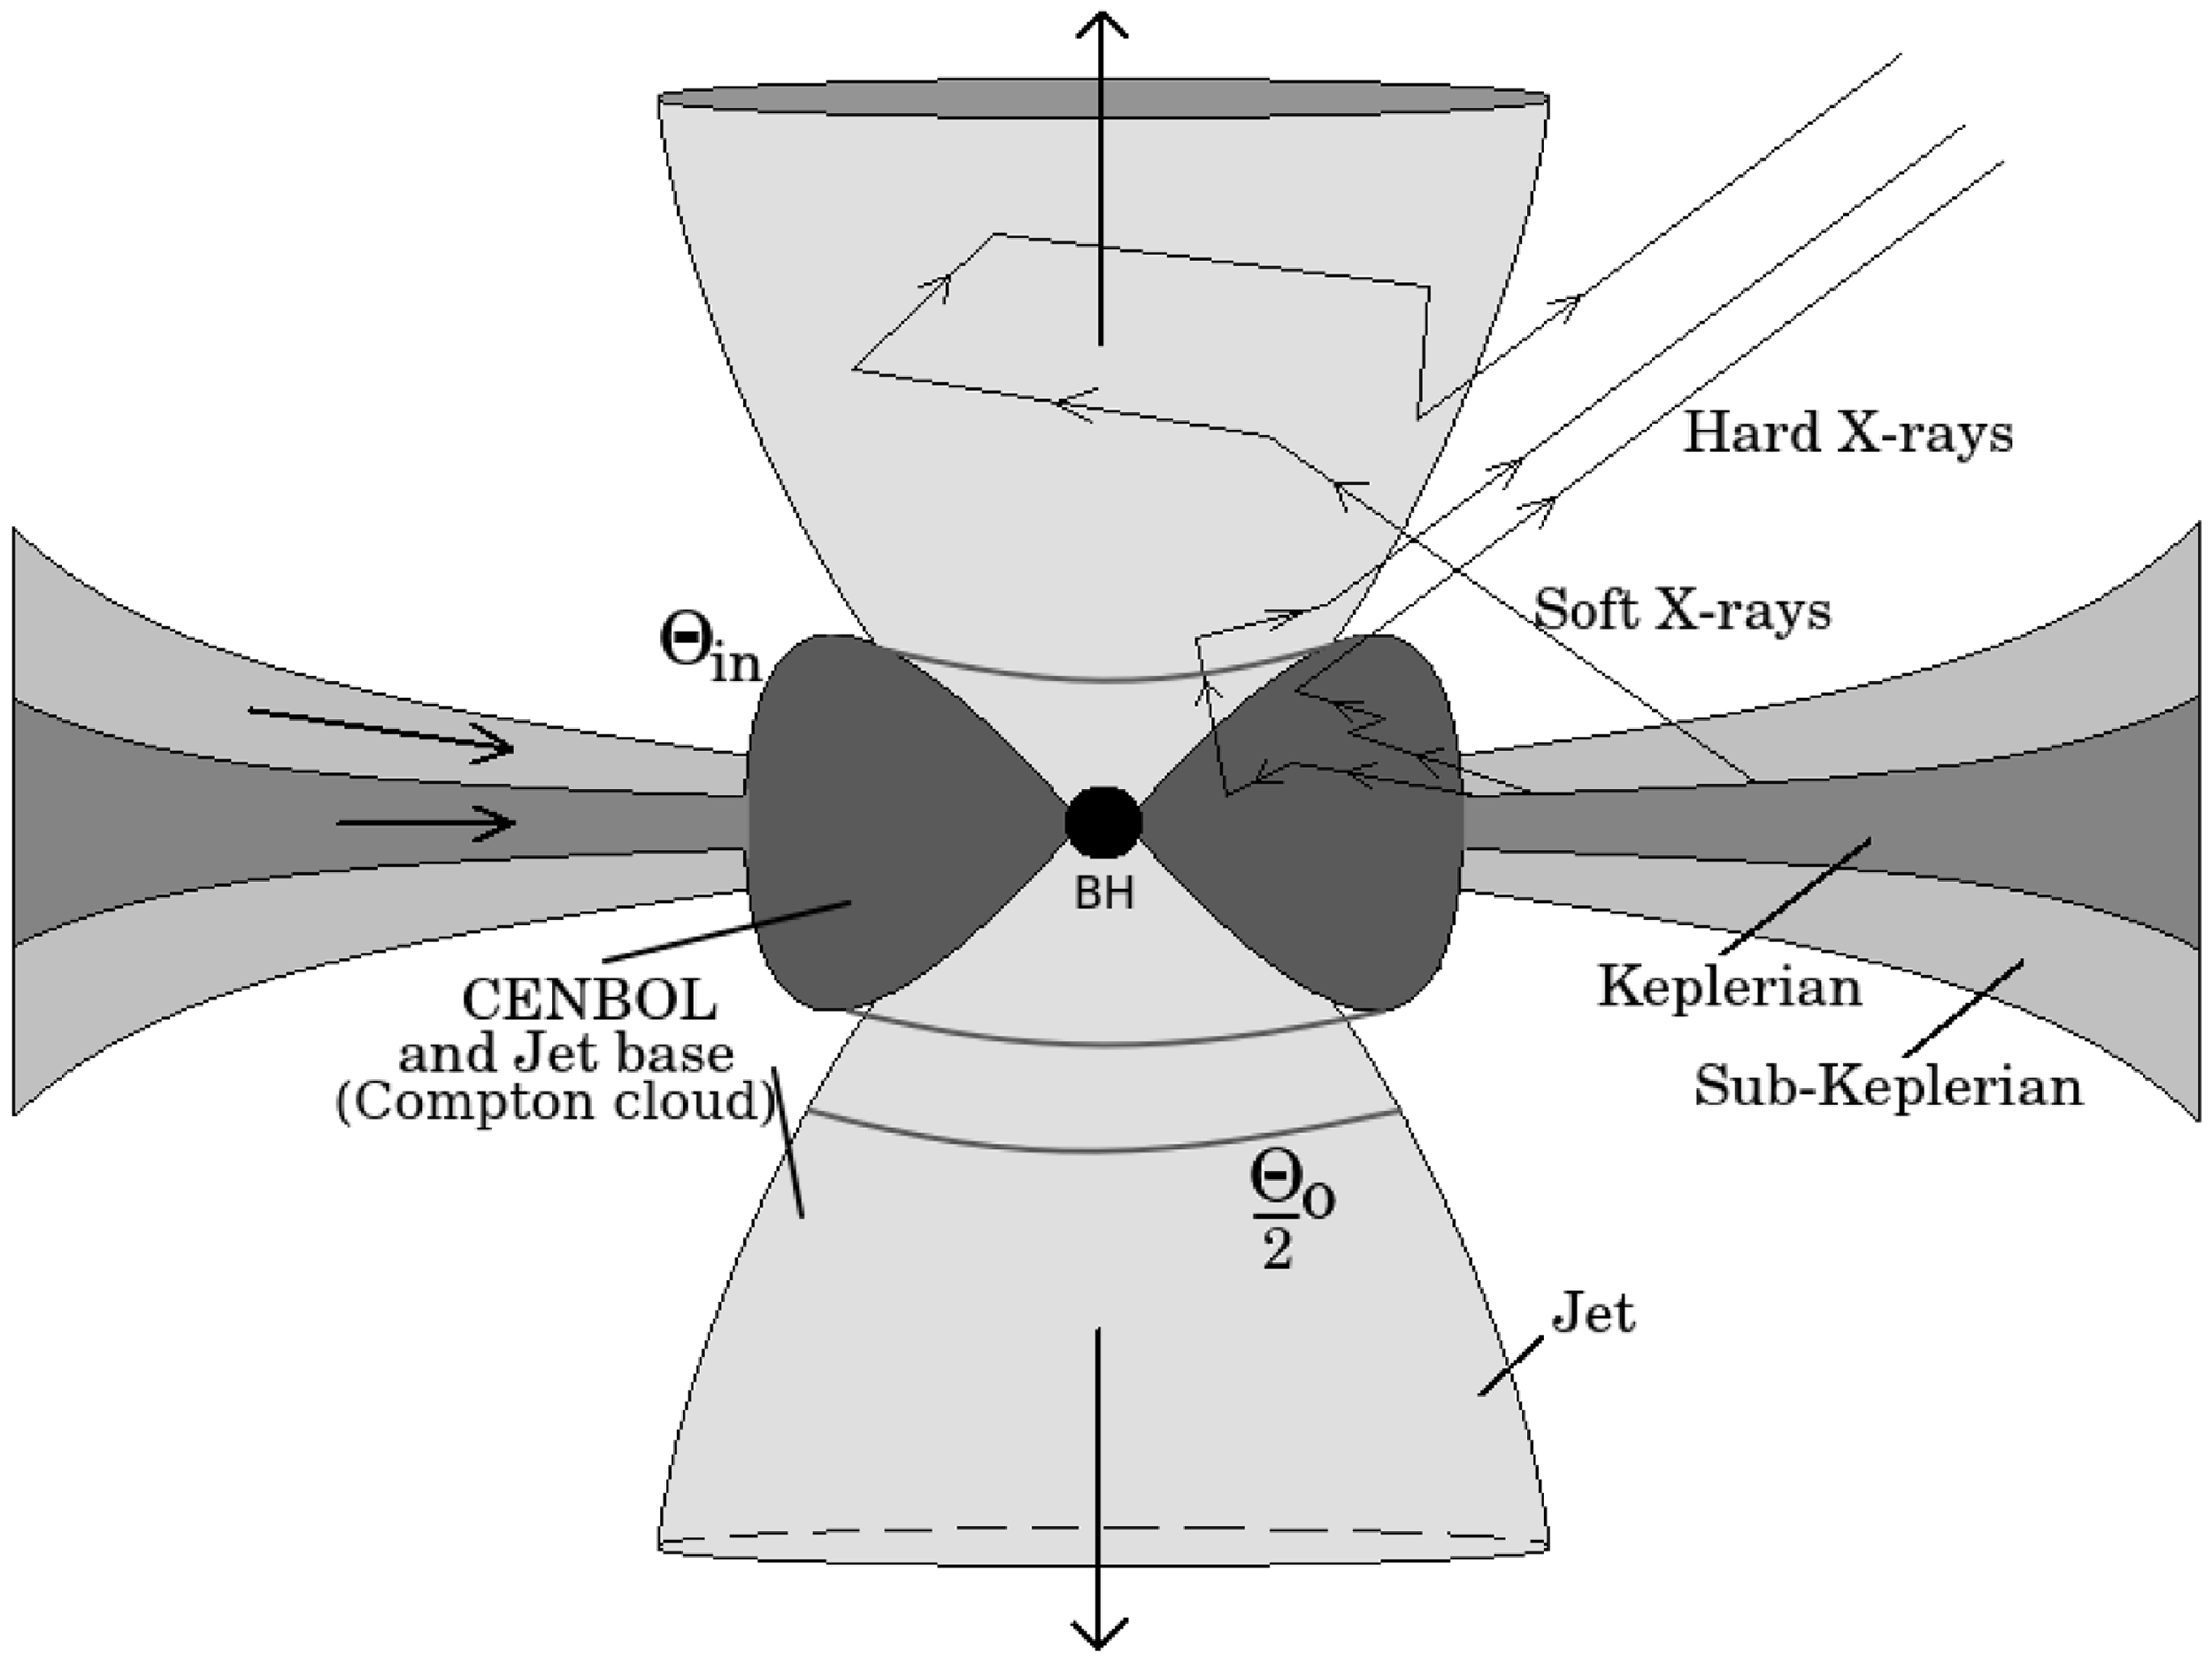
As the accreting matter moves closer to the BH its velocity increases and becomes supersonic, which may or may not form shocks (Chakrabarti Reference Chakrabarti1989) depending on the satisfaction of the Rankine-Hugoniot conditions. The location of the formation of the shock is known as the boundary layer of the corona. The same shocked region also drives jets/outflows and behaves as the base of the jet (Chakrabarti Reference Chakrabarti1999). Therefore, we further fit the data using an accretion-ejection-based jet in a two-component advective flow model (or JeTCAF, Mondal & Chakrabarti Reference Mondal and Chakrabarti2021) to understand the accretion-ejection and polarisation behaviour of the source. The JeTCAF model is the updated version of TCAF model (Chakrabarti&Titarchuk Reference Chakrabarti and Titarchuk1995) that takes into account the spectral signature of jet or mass outflows. The model with flow geometry is illustrated in Fig. 2. The JeTCAF model takes into account radiation mechanisms at the base of the jet and the bulk motion effect by the outflowing jet on the emitted spectra in addition to the Compton scattering of soft disc photons by the hot electron cloud inside the corona. The JeTCAF model has six parameters, namely (i) the mass of the BH (
 $M_{\mathrm{BH}}$
), (ii) the Keplerian disc accretion rate (
 $\dot m_{\mathrm{d}}$
), (iii) the sub-Keplerian halo accretion rate (
 $\dot m_{\mathrm{h}}$
), (iv) the size of the dynamic corona or the location of the shock (
 $X_{\mathrm{s}}$
in
 $r_g=2GM_{\mathrm{BH}}/c^2$
unit), (v) the shock compression ratio (R), and (vi) the outflow/jet collimation factor (
 $f_{\mathrm{col}}$
), that is, the ratio of the solid angle subtended by the outflow to the inflow (
 $\Theta_{o} / \Theta_{\mathrm{in}}$
).
Illustration of the JeTCAF model. The Keplerian disc is residing at the equatorial plane while the sub-Keplerian halo component is above and below the equatorial plane, respectively. The deep grey inner region is the hot Compton cloud and the conical funnels above and below this region show the mass outflow or jet. The zig-zag arrows indicate the scattering of soft disc photons by different Comptonizing mediums. The figure is adapted from Mondal & Chakrabarti (Reference Mondal and Chakrabarti2021).
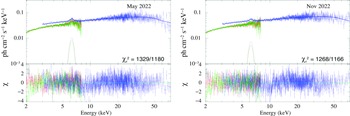
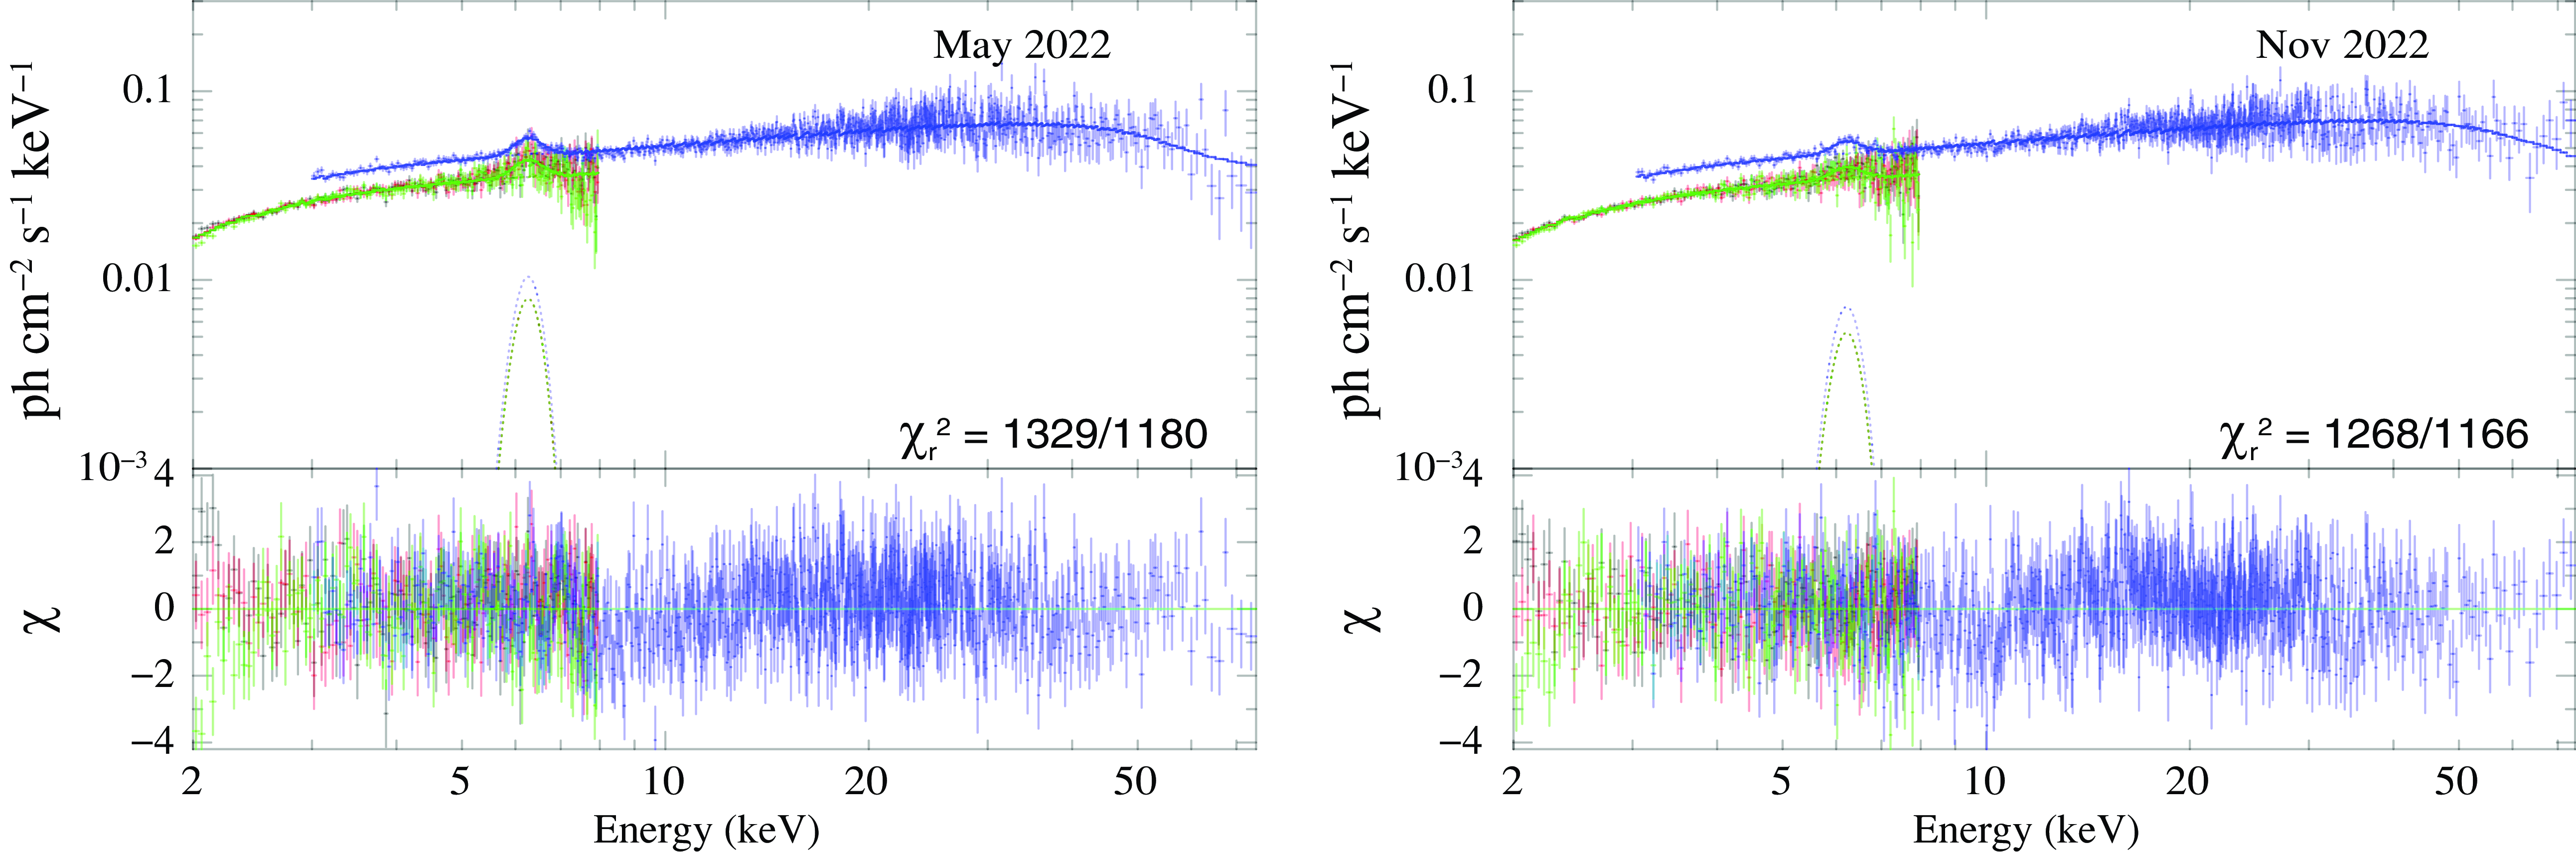
Joint spectral modelling of IXPE and NuSTAR data fitted using JeTCAF model in the energy band 2–79 keV. The left and right panels are for the epochs (I1+N1) and (I2+N2). The Fe K
 $\alpha$
line
 $\sim6.3$
is fitted using GAUSS model as shown by dashed lines. The black, red, and green points correspond to IXPE data for all three DUs and the blue points correspond to NuSTAR data. See the text for details.
In general, an increase in
 $\dot m_d$
makes the spectrum softer as the increased number of soft photons from the disc cools the corona and lowers the outflow rate (Mondal, Chakrabarti, & Debnath Reference Mondal, Chakrabarti and Debnath2014). While for increased
 $\dot m_h$
spectrum becomes harder as the corona is hotter and bigger, therefore, soft photons can gain more energy through scattering (Chakrabarti Reference Chakrabarti1997; Mondal & Chakrabarti Reference Mondal and Chakrabarti2013). That also elevates the mass outflow rate. The increase in
 $X_s$
also makes the spectrum harder as more hard photons from the hot corona contribute to it. In this model, the
 $f_{col}$
parameter is incorporated to take into account the effect of outflows in addition to TCAF parameters. A higher value of this parameter implies that the jet is less collimated due to a higher outflowing angle, which makes the spectrum harder. As the mass is a parameter, along with the accretion rates and corona parameters, the JeTCAF model has the potential to estimate the mass of the central SMBH as previously done for several BHs using TCAF, if there is no robust estimation beforehand (Iyer et al. Reference Iyer, Nandi and Mandal2015; Molla et al. Reference Molla, Chakrabarti, Debnath and Mondal2017; Nandi, Chakrabarti, & Mondal Reference Nandi, Chakrabarti and Mondal2019; Mondal et al. Reference Mondal, Adhikari, Hryniewicz, Stalin and Pandey2022). For the host galaxy absorption, we used the ZTBABS model. The full model reads in XSPEC
Footnote
d
for IXPE and NuSTAR as TBABS*ZTBABS* (JeTCAF+GAUSS).
In Fig. 3, we show the model-fitted spectra of MCG-5-23-16 for the joint IXPE and NuSTAR observations. The Fe K
 $\alpha$
line fitted well with a Gaussian line width of
 $\sim0.3$
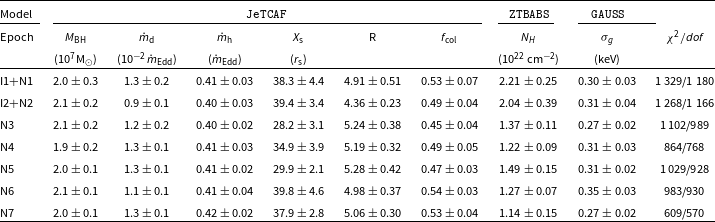
keV for all observations. The Compton hump part of the spectra fitted with JeTCAF model is taken into account by the scattering of corona photons by the diverging outflow. The disc mass accretion rate in JeTCAF model varied minimally, whereas the halo accretion rate was nearly constant
 $\sim0.4$
 $\dot m_{\mathrm{Edd}}$
and the size of the corona changed significantly from
 $\sim28$
to
 $40 r_s$
. The model fit to all the epochs gives nearly a constant mass within errors of the central SMBH
 $\sim2\times 10^7$
M
 $_\odot$
, consistent with previous estimations reported in the literature. However, if we freeze the mass to a known value of
 $2\times 10^7$
M
 $_\odot$
from the literature, it will provide consistent fits. That will also reduce the errors noticeably in
 $\dot m_d$
and
 $\dot m_h$
and marginally in other parameters. For the joint epochs data (I1+N1 and I2+N2) fits, the
 $N_H$
for the host galaxy absorption required in ZTBABS model is
 $2.0-2.2\times 10^{22}$
cm
 $^{-2}$
, while earlier NuSTAR epochs (N3-N7) required
 $N_H \sim 1.2-1.5 \times 10^{22}$
cm
 $^{-2}$
. The high value of the
 $f_{\mathrm{col}}$
parameter implies that the outflow is not well collimated and the rate is high. The estimated outflow solid angle is
 $\sim0.5\pi$
. The JeTCAF model fitted parameters are summarised in Table 4.
Joint IXPE and NuSTAR data fitted model parameters are provided in this table. Here,
 $M_{\mathrm{BH}}$
,
 $\dot m_d$
,
 $\dot m_h$
,
 $X_s$
, R, and
 $f_{\mathrm{col}}$
are the mass of the BH, disc and halo mass accretion rates, location of the shock or size of the corona, the shock compression ratio, and the outflow collimation factor respectively in JeTCAF model. N
 $_H$
is the hydrogen column density in ZTBABS model. All data sets required GAUSS model for the Fe K
 $\alpha$
line
 $\sim6.3$
keV of width
 $\sigma_g$
given in the table.
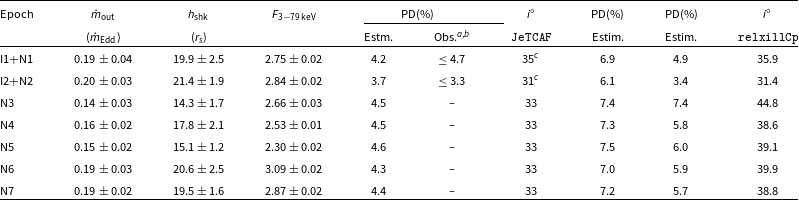
Estimated and observed polarisation and corona properties of MCG-5-23-16. The 3–79 keV band flux is in units of
 $10^{-10}$
erg cm
 $^{-2}$
s
 $^{-1}$
. Here,
 $^{a,b}$
denotes the references to Marinucci et al. (Reference Marinucci2022) and Tagliacozzo et al. (Reference Tagliacozzo2023). In the first two rows,
 $^c$
denotes the estimation of i from the observed upper limits of PD, while the expected PDs in column 5 are calculated using JeTCAF model geometry and for
 $i=33^\circ$
, which is an average of the estimates in the first two epochs (
 $35^\circ$
and
 $31^\circ$
respectively). The column 8 denotes the estimations of PD for a given angle of
 $45^\circ$
, which is considered from the literature. The last two columns stand for the same estimation of PD for a given i, which is obtained from relxillCp model and using the geometry from JeTCAF model.
From the JeTCAF model fitted parameters, we have estimated different physical quantities to understand the variation of polarisation with corona geometry and spectral flux. The height of the corona is basically the height of the shock, as the shock is the boundary layer of the corona. The height of the shock (
 $h_{\mathrm{shk}}$
) is estimated using (Debnath, Chakrabarti, & Mondal Reference Debnath, Chakrabarti and Mondal2014),
 $h_{\mathrm{shk}}=[\gamma (R-1) X_s^2/R^2]^{1/2},$
where,
 $\gamma$
is the adiabatic index of the flow, which is considered here as 5/3. The estimated
 $h_{\mathrm{shk}}$
varies in a range between
 $\sim14 - 21$
 $r_s$
.
The mass outflow rate (
 $\dot m_{\mathrm{out}}$
) is derived for an isothermal base of the jet (Chakrabarti Reference Chakrabarti1999), which is given by,
 \begin{equation}\dot m_{\mathrm{out}}=\dot m_{\mathrm{in}} f_{\mathrm{col}}f_0^{3/2}\frac{R}{4} \exp\left[\frac{3}{2} -f_0\right],\end{equation}
where,
 $f_{\mathrm{0}}=\frac{R^2}{R-1}$
and
 $\dot m_{\mathrm{in}} (=R\dot m_h+\dot m_d)$
is the total mass inflow rate. As the matter gets compressed at the shocked region by a factor of R, it changes the optical depth of the corona (see Chakrabarti & Titarchuk Reference Chakrabarti and Titarchuk1995; Modal et al. 2014). The estimated
 $\dot m_{\mathrm{out}}$
varies between
 $0.14\pm0.03-0.20\pm0.03$
 $\dot M_{\mathrm{Edd}}$
for this source, which is significant as was reported earlier in the literature (see, Braito et al. Reference Braito2007). According to this model, as mentioned earlier, both corona and base of the jet behave as a Comptonizing medium. The radiation scattered by the corona or wind may exhibit significant polarisation. The unpolarised radiation from the central source scattered by the corona of radius
 $X_s$
at height
 $h_{\mathrm{shk}}$
above the midplane of the disc will acquire a net fractional polarisation (Begelman & McKee Reference Begelman and McKee1983),
 \begin{equation} \Pi_{\mathrm{sc}}=\frac{\sin^2i[1-2(h_{\mathrm{shk}}/X_{s})^2]}{2[1+2(h_{\mathrm{shk}}/X_{s})^2]+[1-2(h_{\mathrm{ shk}}/X_{s})^2]\sin^2i},\end{equation}
where i is the disc inclination angle. As the above estimation uses only Thomson scattering as an approximation of Compton similar to JeTCAF model, thereby, the scattering conserves photon energy. Moreover, the Thomson scattering has no frequency dependence so it would preserve the incident spectrum for any energy bands including IXPE coverage. Therefore, for a given or well-estimated corona properties and disc inclination, one can estimate PD or vice-versa using Equation (2). Thereby, to shed light on the estimation of i from the polarisation measurement, we have calculated it from the observed upper limit of the PD in Marinucci et al. (Reference Marinucci2022), Tagliacozzo et al. (Reference Tagliacozzo2023) and the broadband spectroscopic data fitted JeTCAF model parameters. Our estimated i ranges between 31
 $^\circ$
–35
 $^\circ$
during epochs I2 and I1 for given observed PDs. The rest of the NuSTAR epochs do not have polarisation data, thereby the measurement of observed PD values. However, we can predict the expected PDs by taking an average value of i (which is
 $33^\circ$
) from I1 and I2 epochs and using it in Equation (2). Our estimation is a bit lower compared to the estimations reported in the literature, however, falls in the range estimated using reflection models (see the next section). Therefore, we have further estimated the PD values for
 $i=45^\circ$
as a comparison with the literature. All estimated PD values are given in Table 5. The spectral flux given in the table is calculated using flux err command in XSPEC for the energy band 2–79 keV.
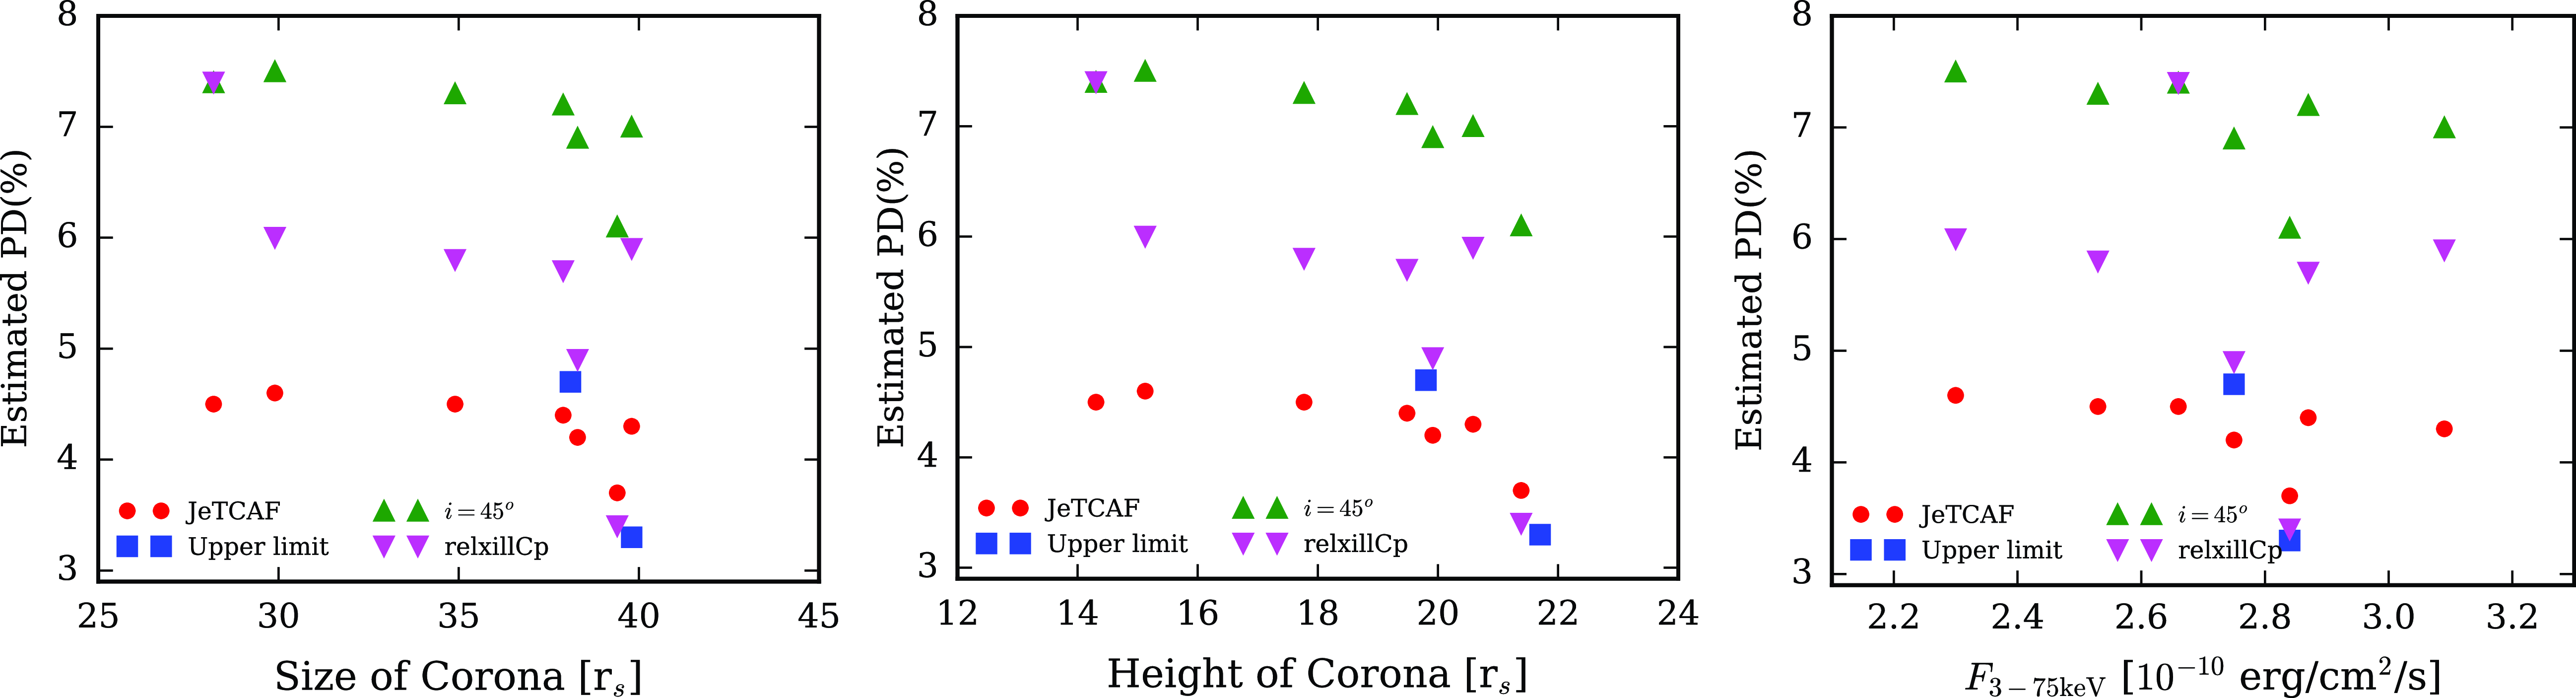
The left panel of Fig. 4 shows the variation of PD with the radial distance of the corona. The red circles are the PD values estimated using the model fitted
 $h_{\mathrm{shk}}$
and
 $X_s$
parameters for a given
 $i=33^\circ$
, which is the average of disc inclination angles estimated from the upper limit of the observed PD values reported in Tagliacozzo et al. (Reference Tagliacozzo2023). For a corona of
 $\lt 35$
r
 $_s$
, the PD was nearly constant and it decreased when the corona size increased. A similar profile has been observed (middle panel of Fig. 4) for the height of the corona, which is quite expected as a bigger corona indicates a hotter electron cloud and more puffed up in the vertical direction. Our estimated PD variation with corona geometry is in accord with the simulation results performed by Schnittman & Krolik (Reference Schnittman and Krolik2010) for a spherical geometry of the corona. The right panel of Fig. 4 shows the PD variation with estimated spectral flux, which shows a negative correlation as well. The variations of PD values estimated for
 $i=45^\circ$
with the corona properties and model flux are shown by green triangles in all three panels of Fig. 4. For the estimation, we used the corona geometry obtained from JeTCAF model fits. The estimated PD values are higher by nearly a factor of two than the observed and JeTCAF model estimations. A more spherical corona might be required for the same disc inclination to get a lower value of PD which can match with observations.
Dependence of PD with the geometry of the Comptonizing corona in JeTCAF model. The left and middle panels show the PD variation with the radial distance and height of the corona, while the right panel shows the PD variation with the observed flux in the 3–79 keV band. The red circles show the predicted PD, estimated using spectral model fitted accretion parameters, and the blue squares show the observed upper limit in PD measurement. The magenta upside down triangles and green triangles show the PD estimations from relxillCp model fitted disc inclination and for a given inclination of
 $45^\circ$
.
3.2.2 Reflection based pexrav and relxillCp models
Further, we have used reflection-based pexrav and relxillCp models to fit the joint and individual spectra to constrain different reflection parameters. The models reads in XSPEC as TBABS*ZTBABS*(GAUSS+pexrav) and TBABS* ZTBABS*relxillCp, and a CONST component for the first two epochs. For both model fittings, we set the abundances to their Solar value. First, we fit the data using pexrav model, where the reflection parameter (
 $R_{\mathrm{ref}}$
) varied between
 $0.46\pm0.14-0.69\pm0.22$
, the powerlaw photon index
 $1.78\pm-1.94\pm0.03$
. The FeK
 $\alpha$
line fitted
 $\sim6.3$
keV with width
 $\sigma_g$
as tabulated in Table 6. From this model fit, we could constrain the cutoff energy ranges between 130–184 keV. These values were used during fitting using relxillCp model. To constrain the disc inclination angle (i), we put a range of
 $0.6 \lt i \lt 0.9$
. For some epochs (N3-N5), the i value is pegged at the lower limit, therefore, we could not constrain its value. However, the other epochs returned the inclination angle value between 35
 $^\circ$
–54
 $^\circ$
. The
 $N_H$
values for the first two epochs are between 2.25 and
 $2.50\times10^{22}$
cm
 $^{-2}$
, while for the epochs N3-N7 it is between 1.60–1.86
 $\times10^{22}$
cm
 $^{-2}$
, showing a similar trend as obtained in JeTCAF model.
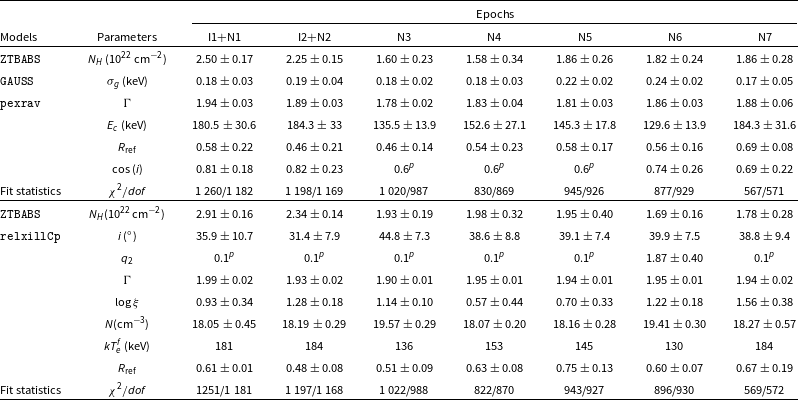
Joint IXPE and NuSTAR data fitted reflection model parameters are provided in this table. All data sets required GAUSS model for the Fe K
 $\alpha$
line
 $\sim6.3$
keV of width
 $\sigma_g$
given in the table during pexrav model fitting. During both relxillCp and pexrav model fitting both abundances are set to Solar value. Here,
 $^p$
and
 $^f$
denote the pegged and frozen values of the parameters.
The relativistic reflection model (relxill) has several variants, including relxillCp, which we have used for our purposes. This model takes into account the relativistic disc reflection component and NTHCOMP (Zdziarski, Johnson, &Magdziarz Reference Zdziarski, Johnson and Magdziarz1996; Życki, Done, & Smith Reference Życki, Done and Smith1999) thermal Comptonization continuum component. The relxillCp model has fourteen parameters out of which two are abundances which we set to their Solar values. If we keep all parameters free, that will give more degenerate values of the parameters and most of the parameters can not be well-constrained. Therefore, before fitting the data we make an educated choice of some of the parameters as was done by several authors in the literature (Barua et al. Reference Barua, Adegoke, Misra, Pawar, Jithesh and Medhi2023; Serafinelli et al. Reference Serafinelli2023, and references therein). From the rest of the parameters, we choose non-rotating BH at present, as there is no reporting of the spin parameter for this system. We tried to fit the data by keeping the spin parameter free, and it was always taking the upper hard limit of 0.998. Such a high spin can not be explained from the present data sets as the source evidenced a stable accretion disc being truncated at a larger radius (see Serafinelli et al. Reference Serafinelli2023, for more details). This task prompted us to set a and
 $R_{\mathrm{in}}$
parameters to 0 and 6
 $r_g$
in this work. The outer edge of the disc,
 $R_{\mathrm{out}}$
is set to 1 000
 $r_g$
. The parameter
 $R_{br}$
determines a break radius that separates two regimes with different emissivity profiles and is set to 38
 $r_g$
, following the previously reported results in the literature and JeTCAF model fitted results. We fixed the first emissivity index (index1) to 3.0 and put a range for the index2 (
 $q_2$
) between 0.1–4. We set
 $kT_e$
fixed to values obtained from pexrav model fit. The remaining six parameters i,
 $\Gamma$
, ionisation index (
 $\log\xi$
), density (N), and
 $R_{\mathrm{ref}}$
are set free to vary.
Fig. 5 shows the relxillCp model fitted the joint spectra for the epochs May (left panel) and November (right panel). The model fits the data well and the residual is shown in the bottom panels. Using the relxillCp model, we could well-constrain the disc inclination i between
 $31.4\pm7.9-44.8\pm7.3$
and the
 $\Gamma$
was nearly constant across all epochs with value between 1.90
 $\pm$
0.01–1.99
 $\pm$
0.02. The estimated value of i from JeTCAF model as given in Table 5 falls within the range of values obtained from relxillCp model. This range of inclination angle is also in accord with the estimation in the literature (Marinucci et al. Reference Marinucci2022; Serafinelli et al. Reference Serafinelli2023). The emissivity index (
 $q_2$
) is pegged at 0.1 for all epochs except the epoch N6, for which we obtained a value
 $1.87\pm0.40$
. Our model fits yield ionisation parameter
 $\log\xi \leq 1.6$
, which infers that the distant reflecting material is not highly ionised. The obtained density of the matter (N) at
 $R_{in}$
is high, varies between
 $10^{18-19.6}$
cm
 $^{-3}$
, and the reflection fraction
 $R_{ref}$
between
 $0.5-0.8$
, which is relatively low. Both reflection model fitted
 $R_{ref}$
are in close agreement with each other. All reflection model parameters are given in Table 6. We have further estimated the PD values using relxillCp model fitted i values. The results are summarised in Table 5. The variations of PD estimated using relxillCp model fitted i values are shown by upside-down magenta triangles in all three panels of Fig. 4. It is noticeable that these PD values fall in between the observed and for
 $i=45^\circ$
estimations.
Same as Fig. 3 but using relxillCp model. See the text for details.
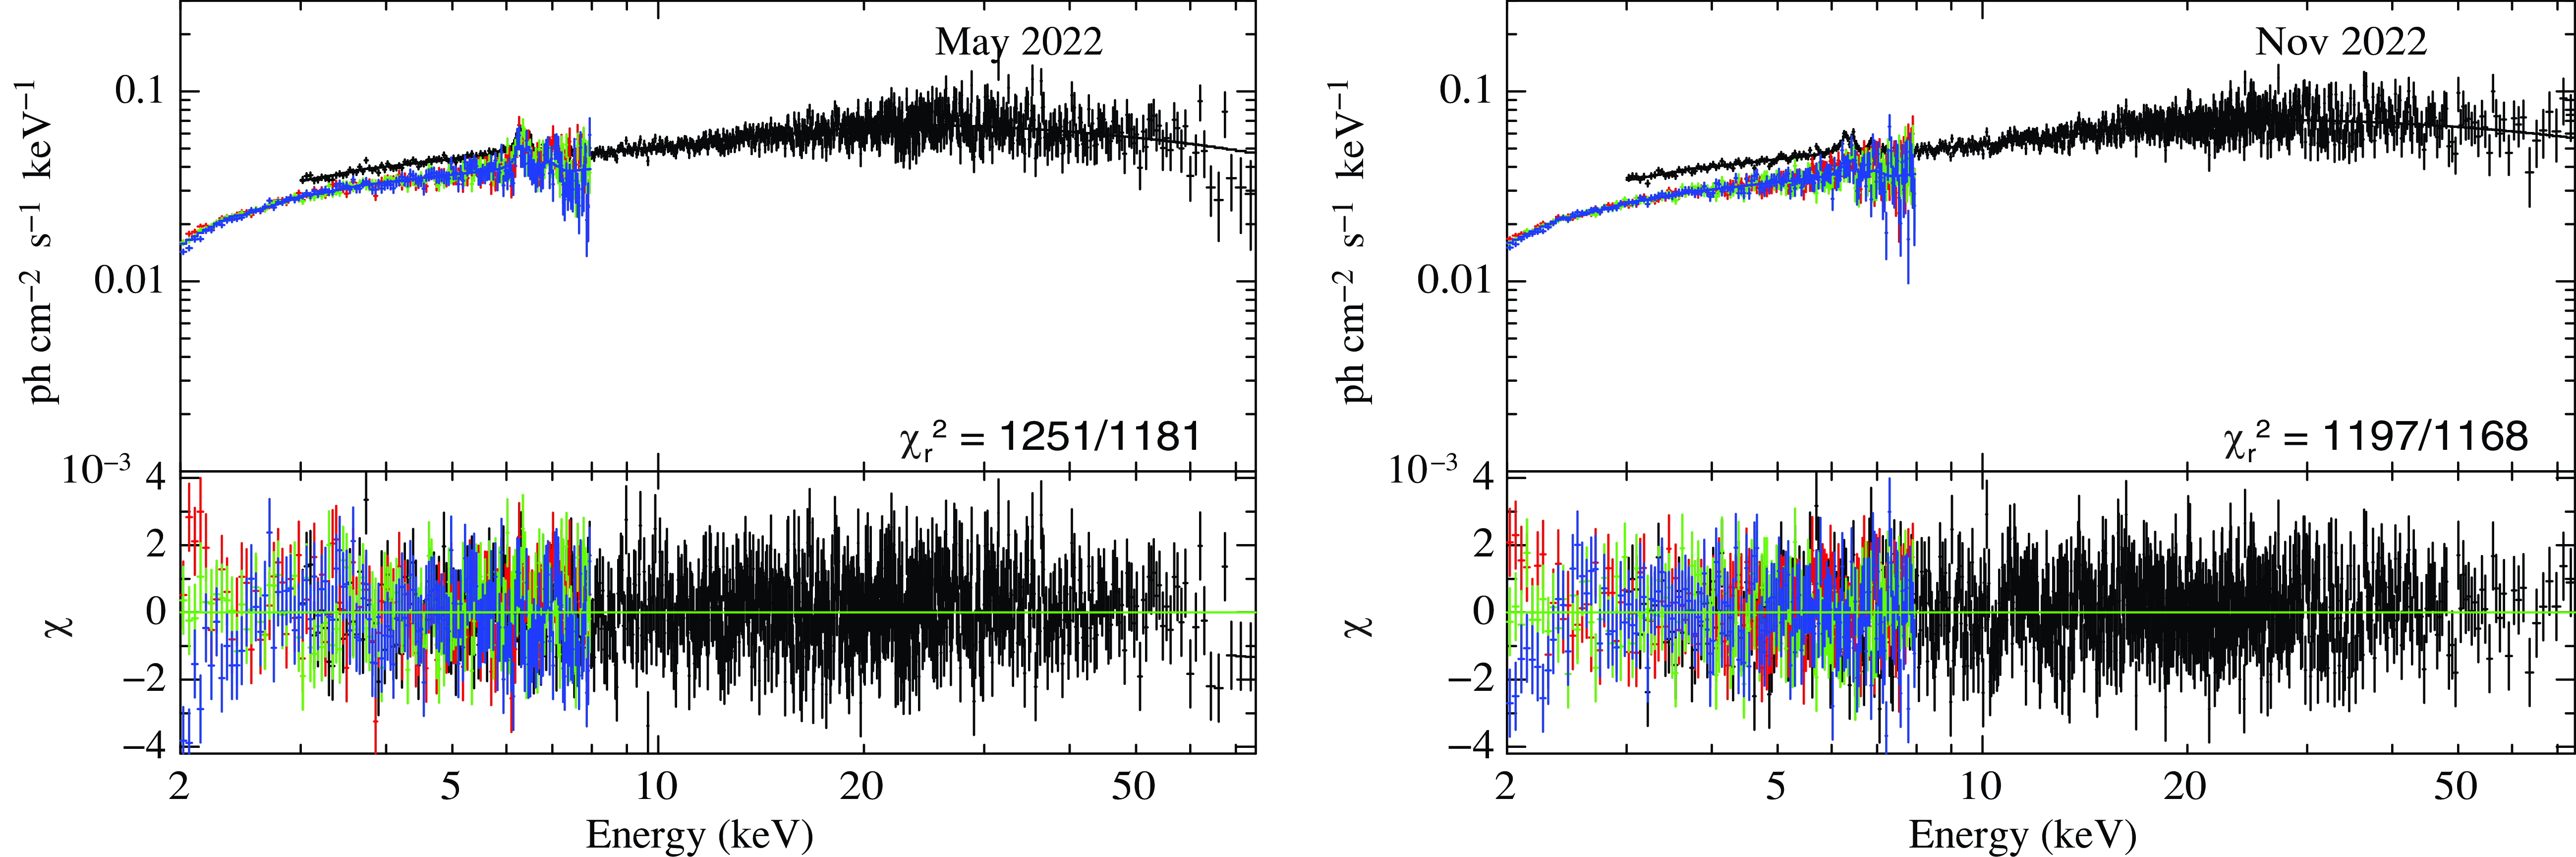
to appear in While using two reflection-based models to the same set of data, both models fit the data equally well provided some marginal changes in
 $\chi^2$
values. However, from the pexrav model we could not constrain the i parameter, provided a broad range. The relxillCp could constrain the i values which are in agreement with the literature, and we could use them to compare the observed PD measurement. Since the pexrav model could constrain the
 $E_{cut}$
, we could use them in relxillCp model. Other common parameters (
 $\Gamma$
and
 $R_{ref}$
) obtained from the fit in both models are quite similar. We note that, the relxillCp model takes into account the ionised reflection, ionisation, and relativistic effects, could constrain the required parameter and, therefore more favourable for the present study, compared to the pexrav model.
4. Discussions and conclusions
In this work, we have performed the spectro-polarimetric analysis of the Seyfert galaxy MCG-5-23-16 to understand the polarisation properties and the X-ray emitting corona using two epochs of data from IXPE and a decade of observations from NuSTAR. Our model-independent analysis poses the PD with an upper limit of
 $\leq3.8\%$
, while the model-dependent estimates give PD
 $1.08\pm0.66\%$
and PA
 $55.6^\circ\pm19.1^\circ$
using simultaneous data fitting of I1 and I2, which are in accord with the previous studies within error bar (Marinucci et al. Reference Marinucci2022; Tagliacozzo et al. Reference Tagliacozzo2023).
The joint IXPE and NuSTAR broadband spectroscopic data fitted using JeTCAF model gives the estimate of disc mass accretion rate to the central SMBH which is
 $\leq0.013$
 $\dot m_{\mathrm{Edd}}$
, while the halo accretion rate is
 $\leq0.4$
 $\dot m_{\mathrm{Edd}}$
. The location of the shock changed from 28 to 40
 $r_s$
and the shock compression ratio varied between 4.4–5.3. Relatively high values of jet/outflow collimation factor indicate that the outflow is not well-collimated. The previous studies reported that the source showed significant mass outflow, here we estimated the mass outflow rate
 $\sim$
0.14–0.20
 $\dot m_{\mathrm{Edd}}$
from the spectral model fitted parameters. Since mass outflow carries thermal energy from the hot corona, its geometry changes (Chakrabarti Reference Chakrabarti1999; Mondal et al. Reference Mondal, Chakrabarti and Debnath2014). Therefore, the final best-fit corona geometry which is used to estimate the expected PD has the effect of mass outflows. Hence, studying polarisation using the disc-corona-outflows model is crucial to get a consistent picture of a system, which has been done in this work. Since the model directly fits the data using corona geometry and estimates expected i using observed quantities, such estimations might be more favourable.
We have further fitted the data using pexrav and relxillCp models to constrain the reflection properties and disc inclination (i). We found that the reflection fraction,
 $R_{\mathrm{ref}} \lt 0.8$
which agrees with previous studies, and the photon index
 $\Gamma$
was also consistent in both models. In pexrav model, we could constrain i for some epochs, and for some epochs fits were trending towards very high inclination. However, using relxillCp we could constrain i for all epochs which put a range
 $\sim31^{\circ}$
–
 $45^{\circ}$
, which is in agreement with the previous studies. Therefore, the relxillCp is a more favourable reflection model for the present data sets compared to pexrav. Given these values of i from relxillCp model, we have estimated the expected PD to be 3.4–6.0%, which is comparatively similar to higher than the observed PD.
The scattering of photons inside the Comptonizing corona or outflow can induce significant polarisation as discussed earlier. Therefore, we used it to further estimate the disc inclination for a given corona geometry from JeTCAF model, mainly its radial distance and height. Using the upper limit of polarisation measurement, we have estimated the disc inclination
 $\sim35^\circ$
using observations in May 2022 (I1+N1) and
 $\sim31^\circ$
in November 2022 (I2+N2). After taking an average of these two estimates, we further use it to determine the expected polarisation during the epochs N3-N7. The estimated PD decreases with increasing the corona geometry at different epochs (see Fig. 4). We note that the expected i estimated using the JeTCAF geometry for the simultaneous data sets nicely matches with the relxillCp model fitted i. We have further estimated the expected PDs using i from relxillCp model and also considering i to be
 $45^\circ$
are shown in all three panels of Fig. 4 for a comparative study. These values are above the presently observed upper limit which may suggest that the disc inclination predicted from JeTCAF and obtained from relxillCp model is more reliable. However, if such a high PD is expected, that can be possibly measured in the future with broadband polarimetry using joint IXPE and XPoSat, which may provide higher inclination, require a further study. Our study not only relates the polarisation with the accretion flow properties but also can predict expected polarisation. The current model prescription can be applied to other Seyfert galaxies to study their X-ray polarisation in connection with the accretion-ejection properties, where polarisation could be due to reflection (NGC 4151; Gianolli et al. Reference Gianolli2023) or outflowing jet (IC 4329A; Ingram et al. Reference Ingram2023; Pal et al. Reference Pal, Stalin, Chatterjee and Agrawal2023), which will be addressed in elsewhere. Additionally, the current modelling can be applied to XPoSat observations of this source and other potential candidates in the future.
Acknowledgement
We thank the referee for making constructive comments and suggestions that improved the quality of the paper. SM thanks Keith A. Arnaud for helping during the data analysis. RC, VKA, and AN thank GH, SAG, DD, PDMSA, and the Director, URSC for continuous support to carry out the research activity. This research used data products provided by the IXPE Team (MSFC, SSDC, INAF, and INFN) and distributed with additional software tools by the High-Energy Astrophysics Science Archive Research Center (HEASARC), at NASA Goddard Space Flight Center (GSFC). This research has made use of the NuSTAR Data Analysis Software (NuSTARDAS) jointly developed by the ASI Science Data Center (ASDC, Italy) and the California Institute of Technology (Caltech, USA).
Funding statement
SM acknowledges Ramanujan Fellowship (# RJF/2020/000113) by SERB-DST, Govt. of India for this research.
Competing interests
None.
Data availability statement
Data used in this work are publicly available in NASA’s HEASARC archive. The JeTCAF model (Mondal & Chakrabarti Reference Mondal and Chakrabarti2021) is incorporated in XSPEC directly using initpackage command, which is not public yet. However, the preliminary version of the FITS file is in a testing phase and can be available soon upon request or on GitHub.Footnote e