INTRODUCTION
The endemic Posidonia oceanica (L.) Delile, the dominant seagrass in the Mediterranean Sea, is a long-living organism displaying considerable autumnal leaf fall (Pergent et al., Reference Pergent, Rico-Raimondino and Pergent-Martini1997). The macrophytodetritus is scattered by currents and waves, and accumulates in situ or is exported to adjacent habitats where it degrades and often becomes predominant (Mateo et al., Reference Mateo, Sanchez-Lizaso and Romero2003; Cardona et al., Reference Cardona, Revelles, Sales, Aguilar and Borrell2007). Accumulation of macrophytodetritus on sand patches adjacent to the seagrass meadow can be substantial, i.e. several hundred cubic metres, especially in relative enclosed systems (Cebrian & Duarte, Reference Cebrian and Duarte2001). These patches are ephemeral environments which remain for a few days to several months depending on the degradation rate and hydrodynamics of the area (Mateo & Romero, Reference Mateo and Romero1997). The accumulated materials are heterogeneous, mainly composed of phytodetritus (variable in size and degradation status), but also of living seagrass shoots and macroalgae. Macrophytodetritus nutritional quality is low due to its high lignocellulose content and its nutritional depletion by N-resorption and recycling before abscission (Lepoint et al., Reference Lepoint, Defawe, Gobert, Dauby and Bouquegneau2002). Nevertheless, macrophytodetritus is typically colonized by epiphytic organisms, i.e. all organisms associated with phytal habitats (leaves) such as e.g. heterotrophic microbial communities (bacteria and fungi), autotrophes (e.g. epiphytic diatoms), protists, meiofauna and macrofauna (Danovaro, Reference Danovaro1996; Gallmetzer et al., Reference Gallmetzer, Pflugfelder, Zekely and Ott2005). The latter two refer to metazoans passing through a 1 mm sieve retained on a 38 µm screen and retained on a 1 mm sieve, respectively. A possible reason for the high colonization is that macrophytodetritus create the conditions for the development of a high structural diversity of associated communities. This condition is generated on one hand by physical fragmentation, due to hydrodynamism or biological fragmentation through foraging behaviour. On the other hand by the higher nutritional quality of the epiphytic organisms compared to macrophytodetritus and also the accessibility of those epiphytic organisms that serve as food sources (hereafter referred to as epiphytes) for associated consumers. These consumers are likely to be crucial for the degradation and transport of organic matter to higher trophic levels. For example, macrofauna (juvenile fish prey) is known to ingest detritus with their associated epiphytes and microbial communities (Romero et al., Reference Romero, Pergent, Pergentmartini, Mateo and Regnier1992; Vizzini et al., Reference Vizzini, Sara, Michener and Mazzola2002; Mateo et al., Reference Mateo, Sanchez-Lizaso and Romero2003; Lepoint et al., Reference Lepoint, Cox, Dauby, Poulicek and Gobert2006; Sturaro et al., Reference Sturaro, Caut, Gobert, Bouquegneau and Lepoint2010). As such, seagrass ecosystems hold a significant fraction of autotrophic biomass (Duarte et al., Reference Duarte, Middelburg and Caraco2005) that is passed indirectly to higher trophic levels. It can thus be assumed that these ecosystems are macrophytodetritus based (Romero et al., Reference Romero, Pergent, Pergentmartini, Mateo and Regnier1992; Mateo & Romero, Reference Mateo and Romero1997; Pergent et al., Reference Pergent, Rico-Raimondino and Pergent-Martini1997).
Little is known on the exact role of meiofauna in the macrophytodetrital accumulations. Posidonia oceanica beds are hotspots for meiofaunal production ranging between 7.5 and 13.2 g C m−2yr−1 (Danovaro et al., Reference Danovaro, Gambi and Mirto2002). These values are comparable to the ones reported for seagrass systems in general, but are higher than the meiofaunal production in the Atlantic, the North Sea or the Baltic Sea. Meiofauna organisms occur in high densities, have a high turnover rate and most probably spend their entire lifecycle on or around the same substrate (Giere, Reference Giere2009). They are known to feed on a wide variety of food sources, including epiphytic biofilm (Hicks & Coull, Reference Hicks and Coull1983; Caramujo et al., Reference Caramujo, Boschker and Admiraal2008; De Troch et al., Reference De Troch, Chepurnov, Vincx and Olafsson2008, Reference De Troch, Cnudde, Vyverman and Vanreusel2009). Meiofaunal studies mainly focus on patterns of occurrence in sediment habitats (Danovaro et al., Reference Danovaro, Gambi, Manini and Fabiano2000; Mirto et al., Reference Mirto, Bianchelli, Gambi, Krzelj, Pusceddu, Scopa, Holmer and Danovaro2010) or in the epiphytal canopy environment (Hall & Bell, Reference Hall and Bell1993). Studies combining both habitats are very limited (Bell et al., Reference Bell, Kern, Walters and Thompson1984; De Troch et al., Reference De Troch, Gurdebeke, Fiers and Vincx2001) and hardly focus on the third non-negligible habitat in this system, namely the macrophytodetritus accumulation on sand patches (Dimech et al., Reference Dimech, Borg and Schembri2006). The present study aimed to characterize the meiofaunal community and diversity in different habitat types, namely seagrass canopy, adjacent sand and macrophytodetritus accumulations. In addition to the structural diversity of meiofauna, a more functional approach concentrating on harpacticoid copepods is included. Hence, natural stable isotope signatures (δ 13C) are used to trace food sources in consumers (Fry et al., Reference Fry, Macko and Zieman1987; Lepoint et al., Reference Lepoint, Nyssen, Gobert, Dauby and Bouquegneau2000; Vizzini et al., Reference Vizzini, Sara, Michener and Mazzola2002). Potential food sources and harpacticoid copepods from the different habitats were analysed to infer their diet and to study what are the main food sources for harpacticoid copepods at the basis of the food web in the seagrass ecosystem. As the trophic position of copepods in the sediments has been already documented (Carlier et al., Reference Carlier, Riera, Amouroux, Bodiou, Escoubeyrou, Desmalades, Caparros and Gremare2007; Wyckmans et al., Reference Wyckmans, Chepurnov, Vanreusel and De Troch2007), the present research will clarify which part of the seagrass ecosystem is consumed by harpacticoid copepods, i.e. the macrophytodetrital matter, the epiphytic biofilm or the living leaves.
MATERIALS AND METHODS
Sampling site and strategy
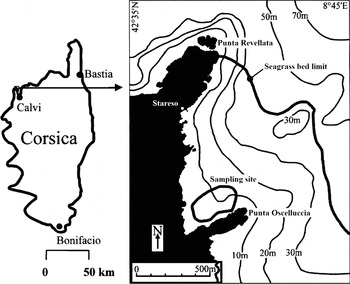
Samples were collected in the Revellata Bay (Gulf of Calvi, Corsica, north-west Mediterranean) at the Punta Oscelluccia site (42°35′N 8°43′E) (Figure 1). The sampling site was located close to a sandy patch and in a Posidonia oceanica meadow facing the Oscelluccia peninsula (Punta Oscelluccia). At the study site, P. oceanica seagrass meadows cover about 50% of the total bay surface down to a depth of 38 m (Bay, Reference Bay1984) and are ranked among the most productive P. oceanica beds in the north-west Mediterranean (Pergent-Martini et al., Reference Pergent-Martini, Rico-Raimondino and Pergent1994). Samples were taken in August 2009, which correlates with the start of the autumnal leaf fall cycle. Sampling was carried out at a depth of 10 m by SCUBA divers during day time. The salinity, around 38, and the water temperature, around 26°C, remained stable during the entire sampling campaign.
Location of the Revellata Bay within the sampling site and the Posidonia oceanica meadow isobaths with lower depth distribution limit. Adapted from Gobert et al. (Reference Gobert, Kyramarios, Lepoint, Pergent-Martini and Bouquegneau2003)

Five potential habitats for meiofauna were collected in triplicate. The meadow leaves stratum, living leaves of the P. oceanica canopy (abbreviation: LL) represented a first potential habitat. Two different types of P. oceanica macrophytodetritus accumulated on adjacent sand patches were included as other habitat options: large macrophytodetritus fragments (abbreviation: LMF) comprising leaf lengths from 0 to 30 cm of P. oceanica and small macrophytodetritus fragments (abbreviation: SMF) comprising leaf length restricted from 0 to 3 cm of P. oceanica. Finally, two sand habitats of adjacent sand patches were sampled: bare sand (abbreviation: BS) and sand covered by macrophytodetrital material of P. oceanica (abbreviation: CS).
Living P. oceanica shoots representing the living leaves stratum (LL) were cut off at the sediment–water interface and put in 2 l plastic jars. The large macrophytodetritus fragments (LMF) and small macrophytodetritus fragments (SMF) were sampled using a 25 cm diameter tube randomly placed on the macrophytodetritus patch. All macrophytodetritus present inside the tube were scooped off from the seafloor by hand and collected in 2 l plastic jars. For the sand samples (BS and CS), 20 cm2 surface area and 5 cm deep cores of bare sand were collected. In order to clear the covered sand sample present underneath the macrophytodetrital material, the latter was very carefully moved aside to avoid fine sediment being brought in suspension and to get access to the bare sand. All jars were closed under water to ensure no loss of material or contamination of the samples. Standardization over all samples was not possible due to the different sampling techniques. Therefore two standardizations were made: one to compare all cored samples (BS, CS, SMF and LMF) per unit of surface (10 cm−2) and one to compare all seagrass material (SMF, LMF, LL) per unit of dry weight (g−1DW).
Community characterization
In order to extract the attached meiofauna, a 8% MgCl2-solution was added to stun the organisms (Hulings & Gray, Reference Hulings and Gray1971). Samples were afterwards rinsed twice over a 1 mm mesh sieve to exclude macrofauna and on a 38 µm mesh sieve to retain the meiofauna, prior to preservation with a 4% formaldehyde seawater solution. In the laboratory, the 38 µm–1 mm fraction of each replicate was centrifuged three times with Ludox HS40 (specific density of 1.18 g/dm3). Meiofauna was stained with rose Bengal before being sorted and enumerated at a higher taxon level based on Higgins & Thiel (Reference Higgins and Thiel1988) using a Wild M5 binocular. One hundred harpacticoid copepods were randomly picked and stored in 75% ethanol. Copepods were mounted on glycerine slides for further identification to copepod family level using the identification keys and reference books by Boxshall & Hasley (Reference Boxshall and Hasley2004) and Lang (Reference Lang1948, Reference Lang1965).
Environmental data
The samples for the community characterization were also used to assess the total organic carbon content (TOC). Subsamples were weighed after being dried at 60°C for 72 h. TOC was measured after acidification with HCl and pulverization for 30 minutes of the dried material. TOC analyses were carried out with a ThermoFinnigan Flash1112 elemental analyser using the method of Niewenhuize et al. (Reference Nieuwenhuize, Maas and Middelburg1994).
Trophic biomarkers
For stable isotope analysis separate qualitative samples were taken from the seagrass material habitats. The two macrophytodetritus habitats (SMF and LMF) were sampled using 30 l bags where the material was scooped in by hand. The living leaves habitat was sampled by cutting five shoots at the sediment interface. All samples were afterwards kept in aquaria in order to collect harpacticoid copepods using positive phototaxis attraction and a pipette. The extracted copepods were rinsed and placed overnight in filtered seawater to empty their gut content. Two potential food sources including leaves (living or as macrophytodetritus) without and with associated epiphytes were collected according to the technique used by Dauby & Poulicek (Reference Dauby and Poulicek1995). The leaves without epiphytes, the epiphytes and the copepod samples (60 ind. sample−1 in order to have a sufficient amount of carbon for reliable measurements) were stored directly after collection in liquid nitrogen at −80°C. All the samples were dried afterwards for 24 h at 60°C and loaded into tin capsules for isotopic measurements with a C-N-S elemental analyser (Carlo Erba, Italy) coupled to a mass spectrometer (VG Optima, Micromass, UK). Prior to the encapsulation all seagrass material potential food sources were ground, except for harpacticoid copepods. The isotopic data were expressed as δ value (‰) relative to the VPDB (Vienna Peedee Belemnite) carbon standard. Reference material used to calibrate was IAEA (International Atomic Energy Agency) CH-6 (δ13C = −10.4 ± 0.2‰). The standard deviation of repeated δ13C measurements of the internal standard was ± 0.2‰.
Contribution of potential food sources to the carbon pool of harpacticoid copepods was estimated by a SIAR mixing model developed in R (Parnell et al., Reference Parnell, Inger, Bearhop and Jackson2010). The model was run for 500,000 iterations and the first 50,000 iterations were discarded. Isotopic ratios of copepods and food sources were compared considering a trophic enrichment of 0.2 ± 0.6‰ for δ13C (adapted from Vander Zanden (Reference Vander Zanden and Rasmussen2001)). In this study only the mode and lowest and highest 0.95% confidence interval (CI) were detailed. The value used in the model was the overall mean of epiphytes from the two other habitats (−20.0 ± 1.0‰), due to the lack of data on epiphytes from small macrophytodetritus fragments. To reduce the number of food sources and to avoid bias, the model was run with two sources (epiphytes and leaves without attached epiphytes), except for the small macrophytodetritus fragments where no separation of epiphytes was possible, leaves with epiphytes were used. The living leaves and macrophytodetritus with associated epiphytes were not considered in the mixing models since this source was a combination of two other potential food sources and therefore biasing the mixing model outcome.
Data analysis
Diversity indices were calculated using S, the number of meiofauna taxa or copepod families, N inf, the dominance index, the reciprocal of the proportional abundance of the most common taxon or family (reciprocal of the Berger–Parker index), J′, the Pielou evenness index and H′, the Shannon–Wiener diversity index based on the natural logarithm (ln). A resemblance matrix based on Bray–Curtis similarities was constructed from the log transformed abundances for meiofaunal taxa and harpacticoid copepod families. A cluster analysis based on the Bray–Curtis similarity matrix was performed to explore community structure similarities among the different habitats using the group average linkage method. Prior to the cluster analysis an analysis of similarity (ANOSIM) was carried out to test whether the defined communities (based on habitats) were significantly different. A similarity percentages (SIMPER) analysis based on a Bray–Curtis similarity matrix of the harpacticoid copepod composition was done to reveal which families characterize and discriminate each habitat. All the above mentioned analyses were performed with the Primer 6.0 software (Clarke & Gorley, Reference Clarke and Gorley2006). Differences in composition among all habitats were tested by means of a one-way analysis of variance (ANOVA) done on relative data. A posteriori comparisons were carried out with the Tukey test using 95% confidence limits. Significant differences among two habitats were tested by means of a t-test. The ANOVAs, Tukey tests, t-tests and graphs were made using GraphPad 5.04 for Windows (GraphPad Software, La Jolla, California BSA).
RESULTS
Meiofauna communities
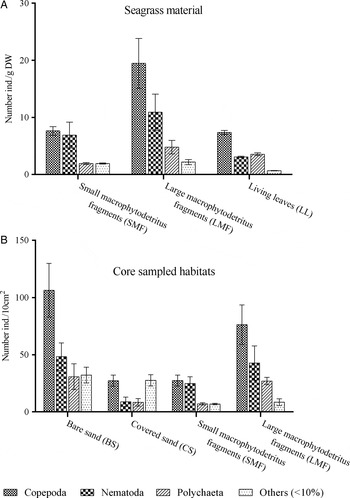
For meiofauna abundances the standardization against surface area yielded a decreasing trend: 217.5 ± 92.8 ind.10 cm−2 (BS), 146.2 ± 63.6 ind.10 cm−2 (LMF), 72.1 ± 26.7 ind.10 cm−2 (CS) and 57.8 ± 20.2 ind.10 cm−2 (SMF) (Figure 2A). In terms of meiofaunal densities, all four cored habitats were significantly different (one-way ANOVA, F(3,8) = 4.75, P = 0.0035). The Tukey test comparison revealed that only BS and SMF were significantly different from each other (Tukey, P < 0.05). Standardization against dry weight generated the following decreasing trend: 39.4 ± 4.1 ind.g−1DW (LMF), 14.9 ± 3.0 ind.g−1 DW (SMF) and 13.9 ± 2.0 ind.g−1 DW (LL) (Figure 2B). Regarding meiofaunal densities, all three seagrass material habitats were significantly different (one-way ANOVA, F(2,6) = 54.42, P < 0.0001). The Tukey test comparison revealed that only SMF and LL were not significantly different from each other (Tukey, P > 0.05).
Mean meiofauna densities per habitat type. (A) Mean densities in gDW−1; (B) mean densities in 10 cm−2 surface area. Error bars represent the standard deviation (N = 3).

In relation to relative composition, 88% of all organisms belonged to three taxa: copepods, nematodes and polychaetes. Copepods represented the highest average relative abundance of 49.4 ± 3.4% with a maximum of 54.1 ± 4.8% in LFM. Nematodes accounted on average for 23.3 ± 6.8% with a maximal density of 32.3 ± 6.4% in SFM. Polychaetes accounted on average for 15.0 ± 5.1% with a maximum of 24.1 ± 2.2% in the LL. The remaining 12% consisted of, in order of decreasing abundance: juvenile Amphipoda, nauplii, Ostracoda, Tanaidacea, Isopoda, Halacarida, Turbellaria, Leptostraca, Oligochaeta, Tardigrada, Decapoda, Chaetognatha, Cnidaria, Pycnogonida, Cumacea and Paguroidea.
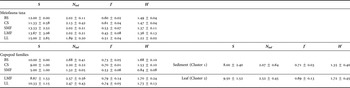
The meiofaunal community did not show any significant difference among the habitats in terms of assemblage structure (ANOSIM, R = 0.37, P = 0.001), with an overall similarity of 84% (SIMPER). The diversity indices showed no significant differences among all five habitats (t-test, p-values > 0.05) (Table 1).
Meiofauna and harpacticoid copepods diversity indices (S = number of harpacticoid families; N inf, dominance index: J′, Pielou's eveness index; H′, Shannon–Wiener index). Sediment and leaf regrouping were based on the harpacticoid copepod cluster analysis (Figure 3). Values are mean ± standard deviation.

BS, bare sand; CS, covered sand; SMF, small macrophytodetritus fragments; LMF, large macrophytodetritus fragments; LL, living leaves.
Copepoda family composition
For harpacticoid copepod abundances, standardization against surface area yielded the same decreasing trend as for meiofauna: 10.6 ± 4.1 ind.10 cm−2 (BS), 7.6 ± 3.0 ind.10 cm−2 (LMF), 2.7 ± 0.8 ind.10 cm−2 (CS) and 2.7 ± 0.8 ind.10 cm−2 (SMF) (Figure 2A). In terms of copepod densities, all four cored habitats were significantly different (one-way ANOVA, F(3,8) = 6.7, P = 0.0141). The Tukey test comparison revealed that only BS vs CS and BS vs SMF were significantly different from each other (Tukey, P < 0.05). Standardization against dry weight generated the following decreasing trend: 19.5 ± 1.3 ind.g−1 DW (LMF), 7.0 ± 0.70 ind.g−1 DW (LL) and 6.2 ± 1.9 ind.g−1 DW (SMF) (Figure 2B). In terms of copepod densities, all three seagrass material habitats were significantly different (one-way ANOVA, F(2,6) = 87.95, P < 0.0001). As observed for meiofauna, the Tukey test revealed that only SMF and LL were not significantly different (Tukey, P > 0.05).
In total, four copepod orders and 16 harpacticoid families were found in 1500 identified copepod specimens. The majority of the copepods (90.6 ± 3.0%) belonged to the order Harpacticoida. The remaining copepods were copepodites (2.9 ± 2.8%), representatives of the Cyclopoida order (6.1 ± 2.8%) or belonged to the orders Calanoida and Misophrioida (0.4 ± 0.3% together). Since only a minority (few %) of the collected copepods did not belong to the Harpacticoida order, further analysis focused only on the latter. The harpacticoid families found, in decreasing order according to their overall relative abundance, were, Tisbidae, Thalestridae, Miraciidae, Laophontidae, Ameiridae, Longipediidae, Ectinosomatidae, Tetragonicepsidae, Harpacticidae, Porcellidiidae Ancorabolidae, Peltidiidae, Canuellidae, Tegastidae, Cletodidae and Cylindropsyllidae.
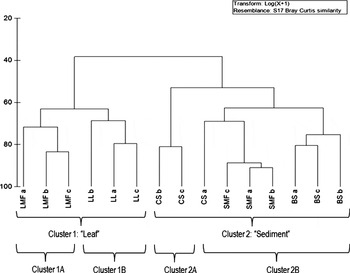
The harpacticoid copepods showed a significant difference among the habitats in terms of assemblage structure (ANOSIM, R = 0.92, P = 0.001), with an overall dissimilarity of 53% (SIMPER). ANOSIM habitat type pairwise comparisons test separated well all groups (R > 0.75) except for BS&CS and LMF&LL showing overlap but still yielding a difference of R = 0.70 and R = 0.63, respectively. Cluster analysis (Figure 3) revealed two major clusters: cluster 1 with an overall similarity of 62.6% and cluster 2 with an overall similarity of 52.9%. In the first cluster (cluster 1) a clear distinction was found among two habitats: the large macrophytodetritus fragments (cluster 1A, 71.7% similarity) and the living leaves (cluster 1B, 68.7% similarity). The second cluster (cluster 2) consisted of: two replicates of covered sand (cluster 2A, 81.0% similarity) and a cluster (2B, 62.6% similarity) of small macrophytodetritus fragments, bare sand and a single replicate of covered sand.
Cluster analysis of relative harpacticoid copepod densities. LL, living leaves; LMF, large macrophytodetritus fragments; SMF, small macrophytodetritus fragments; CS, covered sediments; BS, bare sand. similarity coefficient in % on y-axis and a, b, c refer to the replicates.

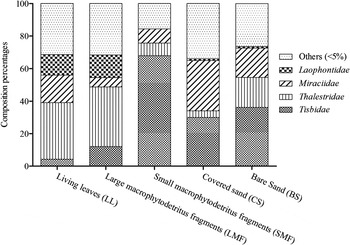
The two main clusters were significantly different (ANOSIM, R = 90, P = 0.001), showing an average dissimilarity of 61.7% (SIMPER). Cluster 1 had an overall average similarity percentage of 67.4% and four harpacticoid families were abundant with a cumulative contribution to the similarity of 86.8%. According to SIMPER analysis, the families primarily responsible for the similarity were, in decreasing order: Thalestridae (48.2%), Laophontidae (20.4%), Miraciidae (8.5%) and Tisbidae (8.7%). Cluster 2 had an average overall similarity percentage of 63.3% and was mainly characterised by three families with a cumulative contribution of 89.4% (SIMPER). A different decreasing contribution order was seen in comparison to cluster 1: Tisbidae (57.1%), Miraciidae (21.9%) and Thalestridae (10.4%) (Figure 4).
Mean relative composition (%) of the harpacticoid copepod families. Families shown represent a total contribution of more than 5% over all samples.

No significant differences were found in number of families (t-test, t(13) = 1.4, P = 0.199) between cluster 1 (S = 9.5 ± 1.5) and cluster 2 (S = 8.0 ± 2.4). In contrast to the significant difference among all habitats (one-way ANOVA, F(4,10) = 12.0, P = 0.0008), there was no significant difference among both clusters in terms of dominance index and Shannon–Wiener index (t-test, t(19) = 1.0, P = 0.333 and t(13) = 2.1, P = 0.056, respectively). The Pielou's evenness index showed a significant difference between the two clusters (t-test, t(13) = 2.6, P = 0.023) (Table 1).
Environmental data
Total organic carbon values showed significant differences among the habitats (one-way ANOVA, F(2,3) = 179.7, P = 0.0008) except for SMF and LMF comparison (Tukey, P > 0.05). Following TOC content were found in decreasing order: LL (31.0 ± 0.5%), LFM (20.6 ± 0.3%), SFM (19.7 ± 1.0%) and the sand habitats (<0.1%).
Trophic interactions by means of stable isotopes
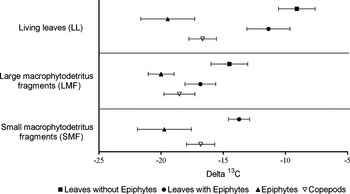
Harpacticoid copepods from the different seagrass material habitats showed slightly different, but analogous δ 13C values: −16.6 ± 1.1‰ (LL), −18.5 ± 1.3‰ (LMF) and −16.8 ± 1.1‰ (SMF) (Figure 5). Leaves with epiphytes were the most enriched 13C sources: δ 13C = −9.1 ± 1.5‰ (LL) and δ 13C = −14.5 ± 1.5‰ (LMF), however collection of epiphytes from SMF could not be achieved due to the high fragmentation and fragility of the macrophytodetrital material. Therefore only SMF with associated epiphytes could be analysed (δ 13C = −13.7 ± 1.1‰), which ranged within the values of LMF without epiphytes. The epiphytes present on the LL and on the LMF material (Figure 5) were by far the most depleted (δ 13C = −19.5 ± 2.2‰ and −20.0 ± 1.0‰, respectively) in the three seagrass material habitats. The combination of living leaves and macrophytodetritus with their attached epiphytes ranged between the values of the two latter separately with δ 13C = −11.4 ± 1.8‰ and −16.9 ± 1.2‰ for the LL and the LMF, respectively (Figure 5).
δ13C values (‰) of plant material as potential food sources and copepods (mean ± SD, N = 3). The full symbols are potential sources: leaves (living or macrophytodetritus) without epiphytes (squares), the removed epiphytes (triangles) and the leaves (living or macrophytodetritus) with their epiphytes (rounds). The open symbols are the harpacticoid copepods, primary consumers (reversed triangles).

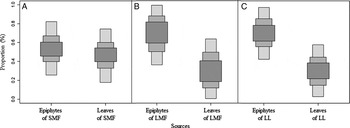
Mixing model computation showed higher contribution of epiphytes than leaf material as carbon source for copepods in LL and LMF. For the LL habitat, epiphytes 0.95 confidence interval (CI) ranged from 42% to 97% (mode 70%) and LL without epiphytes 0.95 CI was 2–57% (mode 30%). For LMF, epiphytes 0.95 CI ranged from 37% to 99% (mode 72%) and for LMF without epiphytes 0.95 CI was 0–63% (mode 28%). For SMF habitat, epiphytes 0.95 CI ranged from 23% to 81% (mode 51%) and SMF with epiphytes 0.95 CI ranged from 18% to 76% (mode 49%) (Figure 6).
SIAR boxplots show the proportional contribution (%) of different sources to the diet of harpacticoid copepods in (A) the small macrophytodetritus fragments habitat (SMF), (B) the large macrophytodetritus fragments habitat (LMF) and (C) the living leaves habitat (LL) with 95% (darkest grey), 75% and 25% (lightest grey) credibility intervals.

DISCUSSION
In the present study, it was remarkable to see that harpacticoid copepods numerically dominated the meiofauna samples in all habitats. Half of the meiofaunal organisms were harpacticoid copepods and only a quarter were nematodes. This is in contrast with most studies on meiofauna in seagrass meadows sediments (e.g. Fonseca et al., Reference Fonseca, Hutchings and Gallucci2011; Losi et al., Reference Losi, Montefalcone, Moreno, Giovannetti, Gaozza, Grondona and Albertelli2012) where nematodes dominate numerically. Nevertheless, dominance of copepods is often documented for seagrass meadow canopy leaves (Hall & Bell, Reference Hall and Bell1993; De Troch et al., Reference De Troch, Gurdebeke, Fiers and Vincx2001; Hooper & Davenport, Reference Hooper and Davenport2006).
The analysis of meiofauna at taxon level did not show any significant differences among the different habitats either in terms of assemblage composition or diversity. Indeed, the five habitats presented a high similarity, i.e. more than 84% (SIMPER). The LMF had the highest meiofaunal abundance from the seagrass material habitats which could indicate that the potential food quality/quantity or protection from predation was the highest in these habitats. A potential increase in complexity can be a reason for this, however concrete measurements (e.g. compactibility of the accumulation) to prove the possible rise in complexity were not part of this study. It could also be caused by an increase of biofilm quantity or quality as dead leaves are colonized by degrading microbes and generally lie on the sediment, exposed to sun light, in contrast to living leaves which are vertically disposed and often over-shaded.
Within the core sampled habitats, a significant difference in abundance between bare sand and covered sand was observed. This could be explained by the possible anoxia created by the layer of macrophytodetritus above the covered sand. We expect that the oxygen does not penetrate deep enough through the macrophytodetritus to reach the sand and thus oxygen levels can become limiting. As a result, meiofauna could migrate upwards from the sand towards the macrophytodetritus. In the present study, no measurements of oxygen were available, but it could be definitely interesting to include them in future research.
In terms of harpacticoid copepod density, the same higher abundance trend for bare sand and large macrophytodetritus fragments compared to covered sand and small macrophytodetritus fragments was found, similar to the meiofauna results. We could assume that bare sand includes most of the copepods and when covered by macrophytodetritus these then migrate/emerge into large macrophytodetritus fragments. Nevertheless, in terms of harpacticoid copepod family composition, two main significantly different clusters with a similarity of approximately 38.3% were displayed. The low similarity indicates that the small macrophytodetritus fragments habitat behaves like a sediment habitat (CS and BS) and that the large macrophytodetritus fragments habitat was similar to the living leaves habitat for copepod family composition. Therefore, cluster 1 (LL and LMF) and cluster 2 (SMF, CS and BS) will further be referred to as ‘leaf” and ‘sediment’, respectively. Thus we can hypothesize that bare sand and large macrophytodetritus fragments attract harpacticoid copepods adapted to different habitat. Harpacticoid copepods are morphologically diverse and well-adapted group occurring in numerous environments (Hicks & Coull, Reference Hicks and Coull1983; Huys & Boxshall, Reference Huys and Boxshall1991; Boxshall & Hasley, Reference Boxshall and Hasley2004). The phytal living leaves environment is exposed to waves and currents. Organisms living in that habitat developed attachment capabilities such as prehensile grasping legs (e.g. copepod families Thalestridae and Laophontidae) or body flattening (Porcellididae and Peltitidae). Macrophytodetritus accumulations on sandy patches are temporary, which implies that all meiofauna could be transported passively on the senescent leaves or immigrate actively from the surrounding habitat. High vagility of the phytal meiofauna was demonstrated by Bell & Hicks (Reference Bell and Hicks1991) and the active emergence and colonization abilities of copepods to richer or easier accessible food resources was proven by Armonies (Reference Armonies1988) and Thistle & Sedlacek (Reference Thistle and Sedlacek2004). Experiments with artificial substrates (Mirto & Danovaro, Reference Mirto and Danovaro2004) emphasize the good swimming and colonization abilities of copepods, which partially explains the higher abundance of copepods in the large macrophytodetritus fragment. As such, the good colonization abilities of harpacticoid copepods could explain the high resemblance in terms of copepod assemblage structure between large macrophytodetritus fragments and living leaves on the one hand and between small macrophytodetritus fragments, bare sand and covered sand on the other hand. Novak (Reference Novak1984) stated that epiphytic cover increases from young to mature leaves. Large macrophytodetritus fragments which are senescent mature leaves exhibit a lower total organic carbon content than living leaves. Nonetheless, large macrophytodetritus fragments displays by far the highest number of individuals per gram dry weight. Therefore we can hypothesize that the content of the potential food sources does not seem to be the determining factor, but rather, the accessibility of the food source. It has been demonstrated that harpacticoid copepods occur primarily in function of resource availability (Webb, Reference Webb1990), followed by hydrodynamic exposure, surface area colonizable by epiphytes (De Troch et al., Reference De Troch, Vandepitte, Raes, Suarez-Morales and Vincx2005) and food accessibility. Well-developed and accessible epiphytic biofilms could thus enhance the species richness and density of the meiofauna (Hall & Bell, Reference Hall and Bell1993; Peachey & Bell, Reference Peachey and Bell1997). This was congruent with some morphological adaptations found among the meiofaunal taxa. Only a small fraction of the phytal meiofauna (some nematodes, tardigrads and halacarids) can feed directly from the plant tissue, whereas the majority of meiofauna graze on the organic biofilm present on the leaves (e.g. Giere, Reference Giere2009). Macrophytodetrital accumulations function thus as refuge from predators and provide ample food supply (Bonsdorff, Reference Bonsdorff1992; Norkko et al., Reference Norkko, Bonsdorff and Norkko2000).
Stable isotope analysis was used to identify trophic interactions and dietary relationships between the harpacticoid copepods and their potential food sources. The recorded stable isotope data of Posidonia oceanica leaves showed a range in δ 13C values between −13‰ and −8‰, however most delta values varied around −12‰ (Hemminga & Mateo, Reference Hemminga and Mateo1996). These relatively high δ 13C values compared to other potential source materials, like epiphytes (δ 13C value around –20‰) make it possible to trace seagrass material in fauna diet. In our present study harpacticoid copepods were more 13C depleted than the P. oceanica leaves or macrophytodetritus and more 13C enriched than the attached epiphytic biofilm. The analogous harpacticoid copepod signatures in all three seagrass material habitats suggest that they feed on similar sources, independent of the habitat where they occur. The SIAR mixing model revealed that epiphytes contribute more to the carbon resource for harpacticoid copepods than plant material, living or macrophytodetrital, do. This was congruent with the conclusion of Fry et al. (Reference Fry, Macko and Zieman1987) on the basis that epiphytic algae can have an equal or greater nutritional importance than seagrasses for consumers in seagrass meadows. Since the outcome of the mixing model for SMF was biased due to the non-separation of the epiphytes from the leaves, no clear conclusion can be drawn for this particular habitat.
Harpacticoid copepods are known to feed on a variety of food sources (Hicks & Coull, Reference Hicks and Coull1983) and they can colonize plastic seagrass mimics (De Troch et al., Reference De Troch, Vandepitte, Raes, Suarez-Morales and Vincx2005). It was known that the epiphytic biofilm consists of different food sources ranging from cyanobacteria to diatoms and fungi and consequently represents a very variable food quality (Novak, Reference Novak1984; Lepoint et al., Reference Lepoint, Cox, Dauby, Poulicek and Gobert2006). The macrophytodetritus epiphytic biofilm compared to the seagrass epiphytic biofilm was composed of a higher number of detrital organisms, such as fungi and bacteria (Lepoint et al., Reference Lepoint, Cox, Dauby, Poulicek and Gobert2006). Therefore we can hypothesize that the main reason why epiphytes contribute primarily to the food supply of harpacticoid copepods was due to the richer organic content in comparison to the poor macrophytodetrital material. Nevertheless, the isotopic composition did not exclude the occurrence of seagrass and macrophytodetritus in the diet of copepods. The question arose as to whether harpacticoid copepods actively graze on plant material or accidently ingest and assimilate it during epiphytic biofilm grazing. The isotopic signatures of P. oceanica macrophytodetritus (LMF and SMF) differ from living leaves (LL) by 3.9 ± 1.1‰. This can be explained by the fractionation during decomposition. Nutrients are resorbed in senescing leaves before abscission and labile nutrients are quickly mobilized by bacterial degradation (Mateo & Romero, Reference Mateo and Romero1997). Next to the decomposition fractionation, the origin of the macrophytodetrital leaves could play a major role. Macrophytodetritus found on the studied sand patch does not necessarily come from the adjacent meadow but may be from deeper meadows which exhibit a lower isotopic signature due to the light constraint on photosynthesis rate (Lepoint et al., Reference Lepoint, Dauby, Fontaine, Bouquegneau and Gobert2003).
CONCLUSIONS
Meiofauna community assemblages were similar in the five habitats analysed in the present study. Meiofauna densities were the highest in the bare sand, followed by large macrophytodetritus fragments compared to the other core sampled habitats. Harpacticoid copepods were found to be the most abundant taxa and had the highest density in large macrophytodetritus fragments compared to the other seagrass material habitats. On the basis of harpacticoid copepod assemblage structure, the five different habitats were divided in two main clusters: a sediment group and a leaf habitat group. The small macrophytodetritus fragments showed a higher similarity with both sand habitats in harpacticoid copepod composition and therefore can thus be considered to be more similar to sediment habitats than to phytal habitats. Copepod stable isotope signatures were similar, which indicates they feed on analogous food sources in the different habitats. As epiphytes contribute for 70% to the copepods' carbon signature in living leaves and large macrophytodetritus fragments, they appear to be the preferential carbon source for harpacticoid copepods (SIAR mixing model).
ACKNOWLEDGEMENTS
The authors warmly thank the Stareso field station staff for their support during the sampling campaign. The authors thank anonymous referees for their constructive remarks that contributed to the improvement of the manuscript. This is the MARE paper number (293).
FINANCIAL SUPPORT
The first author acknowledges a PhD FRIA grant (Fund for Research Training in industry and in agriculture) of the Belgian National Fund for Scientific Research (FRS-FNRS). This work was part of the Master's thesis of the first author, to obtain the degree in Marine and Lacustrine Sciences, Ghent University (2010). This study was conducted within the frame of FRS-FNRS research project FRFC 2.4511.09 (University of Liège) with additional support provided by the Ghent University (BOF-GOA 01GZ0705 and 01GA1911W). G. Lepoint is a Research Associate of the FRS-FNRS. M. De Troch is a postdoctoral fellow financed by the Special Research Fund of the Ghent University (BOF-GOA 01GA1911W).