I. INTRODUCTION
With the urgent demand for weight reduction of transportation vehicles and energy saving in recent years, Mg alloys have shown great development and prospects in industrial applications due to their unique benefits, such as high specific strength, high stiffness, high creep resistance, and good damping capacity combined with quite low density. Reference Mordike and Ebert1 Among all the Mg alloys, Mg-rare earth (Mg-RE) alloys are attractive as high-performance structural materials used in aerospace and automotive industries. Reference Li, Zeng, Dong and Zhai2 Furthermore, the Mg–Gd–Y–Zr (designated as GWK) series are generally believed to be the most prominent alloys of all the Mg-RE alloys. Reference Nakatsugawa, Kamado, Kojima, Ninomiya and Kubota3 It has been reported that the recently developed GWK series showed considerable precipitation hardening; therefore, higher specific strength and creep resistance could be obtained at both room and elevated temperatures as compared to conventional Al and Mg alloys, including WE54 (Mg–5Y–2Nd–2HRE, wt%), whose high-temperature strength is the highest of the existing commercial Mg alloys. Reference Anthony, Kamado and Kojima4–Reference Anyanwu, Kamado and Kojima7 Many investigations have been reported concerning microstructure and mechanical properties of GWK alloys in recent years. Reference Anthony, Kamado and Kojima4–Reference Kawabata, Matsuda, Kamado, Kojima and Ikeno11 Anyanwu et al. Reference Anthony, Kamado and Kojima4 investigated the relationship between microstructure and mechanical properties of GWK alloys and suggested that Gd promoted high strength while Y promoted high elongation in magnesium alloys containing both Gd and Y. Wang et al. Reference Wang, Meng, Zhang and Tang8 investigated the effect of Y for enhanced age hardening response and mechanical properties of the GWK alloys, showing that the age hardening response of the alloys enhanced and tensile properties increased with increasing Y content. Sun et al. Reference Sun, Wu, Wang and Ding9 suggested that the addition of Zr in GWK alloys could refine the grains and did not form a new phase. The differences in the sizes and distributions of the Zr-rich particles had significant effects on the corrosion behaviors, and Zr worked mainly by restricting grain growth or generating nucleus. Moreover, Sun et al. Reference Sun, Wu, Wang and Ding9 also suggested that the alloy with 0.42 wt% Zr addition revealed the optimum combination of mechanical properties and corrosion resistance. Jafari et al. Reference Jafari Nodooshan, Wu, Liu, Wei, Li and Zhang10 suggested that the amount of cuboid-shaped phases and β′ precipitates increased significantly with increasing the Gd content. Kawabata et al. Reference Kawabata, Matsuda, Kamado, Kojima and Ikeno11 investigated the microstructure of the initial and peak aged conditions by transmission electron microscopy (TEM), and reported that coherent β″ phase with a D019 structure precipitates first, followed by the precipitation of β′ phase with a base-centered orthorhombic (bco) structure. And the precipitation sequence of GWK series alloys has been determined as: super-saturated solid solution (S.S.S.S.) → β″(D019) → β′(bco) → β1(fcc) → β(fcc), which is similar to that of the WE54 alloy. Reference He, Zeng, Peng, Gao, Nie and Ding5
A lot of studies have focused on Mg-RE alloys containing Zn in recent years, such as Mg–Y–Zn, Mg–Gd–Zn and Mg–Y–Nd–Gd–Zn alloys. Reference Zhang, Fan, Zhang, Wu, Liu, Cui and Feng12–Reference Kawamura, Hayashi, Inoue and Masumoto15 It has been reported that a certain amount of Zn addition to Mg-RE (Y, Gd, Tb, Dy, Ho, Er, Tm) alloys results in the formation of the long period stacking ordered (LPSO) structure. Reference Li, Zeng, Dong and Zhai2,Reference Honma, Ohkubo, Kamado and Hono14–Reference Zhu, Morton and Nie21 These investigations demonstrated that Zn exerted a beneficial effect on improving the mechanical properties due to the formation of the LPSO structure. It is well known that both the LPSO structure and RE precipitates contribute to the good performance of Mg alloys. Reference Zhang, Liu, Gu, Lu, Yuan and Ding16 The LPSO structure has been first reported in the Mg12YZn alloy, called X phase by Luo et al. Reference Luo, Zhang, Tang and Zhao13 Afterward, the effect of the LPSO structure on mechanical properties has been extensively investigated in Mg-RE (RE = Y, Gd, Tb, Dy, Ho, Er, Tm)–Zn alloys with different heat treatments. Kawamura et al. Reference Kawamura, Hayashi, Inoue and Masumoto15 developed the Mg97Y2Zn1 (at.%) alloy firstly by hot extrusion of rapid solidified powders at 573 K, which exhibited the ultimate tensile strength of about 610 MPa and elongation of 5% at room temperature. The main reason for the excellent mechanical properties of these alloys is that the existence of the LPSO structure improves the hardness and strength of Mg alloys. Reference Chino, Mabuchi, Hagiwara, Iwasaki, Yamamoto and Tsubakino22 Suzuki et al. Reference Suzuki, Kimura, Koike and Maruyama23 suggested that the strengthening effects of Zn on the Mg–Y–Zn alloy might be due to the decrease in the stacking fault energy and consequent reduction of mobility of dislocations. Honma et al. Reference Honma, Ohkubo, Kamado and Hono14,Reference Liu, Zhang, Su, Tang, Rokhlin, Elkin and Meng20 found that the number density of β′ precipitates decreased by the addition of Zn, and the Zn addition had an effect on improving the elongation at the expense of strength. In addition, it was also reported Reference Zhang, Yuan, Lu and Ding18 that in Mg–Gd–Zn and Mg–Gd–Y–Zn alloys prepared by permanent mold casting, no LPSO structure was observed in the as-cast condition but precipitated as 14H from the matrix upon annealing. Meanwhile, Yamada et al. Reference Yamada, Okubo, Shiono, Watanabe, Kamado and Kojima24 suggested that LPSO structure which is typically observed in as-cast Mg–Gd–Zn and Mg–Y–Zn alloys formed during cooling of ingot after solidification and completely solutionized by subsequent solution treatment at 773 K. Furthermore, Huang et al. Reference Huang, Wang, Hou, Huang and Pan25 analyzed the effect of different Gd and Y contents on the microstructural evolution of LPSO structure and the corresponding mechanical properties of Mg–Gd–Y–Zn–Mn alloys. It indicated that the main eutectic phase is (Mg, Zn)3(Gd, Y) in the alloys with high Gd and low Y contents, while Mg24(Gd, Y, Zn)5 in the alloys with high Y and low Gd contents. Lee et al. Reference Lee, Kim, Lim and Kim26,Reference Liu, Yuan, Zhang, Zhang, Lu and Ding27 studied the effect of Zn/Y and Zn/Gd ratio on microstructure and mechanical properties of Mg–Zn-RE alloys, which showed that the microstructure and mechanical properties changed with adding different Zn contents.
Up to now, the Mg–9Gd–3Y–0.5Zr alloy has already been used in the field of aerospace. However, low ductility under peak-aged condition has restrained its widespread application. Therefore, it is imperative to find a way to improve the ductility of the Mg–9Gd–3Y–0.5Zr alloy without reducing its strength. Recently, influence of trace Zn addition (<1.5 wt%) into Mg-RE alloys have been reported. Su et al. Reference Su, Liu and Wan28 found that 0.2 wt% Zn addition could improve the strength and ductility of the WE43 alloy. Zhang and Kang et al. Reference Zhang, Fan, Zhang, Wu, Liu, Cui and Feng12,Reference Kang, Wu, Chen and Han29 studied the effect of heat treatment on the microstructure and mechanical properties of Mg–4Y–(2.5–3)Nd–1Gd–0.2Zn–0.5Zr alloy and obtained higher mechanical properties compared with the Mg–4Y–(2.5–3)Nd–1Gd–0.5Zr alloy, with ultimate tensile strength from 283.5 to 297.6 MPa, elongation from 2.35 to 4.6% under peak-aged condition. As mentioned above, trace Zn addition is favorable to improve the ductility of the Mg-RE alloys. However, the effect of Zn addition (≤1.5 wt%) on the microstructure, mechanical properties, and fracture behavior of Mg–9Gd–3Y–0.5Zr alloy has not been deeply studied. Therefore, it is worthy of further study and exploitation.
In the present study, various contents of Zn (0, 0.2, 0.5, 1.0, and 1.5 wt%) were added into Mg–9Gd–3Y–0.5Zr alloy, and the influence of Zn addition on microstructure, mechanical properties, and fracture behavior of Mg–9Gd–3Y–0.5Zr alloy under different thermal treatment conditions was investigated.
II. EXPERIMENTAL METHODS
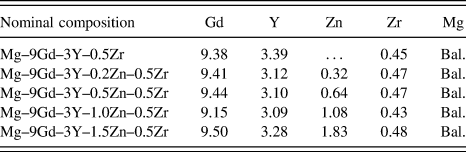
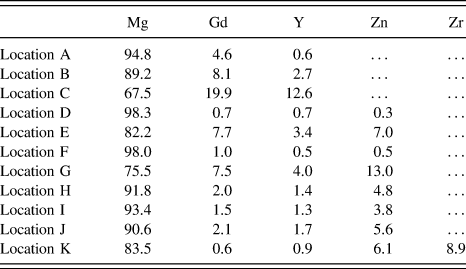
The nominal compositions of the studied alloys were Mg–9Gd–3Y–xZn–0.5Zr (x = 0, 0.2, 0.5, 1.0, and 1.5) (wt%) (all compositions are in wt% hereafter unless otherwise noted). For convenience, the Mg–9Gd–3Y–xZn–0.5Zr (x = 0, 0.2, 0.5, 1.0, and 1.5) alloys were named as 0Zn, 0.2Zn, 0.5Zn, 1.0Zn, and 1.5Zn, respectively. The ingots were prepared via conventional ingot metallurgy (I/M) by melting high purity (≥99.9%) Mg, Zn, Mg–87% Gd, Mg–20% Y, and Mg–30% Zr master alloys. All these pure metals and master alloys were preheated to about 473 K in a baking oven and then melted in an electric resistance furnace under a mixed protective gas consisting of SF6 (1.0%, volume fraction) and CO2 (bal.) to prevent burning of the melts. After refined at 1023 K for 6–8 min, the melt at 1013 K was poured into a steel mold preheated to 473 K. The actual compositions of the alloys measured by Inductively Coupled Plasma-Atomic Emission Spectroscopy (ICP-AES) were listed in Table I.
Actual chemical compositions of the investigated alloys (wt%).

Specimens for tensile tests were cut into rectangular shape with 10 mm in gauge length, 3.5 mm in width and 2 mm in thickness by an electric-sparking wire-cutting machine. Tensile tests were performed at ambient temperature utilizing Zwick/Roell Z100 test machine (Zwick, Ulm, Germany) equipped with an extensometer at the strain rate of 1 × 10⁻³ s−1. Vickers hardness (VH; HV-300, Shanghai Hugong Co., Ltd., Shanghai, China) tests were conducted using a 49 N load and a dwell time of 15 s. Not fewer than 10 measurements were made for each specimen. Solution treatments at 773 K for 6 h for 0Zn, 0.2Zn, and 0.5Zn alloys, while 793 K for 10 h for 1.0Zn and 1.5Zn alloys, were carried out in an electric furnace under the protection of SO2 atmosphere and water quenching was adopted subsequently. Then the solution-treated alloys were isothermally aged at 498 K for different time in an oil-bath to obtain hardening curves. Microstructure observation was conducted by optical microscope (OM; ZEISS, Oberkochen, Germany) and scanning electron microscope (SEM; Phenom XL, Phenom-World, Eindhoven, Holland) equipped with an energy dispersive spectrometer (EDS). Specimens under different thermal conditions for OM observation were etched in a solution of 4.2 g picric acid, 10 mL acetic acid, 10 mL water and 70 mL ethanol. The mean grain size D was determined by the linear intercept method using the equation D = L/(NV), where L is the total length of test line, N is the number of intercepts, and V the magnification of the photomicrograph. Reference Zhang, Fan, Zhang, Wu, Liu, Cui and Feng12 At least 300 grain boundaries were counted for each alloy under different thermal conditions. Phase analysis was carried out by X-ray diffraction (XRD; Rigaku Ultima IV, Rigaku Corporation, Tokyo, Japan) with a resource of Cu-Kα radiation at the scanning rate of 4°/min.
III. RESULTS AND DISCUSSION
A. Microstructures of the as-cast alloys
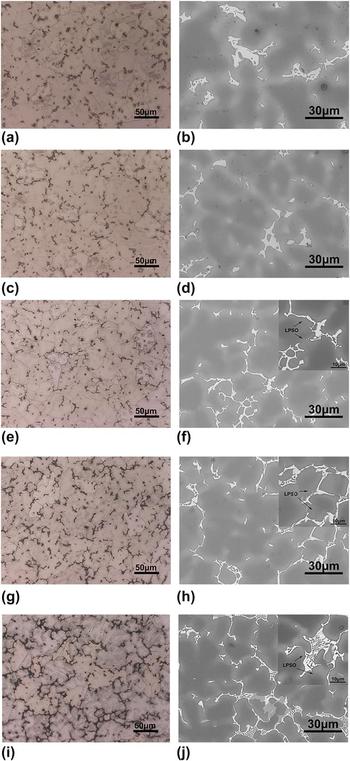
Optical microstructures and SEM micrographs of the as-cast Mg–9Gd–3Y–0.5Zr alloys with different Zn content are shown in Fig. 1. It is obvious that the as-cast alloys are mainly composed of the α-Mg matrix and network-shaped eutectic compounds, which distribute along the α-Mg grain boundaries. The network-shaped eutectic compounds are mostly distributed in the triple junction of grain boundaries. The volume fraction of eutectic compounds increases with increasing the Zn content, which indicates that the solubility of Gd and Y atoms in Mg is declined by addition of Zn during solidification. The as-cast 0Zn, 0.2Zn, 0.5Zn, 1.0Zn, and 1.5Zn alloys have average grain sizes of ∼30 μm, that are 29.5, 28.7, 25.2, 27.9, and 29.0 μm, respectively. It is reported that the addition of Zn to GWK alloy led to somewhat finer grains of α-Mg (from 114 to 102 μm) and larger volume fraction of eutectic phases. Reference Liu, Chen and Han30
Microstructure of the as-cast alloys: (a, b) 0Zn; (c, d) 0.2Zn; (e, f) 0.5Zn; (g, h) 1.0Zn; (i, j) 1.5Zn.

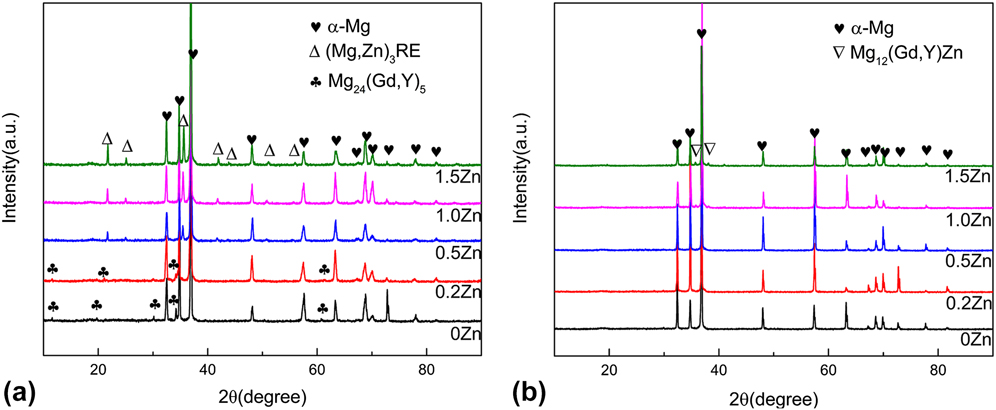
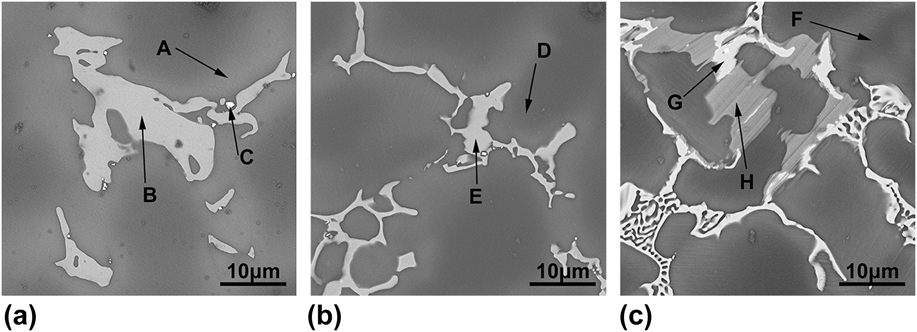
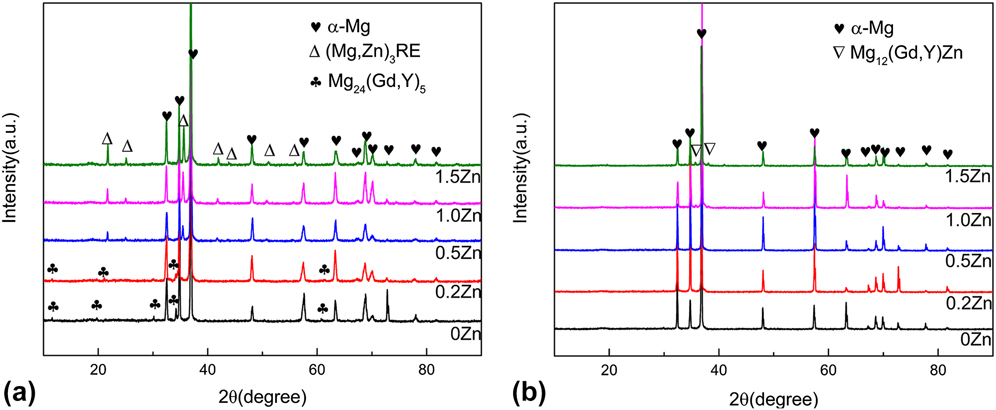
The corresponding XRD patterns of the as-cast alloys are presented in Fig. 2(a), which suggest that eutectics are mainly Mg24(Gd, Y)5 in the 0Zn and 0.2Zn alloys, while (Mg, Zn)3RE in the 0.5Zn, 1.0Zn, and 1.5Zn alloys. Higher-magnification SEM images of Figs. 1(b), 1(f), and 1(j) and the corresponding EDS analysis results are shown in Fig. 3 and Table II, respectively. The average composition of Mg in eutectic phases of the 0Zn alloy is approximately 86–88%, which indicates that the stoichiometry of eutectic compound is close to Mg24(Gd, Y)5 or Mg5(Gd, Y). Reference He, Zeng, Peng, Gao, Nie and Ding6 However, with the addition of Zn, the as-cast 0.5Zn alloy consists of α-Mg matrix with Gd + Y + Zn in solid solution and the eutectic phases with a stoichiometry similar to (Mg, Zn)3RE according to EDS and the XRD results (Table II and Fig. 2). In addition, there are two different eutectic phases in the as-cast 1.5Zn alloy, which can be seen and detected from Fig. 3(c) and Table II. The bright area (Location G) is detected as (Mg, Zn)3RE, while the gray area (Location H) is Mg12(Gd, Y)Zn (designated as X phase), which was found in the as-quenched alloys as well and will be mentioned below. Cuboid-shaped phases (Location C), which composed of a large amount of Gd and Y, can be seen in the as-cast alloys by SEM from Fig. 3(a) and detected by EDS. However, the cuboid-shaped phase is too small and scarce to be determined by XRD analysis. Furthermore, the as-cast alloys contain Zr-rich zones, which play a role in core for heterogeneous nucleation and grain refinement, which affect the mechanical properties significantly but do not affect the RE phase structures. Reference Sun, Wu, Wang and Ding9
XRD patterns of the alloys: (a) as-cast; (b) as-quenched.
SEM images of the eutectic compounds in as-cast alloys: (a) 0Zn; (b) 0.5Zn; (c) 1.5Zn.

EDS results of the tested alloys (at.%).

In addition, it should be noted that lamellar-shaped LPSO structure is found to be inside α-Mg grains of the as-cast alloys (Zn content >0.2%) and its volume fraction increases with raising Zn content [see Figs. 1(f), 1(h), and 1(j)]. The volume fraction of the LPSO structure of 0.2Zn alloy is nearly negligible, possibly because the 0.2% Zn is too low to form new phases like LPSO structure in Mg–Y–Zn alloys. Reference Shao, Yang and Ma31 Comparatively, many α-Mg grains are filled with LPSO structure in 1.5Zn alloy. These LPSO structures are uniformly distributed from the eutectic compounds to the interior of the α-Mg grains and are oriented in one direction within a grain. This suggests that the lamellar-shaped LPSO structure has a specific orientation relationship with the α-Mg matrix. These fine-lamellar phases are also typically observed in the as-cast Mg–Gd–Zn and Mg–Y–Zn alloys formed during cooling of the ingot after solidification and completely solutionized by subsequent solution treatment at 773 K. Reference Yamada, Okubo, Shiono, Watanabe, Kamado and Kojima24 Zhu et al. Reference Zhu, Morton and Nie21 suggested that the lamellar-shaped structure which could be seen in the as-cast Mg–8Y–2Zn–0.6Zr (wt%) alloys was 18R LPSO, and the 18R structure transformed to 14H during appropriate heat treatment. In addition, the X phase (Location H) which can be seen in Fig. 3(c) was reported to be the LPSO structure as well, Reference Zhang, Yuan, Lu and Ding18,Reference Gao, Wang, Gu, Zhao, Tong and Yin19 and will be discussed below. Therefore, the LPSO structure in the as-cast 1.0Zn and 1.5Zn alloys comes from two variant methods: one is a lamellar LPSO structure within α-Mg matrix, the other is a formation of lamellar X phase in grain boundaries.
According to the reports by Ding et al., Reference Ding, Wu, Peng, Zeng, Yuan and Lin32 the characteristics of the constituents of LPSO structures in Mg-RE (RE = Y, Dy, Ho, Er, Gd, Tb, Tm)–X(Zn, Cu, Al) alloys may be modified as follows: (i) RE elements have large solid solubility limits (≥3.75 at.%) in Mg; (ii) RE elements have hcp structures at room temperature; (iii) a certain temperature and duration time during solid solution heat treatment; (iv) a larger degree of supercoiling during solidification; (v) the atomic sizes of X(Zn, Cu, Al) and RE elements are smaller and larger than Mg, respectively, i.e., RE > Mg > X(Zn, Cu, Al); or (vi) Mg, RE, and X(Zn, Cu, Al) have negative mixing enthalpies for each pair (in particular the mixing enthalpy of the RE-X(Zn, Cu, Al) pair is larger and negative).
B. Microstructures of the as-quenched alloys
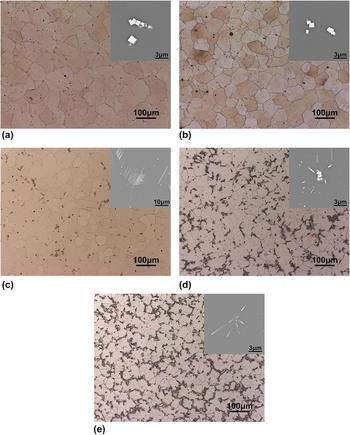
Microstructures of the as-quenched alloys after solution treatment are shown in Fig. 4. Almost all the eutectic phases which are observed along the grain boundaries in the as-cast 0Zn and 0.2Zn alloys have dissolved into magnesium matrix, which is consistent with the results of XRD patterns in Fig. 2(b). However, some eutectics are remained undissolved at triple grain boundaries in alloys with higher Zn content (Zn content ≥0.5%). It seems that the solution of Zn reduces solid solubility of RE. With increasing Zn content, the amount of eutectics increases. Cuboid-shaped phases with 1 μm or less in size are insoluble and unevenly distributed in the matrix and boundary, as shown in the SEM images in Fig. 4, demonstrating it is thermal stable during solution treatment.
Microstructure of the as-quenched alloys: (a) 0Zn; (b) 0.2Zn; (c) 0.5Zn; (d) 1.0Zn; (e) 1.5Zn.

In addition, there is a significant fraction of colonies of black dots in the optical microstructure of 1.0Zn and 1.5Zn alloys [Figs. 4(d) and 4(e)]. From the SEM images can see that the black dot in the optical microstructure is composed of many rod-like particles, with lengths varying from few hundreds to few thousands nanometers. In addition, the EDS result (Table II) shows that rod-like phases are rich in Zr and Zn. There are many researches focusing on rod-like Zr- and Zn-riched intermetallic phases in Mg alloys containing both Zr and Zn. Gao et al. Reference Gao, Muddle and Nie33 characterized the rod-shaped Zr–Zn particles in Mg–1Ca–1Zn–1Zr (wt%) after solution treatment at 753 K with a tetragonal crystal structure similar to that of Zn2Zr3 (P42/mnm, a = 0.768 nm, c = 0.699 nm). Sha et al. Reference Sha, Zhu, Liu, Luo, Liu and Ringer34 found that the composition of Zr–Zn intermetallic rods in Mg–6Zn–0.6Zr–0.5Cu alloy (wt%) is Zn3(Zr1−x , Mg x )2, rather than Zn2Zr3. Moreover, the precipitation of the β′ phases in Zr-rich cores of the Mg alloy involved two different mechanisms: (i) the decomposition of Zn3(Zr1−x , Mg x )2 rod particles to form composite precipitates consisting of the β′ phases (Zn3Mg2) and Zr-rich hydrides and (ii) the decomposition of the supersaturated Mg matrix to form Zn3Mg2. And the formation of Zr–Zn rod particles had no influence on the volume fraction of β′ precipitates formed in the alloy, but the particles could determine the number density of β′ precipitates in the Zr-rich cores via heterogeneous nucleation. To increase the number density of β′ precipitates, it is important to control the number density of Zr–Zn rod particles formed during solution treatment.
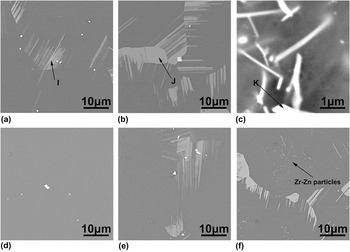
Backscattered SEM images and corresponding EDS results of the as-quenched 0.5Zn, 1.5Zn alloys and rod-like particle are shown in Figs. 5(a)–5(c) and Table II. As shown in Figs. 5(a) and 5(b), the undissolved eutectics of lager size together with planar feature interspersed among eutectics are observed. According to the EDS results (Table II) and XRD patterns [Fig. 2(b)], the planar feature is X phase, which is in accordance with the gray area (Location H) in Fig. 3(c). Similar findings were obtained in Mg-RE–Zn alloys Reference Zhang, Liu, Gu, Lu, Yuan and Ding16 that the planar feature (X phase) was determined to be 14H precipitate phase which is associated with Shockley partial dislocations formed during solution treatment. The 18R LPSO structure in the as-cast alloy is not thermodynamically stable and gradually replaced by 14H LPSO structure during solution treatment. Reference Zhu, Morton and Nie21 Wu et al. Reference Wu, Peng, Zeng, Lin and Ding35 reported that the X phase derived from two variant ways: i.e., the formation within matrix and the phase transformation from eutectic compounds to X phase in grain boundaries. Zhang et al. also Reference Zhang, Liu, Gu, Lu, Yuan and Ding16,Reference Zhang, Yuan, Lu and Ding18 suggested that the X phase may transform from (Mg, Zn)3RE phase and the formation of X phase in the Mg–Gd–Y–Zn–Zr alloy is affected by both RE and Zn contents and the solid solution treatment (i.e., the solution temperature and time). Datta et al. Reference Datta, Waghmare and Ramamurty36 reported that the energy of the 14H LSPO structure is fairly close to that of the hcp structure, indicating that 14H LPSO is a very stable structure. In this study, the X phase is firstly detected in the as-cast 1.0Zn and 1.5Zn alloys, and then found in 0.5Zn, 1.0Zn, and 1.5Zn alloys after solution treatment. This perfectly illustrates that the X phase is thermal stable.
SEM images of the as-quenched alloys: (a) 0.5Zn; (b) 1.5Zn; (c) rod-like particles and peak-aged alloys: (d) 0Zn; (e) 0.5Zn; (f) 1.5Zn.

Average grain sizes of the as-quenched 0Zn, 0.2Zn, 0.5Zn, 1.0Zn, and 1.5Zn alloys are 47.8, 44.8, 42.2, 39.5, and 36.2 μm, respectively. With increasing Zn content, grain sizes decline from 47.8 to 36.2 μm. Comparing with the grain sizes of the as-cast alloys, the average grain sizes of the as-quenched alloys exhibit an increment from +8 to +18 µm, which indicates that higher Zn content alloy has a better thermal stability of grain size. Namely, its ability to prevent grain growth during the solution treatment is stronger than that of the lower Zn-content alloy. This may be the pining effect of the residual secondary eutectic phase on grain boundary migration during solution treatment. Reference Liu, Chen and Han30
C. Age hardening behavior
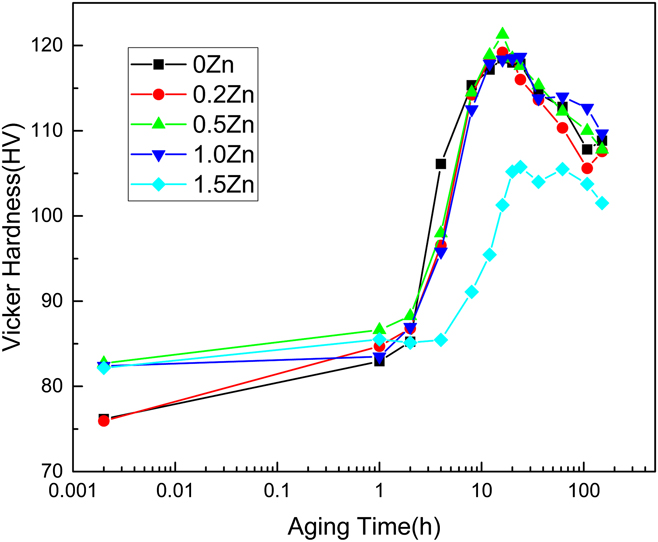
Figure 6 shows the age hardening curves of the solution treated alloys isothermally aged at 498 K for different hours. The substantial hardening during aging in all specimens begins after an incubation period of 2–4 h when the hardness increases slightly, and then the hardness increases rapidly. The highest hardness values are obtained after 16 h for 0Zn, 0.2Zn, 0.5Zn, and 1.0Zn alloys, and the maximum hardness values are 118.5, 119.2, 121.3, and 118.3 HV, respectively. Meanwhile, for the as-quenched 1.5Zn alloy, the specimen aged at 498 K exhibits the lowest peak hardness, the slowest increase in hardness and the longest time to peak (∼20 h), with maximum value of 105.2 HV. He et al. Reference He, Zeng, Peng, Gao, Nie and Ding5 suggested that in a very early stage of aging, fine β″ precipitates formed, which is mainly responsible for the small increase in the age hardness in the incubation period. Continued aging leads to the formation of β′ precipitates. The size and volume fraction of the β′ precipitates increase with the prolonging of the aging time, and this may be attributed to the gradual increase in the age hardness before peak aging is reached. In the peak-aging condition, the microstructure contains predominantly β′ precipitates. It has been well studied Reference He, Zeng, Peng, Gao, Nie and Ding6,Reference Liu, Chen and Han30 that the oval-shaped β′ precipitates, which form on the prismatic planes of the matrix in a dense triangular arrangement during age treatment, are the most effective strengthening phase of Mg-RE and Mg-RE–Zn alloys. In the process of over aging, the β′ precipitates coarsen and the β1 phases precipitate. Long-term aging leads to the formation of coarse equilibrium β phases, and this is the cause of the significant decrease in the aging hardness. In addition, the volume fraction of the LPSO structure increases with increasing Zn content, resulting in the decrement of RE content in the matrix and little age hardening response in 1.5Zn alloy. Reference Liu, Zhang, Su, Tang, Rokhlin, Elkin and Meng20
Hardening curves of the alloys isothermally aged at 498 K for various time.

Microstructures of all five aged alloys are similar to that of the solution treated alloys and the grain size does not change obviously during aging. SEM images of peak-aged 0Zn, 0.5Zn, and 1.5Zn alloys are shown in Figs. 5(d)–5(f). Cuboid-shaped phases, X phases, and Zr–Zn rod particles persist during subsequent aging, which shows that they are thermal stable during aging heat treatment.
D. Mechanical properties
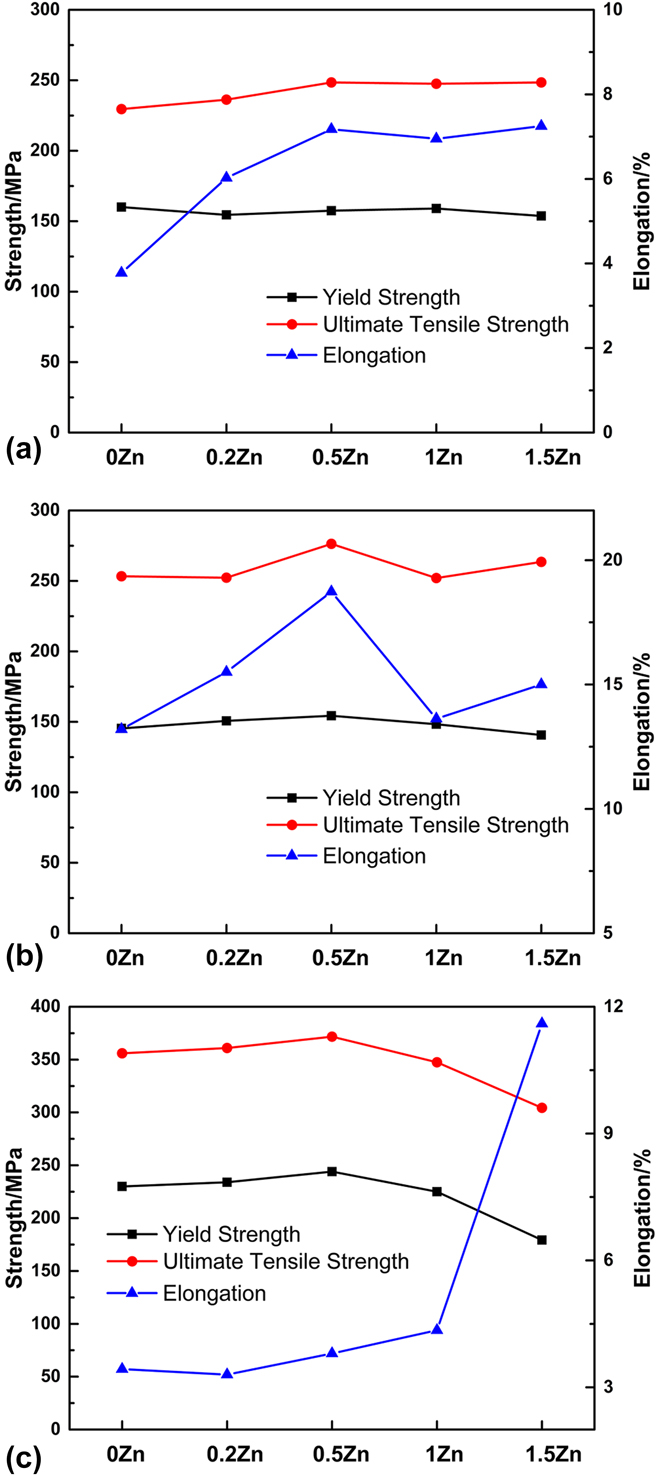
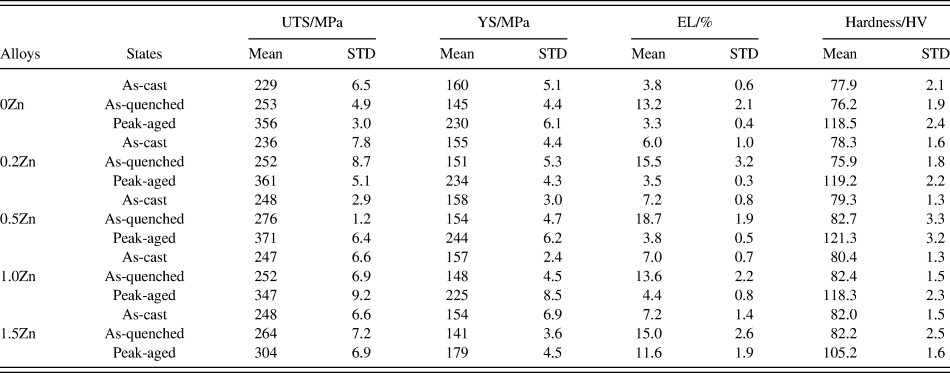
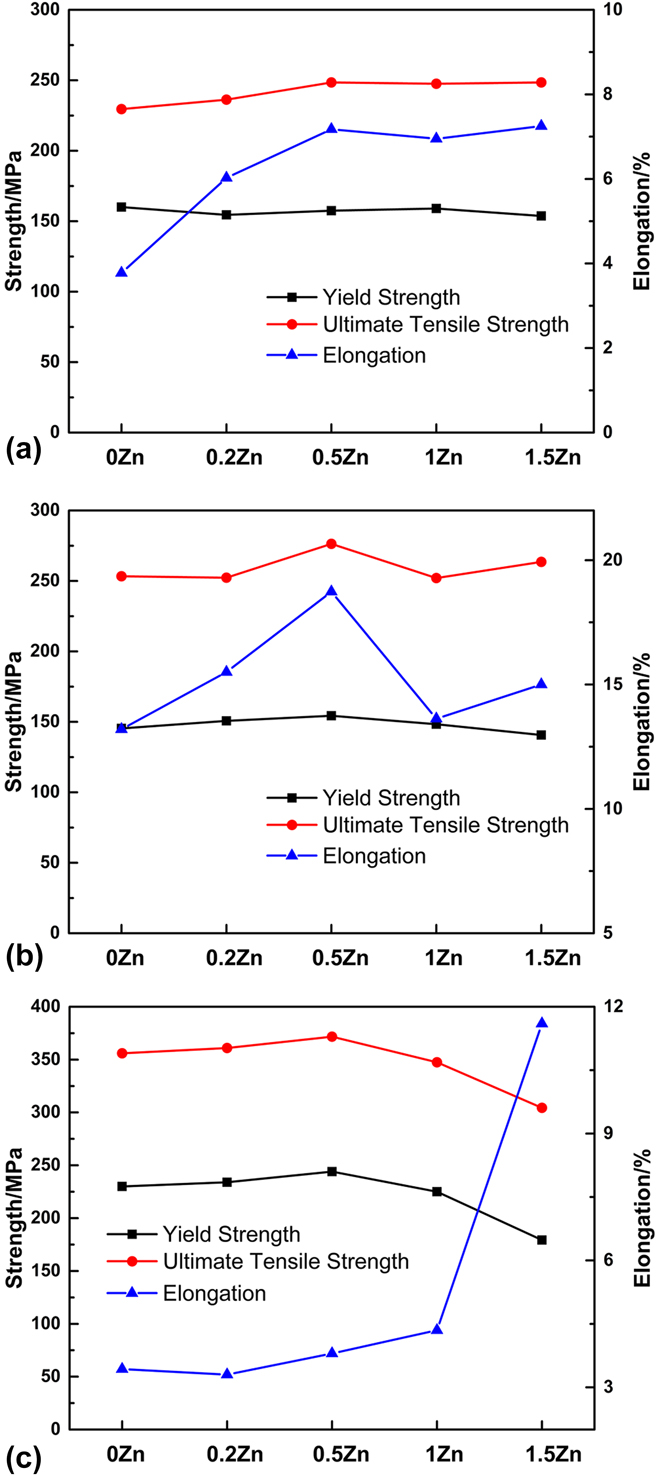
A comparison of the mechanical properties of all five alloys in different thermal conditions is presented in Fig. 7 and Table III. It can be seen that yield strength (YS) of the as-cast alloys with different content of Zn is comparable at 154–160 MPa, while the ultimate tensile strength (UTS) and elongation (EL) increase with raising the Zn content from 0 to 0.5%. Keep increasing Zn content from 0.5 to 1.5%, the UTS and EL remain nearly constant with values of ∼248 MPa and ∼7%, respectively. Meanwhile, the hardness shows a slight increment from 77.9 to 82 HV with increasing the Zn content. As mentioned above, with increasing the Zn content in the as-cast alloys, the volume fraction of the LPSO structure increases [see Figs. 1(f), 1(h), and 1(j)]. In addition, eutectics in the 0Zn and 0.2Zn alloys are coarser than the other three alloys (see Fig. 1). Hence, a balanced combination of the LPSO structure and fine eutectics explains why the alloys (Zn content ≥0.5%) own both higher strength and ductility.
Tensile properties of the alloys: (a) as-cast; (b) as-quenched; (c) peak-aged.
Mechanical properties of the alloys under different thermal conditions.

STD refers to the standard deviation from the mean value.
The microstructures of different thermal conditions contribute to different mechanical properties. To analyze the relationship between microstructures and mechanical properties, four contributions to the YS above that of pure Mg, designated as σMg, can be identified traditionally for the alloys under different thermal conditions. They are grain boundary strengthening (σgb), second phase (eutectic compounds) strengthening (σsp), solid solution strengthening (σss), and precipitation strengthening (σppt). Other potential sources of strengthening include cuboid-shaped particles and Zr cores, which are all observed to exist as relatively large particles. The volume fractions of these two large particles are likely less than 5% in each case, therefore, strengthening by these particles is expected to be small. For the as-cast alloys, there is no precipitation strengthening. And the solid solution strengthening can be ignored because of the low content of the solid solution atom in α-Mg matrix. Therefore, the YS magnitude of the as-cast alloys consists of three parts as:
 $${\sigma _{{\rm{ys}}}} = {\sigma _{{\rm{Mg}}}} + {\sigma _{{\rm{gb}}}} + {\sigma _{{\rm{sp}}}}\quad ,$$
where σMg (the YS of pure Mg) is 21 MPa, Reference He, Zeng, Peng, Gao, Nie and Ding6 and that of Mg–(0.4–1.0 wt%)Zr, whose grain size is estimated to be 30–40 µm according to the soluble Zr content, is elevated to be 55 MPa by Zr refinement. Reference He, Zeng, Peng, Gao, Nie and Ding6 Because of the similar grain size of ∼30 µm in all five as-cast alloys, the value of 55 MPa is reasonable. Thus, for rough estimate, the grain boundary strengthening contribution in as-cast alloys is estimated to be 55–21 = 34 MPa. YS (σys) of the as-cast 0Zn, 0.2Zn, 0.5Zn, 1.0Zn, and 1.5Zn alloys are 160, 155, 158, 157, and 154 MPa, respectively, as shown in Table III. Therefore, the σsp are approximately 105, 100, 103, 102, and 99 MPa for the as-cast 0Zn, 0.2Zn, 0.5Zn, 1.0Zn, and 1.5Zn alloys, and accounting for 65.6, 64.5, 65.2, 65.0, and 64.3% of the total YS, respectively. During the tensile test, the micro cracks are formed by the fracture of eutectic compounds. Thus, the as-cast alloys show the lowest EL and UTS compared to the as-quenched and peak-aged alloys (see Table III).
After solution treatment, YS is lower compared with that of the as-cast alloys and larger average grain sizes bring about this change. In the meantime, EL is greatly enhanced by solution treatment compared with that of the as-cast alloys. As the volume fraction of eutectics of as-quenched alloys is less than those of the as-cast alloys and the grain interior is strengthened by solid atoms, there would be more resistance for the cracks to across the grains. Therefore, the as-quenched alloys show higher EL. YS, UTS, and EL of the as-quenched alloys show an increment with raising Zn content from 0 to 0.5%, but decreases when raising Zn content from 0.5 to 1.5%. YS, UTS, and EL of the 0.5Zn alloy are 9 MPa, 21 MPa and 5.5% higher than those of the 0Zn alloy, while 13 MPa, 13 MPa and 3.5% higher than those of 1.5Zn alloy. The finer grains and undissolved phases are responsible for such trend. On the one hand, the 0.5Zn alloy shows smaller average grain size than that of 0Zn and 0.2Zn alloys. On the other hand, in spite of smaller grain sizes compared with 0.5Zn alloy, the 1.0Zn and 1.5Zn alloys have more X phase (see Fig. 5), which is generated during solution treatment at grain boundaries. X phase act as the source of crack, and the stress concentration caused by it under tensile load makes the alloy own relatively poor strength and ductility.
YS and UTS of the alloys with Zn content ≤1.0% are enhanced accompanied by a significant decrease of EL after age-treated at 498 K, while the 1.5Zn alloy shows a less obvious change. In peak-aged condition, the YS and UTS show the similar trend with that of the as-quenched alloys, and the EL increases from 3.3% to 11.6% with raising Zn content. The 0.5Zn alloy exhibits a desirable combination of strength and elongation with 244 MPa in YS, 371 MPa in UTS and 3.8% in EL, which are 14 MPa, 15 MPa, and 0.5% higher than those of the 0Zn alloy. The 1.5Zn alloy has a higher EL of 11.6% than that of 0.5Zn alloy, however, the YS and UTS are 44 MPa and 67 MPa lower, respectively. Abundant thermal stable X phases in the 1.5Zn alloy make the supersaturated solid solution of α-Mg have a lower RE content and the amount of precipitates is reduced.
Considering that Mg–Gd–Y–Zr alloys are typical solid solution strengthening and precipitation hardening Mg alloys, a high YS and UTS can be obtained provided that appropriate solution treatment and artificial aging are performed. Reference He, Zeng, Peng, Gao, Nie and Ding6 Therefore, solid solution strengthening and precipitation hardening are important mechanisms through which the peak-aged alloys show excellent mechanical properties compared with the as-cast and as-quenched alloys. He et al. Reference He, Zeng, Peng, Gao, Nie and Ding6 suggested that precipitation strengthening was the largest contributor to the strength in peak-aged condition, and the remarkable precipitation strengthening was attributable to plate-shaped precipitate phases formed on prismatic planes of α-Mg matrix phase. And the plate-shaped precipitates were vertical to basal plane of α-Mg and extremely thermal stable at 523 K. Honma et al. Reference Honma, Ohkubo, Kamado and Hono14,Reference Liu, Zhang, Su, Tang, Rokhlin, Elkin and Meng20 found that the number density of β′ precipitates decreased by the addition of Zn, and the Zn addition had an effect on improving the EL at the expense of strength. Moreover, it has revealed Reference Gao, Muddle and Nie33 that the formation of the rod-shaped Zr–Zn particles might consume some Zn solute atoms in the solid solution, and therefore reduce the Zn content available for the precipitation of strengthening phases. As a result, the precipitation process during artificial aging might be influenced, and the age hardening response may be reduced for such alloys. In addition, it is believed that X phase is able to pin the grain-boundary sliding and strengthen the boundaries effectively. Reference Yamada, Okubo, Shiono, Watanabe, Kamado and Kojima24 Suzuki et al. Reference Suzuki, Kimura, Koike and Maruyama37 also suggested that the strengthening effect of Zn might be due to the decrease in stacking fault energy and consequent reduction of the mobility of dislocations. Therefore, a balanced combination of finer grains, β′ precipitates and X phase explains why the peak-aged 0.5Zn alloy exhibit desirable mechanical properties.
E. Fracture behavior
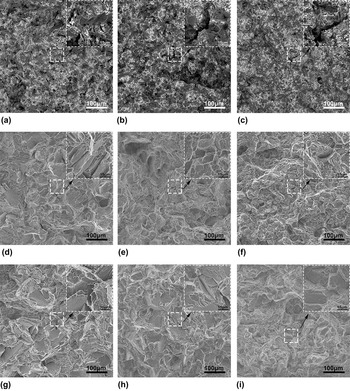
Figure 8 shows the secondary electron and back scattered electron SEM micrographs of the fracture surfaces of the alloys under as-cast, as-quenched and peak-aged conditions, taking the 0Zn, 0.5Zn, and 1.5Zn alloys for instance. In the as-cast alloys, the fracture surfaces are composed of tear ridges and fractured eutectics, which are in accordance with its limited EL (less than 7.2%). Eutectics rich in RE show brighter contrast in back scattered electron images, which are presented in Figs. 8(a)–8(c), and there are many micro cracks in eutectics. On the fracture surfaces and around the secondary crack scatter many cuboid-shaped particles with around 1 µm in size, illustrating that the micro cracks may form here. Reference Zhang, Fan, Zhang, Wu, Liu, Cui and Feng12 In addition, the proportions of tear ridges in the 0.5Zn and 1.5Zn alloys are higher than that of the 0Zn alloy, which is in accordance with the value of elongation presented in Fig. 7 and Table III.
SEM images of fracture surfaces of the alloys: (a, b, and c) as-cast 0Zn, 0.5Zn and 1.5Zn alloys; (d, e, and f) as-quenched 0Zn, 0.5Zn, and 1.5Zn alloys; (g, h, and i) peak-aged 0Zn, 0.5Zn, and 1.5Zn alloys.

When the alloys are subjected to solution treatment, the fracture surfaces of all alloys are similar and are composed of ductile transgranular cleavage planes of coarse dimples (river pattern) and tear ridges [Figs. 8(d)–8(f)], which are in accordance with its high elongation of ∼15%. Besides, secondary cracks mainly locate inside the grains and the cracks probably initiate at the grain interiors and propagate transgranularly, suggesting a transgranular cleavage fracture mode. Reference Gao, Chen and Han38 The appearance of plenty of densely distributed tear ridges indicates good ductility compared to the as-cast alloys.
After being peak-aged at 498 K, the grain interior is strengthened by coherent β′ phase Reference He, Zeng, Peng, Gao, Nie and Ding6,Reference Honma, Ohkubo, Kamado and Hono14 and the fracture surfaces are characterized by cleavage planes and grain boundaries in 0Zn and 0.5Zn alloys, which are presented in Figs. 8(g) and 8(h). As the collaboration effects of precipitates inside the grains and at the grain boundaries have the tendency to reduce the cohesive strength of the grain boundaries, which make the grain boundaries a favorable path for crack propagation. Moreover, the fracture surface of the 0Zn alloy appears to have more cleavage planes and fewer tear ridges than the 0.5Zn alloy, which is also approved by the difference between the elongation as shown in Fig. 7 and Table III. It indicates that both 0Zn and 0.5Zn alloys under peak-aged condition show a quasi-cleavage fracture. Reference Zhang, Fan, Zhang, Wu, Liu, Cui and Feng12 For 1.5Zn alloy, the fracture surface with few cleavage planes and abundant tear ridges is similar to that of the as-quenched 1.5Zn alloy, showing a transgranular cleavage fracture mode.
IV. CONCLUSIONS
The effect of Zn content (0, 0.2, 0.5, 1.0, 1.5 wt%) on microstructure, mechanical properties and fracture behavior of the Mg–9Gd–3Y–0.5Zr alloys under as-cast, as-quenched, and peak-aged conditions was investigated. The following conclusions can be obtained:
-
(1) The as-cast alloys are comprised of α-Mg matrix, island-like eutectic compounds and cuboid-shaped phases. The eutectics are Mg24(Gd, Y)5 in the as-cast 0Zn and 0.2Zn alloys, while (Mg, Zn)3RE in 0.5Zn, 1.0Zn, and 1.5Zn alloys. In addition, lamellar-shaped LPSO structure is found to be inside α-Mg grains of the as-cast alloys (Zn content >0.2%) and its quantity increases with raising Zn content.
-
(2) In the Mg–9Gd–3Y–0.5Zr alloys with Zn content ≥0.5%, X phase is observed at grain boundaries of the Mg matrix after solution treatment. Moreover, average grain size increases with increasing the Zn content after solution treatment.
-
(3) In the peak-aged addition, YS, UTS of the alloys increase with raising Zn content from 0 to 0.5%, while decrease when raising Zn content from 0.5 to 1.5%. Meanwhile, the EL changes from 3.3 to 11.6% with increasing Zn content from 0 to 1.5%. And Mg–9Gd–3Y–0.5Zn–0.5Zr alloy exhibit a desirable combination of strength and elongation with 244 MPa in YS, 371 MPa in UTS and 3.8% in EL, which are 14 MPa, 15 MPa, and 0.5% higher than those of the 0Zn alloy.
-
(4) In the as-cast alloys, the fracture surfaces are composed of tear ridges and fractured eutectics. After solution treatment, all the alloys present a transgranular cleavage fracture mode. Peak-aged alloys (Zn content ≤1.0%) show a total different fracture behavior with a quasi-cleavage fracture compared with the as-quenched alloys, while 1.5Zn alloy remain unchanged.
ACKNOWLEDGMENTS
This work is supported by National Key Research and Development Program of China (No. 2016YFB0701205), National Natural Science Foundation of China (No. 51771115), Science Innovation Foundation of Shanghai Academy of Spaceflight Technology (Nos. SAST2015047 and SAST2016048), and Research Program of Joint Research Center of Advanced Spaceflight Technologies (Nos. USCAST2015-25 and USCAST2016-18).