1. Introduction
Real and financial shocks have been of varying importance in the past decades in the USA. The significance of real, that is, non-financial, shocks in economic fluctuations is well documented in the vast corpus of literature regarding Real Business Cycles (RBC) models. On the other hand, financial shocks were a central component of at least two of the last four recessions in the USA, the 1990–1991 recession and the 2008 Great Recession. However, in recent years, financial factors have come under increasing control due to the strict financial regulations that were implemented after the 2008 crisis [Financial-Stability-Reports (2018) and Reports (Reference Reports2019)]. The impact of these regulations can be seen, for example, in Figure 1 which presents the National Financial Conditions Leverage Subindex (NFCILEVERAGE). The financial condition was looser before the crisis, it got tighter during the crisis, and after the crisis it was kept around the average.
National Financial Conditions Leverage Subindex (NFCILEVERAGE). “Positive values indicate financial conditions that are tighter than average, while negative values indicate financial conditions that are looser than average.” Source: Federal Reserve Bank of Chicago.

Since the crisis, a host of dynamic equilibrium models focused either on the role of the financial sector in propagating shocks that originate elsewhere or on financial and non-financial shocks individually. Although there are merits to such approaches for building intuition, they fall short of offering a full analysis of key factors in business fluctuations, especially at the onset of a crisis when numerous sets of shocks aggravate each other. As a result, the weight of perturbations that originate directly in the financial sector or the interaction between financial and non-financial shocks in building up business cycle fluctuations, as investigated in the works of Jermann and Quadrini (Reference Jermann and Quadrini2012) for example, has been less widely explored.
This paper aims to fill this gap by addressing the following key questions: (
 $i)$
what have been the contributions of financial and non-financial shocks to business cycles before, during, and after the 2008 financial crisis (up to 2019)? (
 $ii)$
what is the role of the quality of financial capital adequacy constraints in business cycles? (
 $iii)$
what are the optimal macroprudential policies based on a welfare analysis to mitigate financial risks?
To answer these questions, this paper develops a model based on Alpanda and Zubairy (Reference Alpanda and Zubairy2016) by introducing financial intermediary agents to the lender–borrower relationship. The model features five types of agents: a heterogeneous household sector (lender, borrower, and renter), financial sector (banker), government, housing, and good producers. Then, US data from 1990Q1 to 2019Q2 and Bayesian methods are used to estimate the model and simulate the behavior of the economy. Both financial and non-financial shocks are investigated in this paper: TFP, consumption preference, housing demand, investment, borrowing ability of households (LTV), and lastly, a new shock into the literature, the shock to the inertia in the capital adequacy constraint of financial intermediaries.
The model choice is based on the following considerations. The specified general equilibrium aspect of the model of this paper offers a more precise analysis of the macroeconomic responses to shocks.Footnote 1 Heterogeneity in the household sector leads to the existence of the credit market which is one of the main channels in propagating financial shocks. In adherence to US regulation, this paper applies a collateral constraint to restrict borrower households in the credit market through a LTV ratio set by the authorities.Footnote 2 Heterogeneity in the household sector in this paper features three different households which interact in housing and credit markets. The model therefore mirrors the stylized fact of the presence of lenders, borrowers, and renters in reality without making it an endogenous decision, which in turn, provides the possibility of assessing various shocks and related channels especially in the housing market.
The existence of a financial sector leads to following features. First, it provides the possibility of transferring resources across agents over time. Second, the existence of a financial sector makes it possible to study financial channels as banks are engaged in both deposit and credit markets. In this paper as in reality, the financial sector faces a capital adequacy constraint when obtaining deposits.Footnote 3 This modeling provides simple, intuitive arrangements to carefully assess the role of capital adequacy constraint. One avenue for this assessment is through the introduction of a new financial shock into the literature, in the form of a shock to the inertia of the capital adequacy constraint which impacts the ability of the financial sector to partially deviate from the leverage ratio targets, set by the authorities, beyond one period. The financial sector modeling of this paper is standard and widely used in the literature, for example, Iacoviello (Reference Iacoviello2015) and Rubio (Reference Rubio2020).Footnote 4
The paper finds that the main drivers of output boom and bust before and during the crisis were the housing demand and investment shocks which have continued to play an important part in the pre-COVID crisis growth. The estimation results indicate that the non-financial shocks have made the biggest contribution to aggregate output growth in recent years, while the financial shocks were preeminent during the 2008 crisis. The results confirm that the shock to the capital adequacy constraint plays an important role in the financial accelerator by changing bank’s leverage decisions from an exogenous regulatory target to an endogenous financial problem. In the 2008 crisis, this occurred firstly through lax financial conditions due to weaker market disciplines among bank shareholders or debilitated effective regulations [Malherbe (Reference Malherbe2020)] during the boom time which triggers arise for leveraged investment, and secondly through the increase in housing demands which incentivize financial agents in heating up the mortgage market by increasing liabilities. The increase in both housing supply and demand stimulates the housing market and accelerates financial shocks through housing channels exposing both the real and financial sectors to shocks. The results indicate that even though the shock to the capital adequacy constraint is not driving output, it does steer much of the behavior of interest spreads.
The impact of macoprudential policies on the economy and welfare are another focus of this paper. This analysis is achieved assessing the welfare effects of different macroprudential policies when applied alone or together. To do so, two forms and three types of macroprudential policy tools as well as two policy mixes are investigated. The first form is a macroprudential policy on financial capital constraint, represented by the liabilities-to-assets (LTA) ratio.Footnote 5 The second form concerns the borrower’s constraint, which is governed by two policies, the loan-to-value (LTV) ratio and the cap on the debt-to-income (DTI) ratio [inspired by the model of Gelain et al. (Reference Gelain, Lansing and Mendicino2013)]. Both policies affect the borrowing ability of households; the LTV by balancing between mortgages and house values, and the DTI by associating mortgages with household incomes. The welfare changes are computed following Rubio and Carrasco-Gallego (Reference Rubio and Carrasco-Gallego2014) by comparing the simulation of the model based on the estimation results without any macroprudential policy to the counterfactual model where model parameters are set to their estimated values and macroprudential tools are active.
The results of this paper indicate that macroprudential policies on capital and credit constraints impact welfare in different ways. The paper finds that macroprudential policies which control the credit market, that is, LTV and DTI, create a welfare trade-off between households. This occurs through the housing market. As a result, social/total welfare stays neutral. On the other hand, the findings illustrate that social welfare increases with a higher LTA. A higher LTA relaxes the capital constraint and makes more mortgages available for households at a lower price. Households are consequently better off.Footnote 6
This paper suggests that there are sets of macroprudential policy mixes, including LTA-LTV and LTA-DTI, in which there is no impact on social welfare. These policies are important for policy-makers in their attempts to balance/stabilize the economy based on policy/social interests without changing total welfare. In addition, this paper provides a theoretical background which supports known empirical results. By simulating the behavior of the economy in the presence of macroprudential policies, the paper confirms the empirical assertion by Claessens et al. (Reference Claessens, Ghosh and Mihet2013) that macroprudential tools are time-inconsistent, that is, a tool that is efficient in boom periods may slow down economic recovery during a recession.
1.1. Literature review
This paper fuses various strands of the literature including crisis, housing, banking, and macroprudential policies. To the best of my knowledge, this paper is one of the first to assess the quality of the financial capital adequacy constraint. Gerali et al. (Reference Gerali, Neri, Sessa and Signoretti2010), Brunnermeier and Sannikov (Reference Brunnermeier and Sannikov2014), Gersbach et al. (Reference Gersbach, Rochet and Scheffel2015), Gertler and Kiyotaki (Reference Gertler and Kiyotaki2015), and Queralto (Reference Queralto2020) to name but a few conduct their analysis based on the intermediary role of the financial sector between savers and borrowers in order to identify the origin of financial crisis and the role of financial disrupts. However, none of these papers study the quality of the financial capital adequacy constraint and its interactions with real and financial sectors in an estimated general equilibrium model.
The idiosyncratic financial and non-financial shocks are mostly studied separately in the literature. Chugh (Reference Chugh2013) examines external financial frictions; Rubio (Reference Rubio2011) studies the financial shocks through the mortgage market and Ghiaie (Reference Ghiaie2020) investigates the impacts of real shocks on the financial market. In the current paper, the financial and non-financial shocks are studied and estimated simultaneously for the purpose of capturing the interdependence between agents and markets.
This paper contributes to the housing literature, for example, Ge et al. (Reference Ge, Li and Zheng2020) and Rubio (Reference Rubio2014), by casting light upon hitherto ignored areas, such as the interdependencies between housing and both the financial sector and macroprudential policies.
Maroprudential policies have been widely studied, for example in Rubio and Carrasco-Gallego (Reference Rubio and Carrasco-Gallego2014), Tomuleasa (Reference Tomuleasa2015), Angelini et al. (Reference Angelini, Clerc, Cúrdia, Gambacorta, Gerali, Locarno, Motto, Roeger, Van den Heuvel and andVlcek2015) and Kahou and Lehar (Reference Kahou and Lehar2017), but most contributions remain silent about the welfare impacts of macroprudential policies when they are in effect together (policy mixes). The current paper not only assesses the mechanisms through which macroprudential policies impact the economy when applied individually or together but also divulges the optimal macroprudential policies which increase welfare.
Finally, this paper complements studies on the effect of financial and real frictions on business cycle fluctuations, for example, Mumtaz and Zanetti (Reference Mumtaz and Zanetti2016) and Zanetti (Reference Zanetti2019) which evaluate business cycles with an emphasis on the role of labor market search frictions, by including micro-founded real and financial sectors to address the potential interconnectedness of financial and non-financial channels going through households’ and banks’ balance sheets.
This paper is organized as follows: The next section presents the model. Section 3 estimates the parameters and describes the results of the estimation, impulse response function (IRF) response analysis, channels, and mechanisms. Section 4 outlines the impact of different macroprudential policies and their welfare analysis. Section 5 offers a conclusion on the findings of this paper.
2. Model
Superscripts
 $P,I,R$
stand for Patient (lender), Impatient (borrower), Renter households, respectively, and
 $B$
for Bankers (financial intermediary agents). The households’ problem are standard and follow Alpanda and Zubairy (Reference Alpanda and Zubairy2016). There is a unit measure of each type of infinitely lived household. The model is real, and thus all prices in the economy are relative prices, with the price of consumption serving as numeraire.
2.1 Household
2.1.1 Patient (lender) households
The patient households’ problem is
 \begin{align} \max _{c^P_t,d_t, h^P_t,l^P_t} E_t&\sum _{\tau =t}^\infty \beta ^{\tau -t}_P\left\{\varepsilon _{c\tau } \log c^P_\tau + \varphi ^P_h \varepsilon _{h\tau } \varepsilon _{c\tau } \log h^P_{\tau -1}-\varphi ^P_l \frac{(l^P_\tau )^{1+\iota }}{1+\iota }\right\}\nonumber \\[5pt] &s.t.\nonumber \\[5pt] &(1+\tau _c)c^P_t+p^h_t h^{Ph}_t+\frac{ i^k_t}{\varepsilon _{it}} + d_t\leq \omega ^P_t +\Gamma ^P_t -\tau ^P_t - AC^P_t\nonumber \\[5pt] h^{Ph}_t&=[h^P_t-(1-\delta _h)h^P_{t-1}]+[ h^R_t-(1-\delta _h)h^R_{t-1}]\nonumber \\[5pt] i^{k}_t&=k_t-(1-\delta _k)k_{t-1} \end{align}
 \begin{align*} \omega ^P_t&=w^P_t l^P_t+p^R_t h^R_t +(1+r_{t-1})d_{t-1}+r^k_t k_{t-1}\nonumber \\[5pt] \tau ^P_t&=\tau _w[w^P_tl^P_t+ p^R_t h^R_{t}]+\tau _p p^h_t (h^P_{t-1}+h^R_{t-1}) +\tau _d r_{t-1} d_{t-1}+\tau _k(r^k_t-\delta _k)k_{t-1} \end{align*}
where
 $t$
represents time.
 $0\lt \beta _P\lt 1$
is the discount factor of patient households.
 $\varphi ^P_h$
and
 $\varphi ^P_l$
represent the relative importance of housing and labor, respectively, for patient households in the utility function.
 $\iota$
is the inverse of the Frisch elasticity of labor supply. A representative patient household at time
 $t$
consumes
 $c^P_t$
, accumulates housing
 $h^{Ph}_t$
at relative price
 $p^h_t$
, supplies labor
 $l^P_t$
, saves deposit
 $d_t$
in the financial sector, and is the owner of capital
 $k_t$
. Capital is borrowed by firms in order to produce non-housing goods. After production, the undepreciated part of capital is returned to the household such that capital investment is
 $i^{k}_t$
. The patient household owns two types of houses: residential houses
 $h^P$
and rental houses
 $h^R$
.Footnote
7
The depreciation rates on housing and capital are
 $\delta _h$
and
 $\delta _k$
, respectively. To summarize, the patient household has four saving opportunities: residential housing, rental housing, capital, and deposits.
 $\varepsilon _{ct}$
is a shock to preferences for consumption and housing jointly, that is, aggregate spending shock.
 $\varepsilon _{ht}$
is a housing demand shock.
 $\varepsilon _{it}$
is an investment shock. These shocks will be explained in the estimation Section 3.
Total income
 $\omega ^P_t$
is composed of wage
 $w^P_t$
, rent from renters at price
 $p^R_t$
, and return on deposit and capital with interest rates
 $r_t$
and
 $r^k_t$
, respectively. The government transfer is
 $\Gamma ^P_t$
. Total tax paid by the patient household (apart from VAT)
 $\tau ^P_t$
comprises taxes on total income, property, and return on deposits and capital.
 $\tau _c$
is the tax on consumption (VAT),
 $\tau _w$
stands for the income tax rate,
 $\tau _p$
for the property tax rate,
 $\tau _d$
and
 $\tau _k$
for the tax rates on deposits and capital, respectively.
The last term in the budget constraint is the adjustment cost
 $AC^P = AC^{Pk}_t+AC^{Pd}_t + AC^{Ph}$
where
 $AC^{Pk}_t=\frac{\psi _{k}}{2}\frac{(k_t-k_{t-1})^2}{\overline{k}},AC^{Pd}_t=\frac{\psi _{dh}}{2 }\frac{(d_t-d_{t-1})^2}{\overline{d}}, AC^{Ph}_t=\frac{\psi _{hp}}{2}p^h_t \left[\frac{(h^P_t-h^P_{t-1})^2}{\overline{h}^P} + \frac{(h^R_t-h^R_{t-1})^2}{\overline{h}^R}\right]$
.
The First Order Conditions (FOCs) with respect to residential and rental houses, respectively, are
 \begin{align} \left(1+\frac{\partial AC^P_t}{\partial h^P_t}\right) p^h_t = \beta _P{E}_t\left[\frac{\varphi ^P_h \varepsilon _{ht} \varepsilon _{ct} }{\lambda ^P_t h^p_t}+\frac{\lambda ^P_{t+1}}{\lambda ^P_t}\left((1-\delta _h-\tau _p) p^h_{t+1}-\frac{\partial AC^P_{t+1}}{\partial h^P_{t}}\right)\right] \end{align}
 \begin{align} \left(1+\frac{\partial AC^P_t}{\partial h^R_t}\right) p^h_t-(1-\tau _w) p^R_{t} = \beta _P{E}_t\left[\frac{\lambda ^P_{t+1}}{\lambda ^P_t}\left((1-\delta _h-\tau _p) p^h_{t+1}-\frac{\partial AC^P_{t+1}}{\partial h^R_{t}}\right)\right] \end{align}
where
 $\lambda ^P_t$
is the Lagrange multiplier of the budget constraint at time
 $t$
.
The FOCs with respect to consumption, deposit, capital and labor, respectively, are
 \begin{align} (1+\tau _c) \lambda ^P_{t} = \frac{\varepsilon _{ct} }{c^P_t} \end{align}
 \begin{align} 1 =\beta _P{E}_t\left[\frac{\lambda ^P_{t+1}}{\lambda ^P_t}(1+(1-\tau _d) r_{t})\right] \end{align}
 \begin{align} \frac{1}{\varepsilon _{it}} +\frac{\partial AC^P_t}{\partial k_t} =\beta _P{E}_t\left[\frac{\lambda ^P_{t+1}}{ \lambda ^P_t}\left(\frac{1}{\varepsilon _{it+1} } (1-\delta _k) + (1-\tau _k) r^k_{t+1} + \tau _k \delta _k -\frac{\partial AC^P_{t+1}}{\partial k_{t}}\right)\right] \end{align}
 \begin{align} \varphi ^P_l (l^P_t)^\iota =\lambda ^P_t (1-\tau _w)w^P_t \end{align}
2.1.2 Impatient (borrower) households
The problem of impatient households is
 \begin{align} \max _{c^I_t,M_t, h^I_t,l^I_t} E_t & \sum _{\tau =t}^\infty \beta ^{\tau -t}_I\left\{\varepsilon _{c\tau }\log c^I_\tau +\varphi ^I_h \varepsilon _{h\tau } \varepsilon _{c\tau } \log h^I_{\tau -1}-\varphi ^I_l \frac{(l^I_\tau )^{1+\iota }}{1+\iota }\right\}\nonumber \\[5pt] &s.t.\nonumber \\[5pt] &(1+\tau _c)c^I_t+ p^h_{t} h^{Ih}_t +(1+r^b_{t-1})M_{t-1} \leq w^I_t l^I_t +M_t+\Gamma ^I_t-\tau ^I_t-AC^I_t\nonumber \\[5pt] h^{Ih}_t&=h^I_t-(1-\delta _h)h^I_{t-1}\nonumber \\[5pt] \tau ^I_t&=\tau _w\left[w^I_tl^I_t- r^b_{t-1}M_{t-1} \right]+\tau _p p^h_{t} h^I_{t-1}\nonumber \\[5pt] M_t&\leq \rho _m M_{t-1}+(1-\rho _m)\varepsilon _{mt} \theta p^h_{t} h^I_t \end{align}
 $\beta _I$
is the discount factor of impatient households. Impatient households at time
 $t$
consume
 $c^I_t$
, accumulate housing
 $h^I_t$
, can request a mortgage
 $M_t$
at rate
 $r^b_t$
from the financial sector and receive total income
 $\omega ^I_t$
for providing labor
 $l^I_t$
with wage
 $w_t$
, and get transfers
 $\Gamma ^I_t$
from the government.
 $h^{Ih}_t$
is impatient housing investment. Total tax paid by the borrower,
 $\tau ^I_t$
, is composed of income and property taxes.
 $AC^I$
is the adjustment cost on mortgages and housing where
 $AC^I_t=\frac{\psi _m}{2}\frac{(M_t-M_{t-1})^2}{\overline{M}} + \frac{\psi _{hi}}{2}p^h_t\frac{(h^I_t-h^I_{t-1})^2}{\overline{h}^I}$
. The last equation in the impatient problem (2.8) is the borrowing constraint. The borrowing constraint is standard and used in the literature, for example, in Justiniano et al. (Reference Justiniano, Primiceri and Tambalotti2015), Alpanda and Zubairy (Reference Alpanda and Zubairy2016) and Alpanda and Zubairy (Reference Alpanda and Zubairy2017). This constraint restricts the impatient household mortgage to a fraction of its housing value.
 $\theta$
is the LTV ratio in housing and
 $\rho _m$
captures the persistence in the borrowing constraint and the fact that in practice, borrowing limits are not readjust every quarter [Iacoviello (Reference Iacoviello2015)]. This friction is a channel which connects the real economy to the financial side.
 $\varepsilon _{mt}$
is a shock to the LTV and so to the borrowing ability of the household.
The first-order conditions with respect to consumption, impatient households, mortgages and labor, respectively, are
 \begin{align} (1+\tau _c) \lambda ^I_{t} = \frac{\varepsilon _{ct} }{c^I_t} \end{align}
 \begin{align} p^h_{t}-\frac{\lambda ^m_t}{\lambda ^I_t}(1-\rho _m)\varepsilon _{mt} \theta p^h_t +\frac{\partial AC^I_t}{\partial h^I_t}=\beta _I{E}_t\left[\frac{\varphi ^I_h \varepsilon _{ht} \varepsilon _{ct}}{\lambda ^I_t h^I_t}+\frac{\lambda ^I_{t+1}}{\lambda ^I_t}\left((1-\delta _h-\tau _p)p^h_{t+1}-\frac{\partial AC^I_{t+1}}{\partial h^I_{t}}\right)\right] \end{align}
 \begin{align} 1-\frac{\lambda ^m_t}{\lambda ^I_t} +\frac{\partial AC^I_t}{\partial M_t}=\beta _I{E}_t\left[\frac{\lambda ^I_{t+1}}{\lambda ^I_t}\left(1+(1- \tau _w)r^b_{t}-\frac{\partial AC^I_{t+1}}{\partial M_{t}}\right)-\frac{\lambda ^m_{t+1}}{\lambda ^I_t}\rho _m\right] \end{align}
 \begin{align} \varphi ^I_l (l^I_t)^\iota =\lambda ^I_t (1-\tau _w)w^I_t \end{align}
where
 $\lambda ^I_t$
is the Lagrange multiplier of the budget constraint and
 $\lambda ^m_t$
is the Lagrange multiplier of the borrowing constraint at time
 $t$
.
2.1.3 Renter households
Renter households are hand-to-mouth and consume what they earn. Introducing renters enables us to monitor their behavior and thus obtain a comprehensive analysis of housing channels. Without renters, patient households have three ways of transferring their wealth, namely residential houses, capital, and deposits; the existence of renters opens up another transfer channel that can impact house prices and other macro-variables. The existence of three types of households is a convenient approximation to mimic the stylized fact of the presence of lenders, borrowers, and renters without making it an endogenous decision. The renters’ problem is
 \begin{align} \max _{c^R_t, h^R_t,l^R_t} E_t &\sum _{\tau =t}^\infty \beta ^{\tau -t}_R\left\{ \varepsilon _{c\tau }\log c^R_\tau +\varphi ^R_h \varepsilon _{h\tau } \varepsilon _{c\tau }\log h^R_{\tau -1}-\varphi ^R_l \frac{(l^R_\tau )^{1+\iota }}{1+\iota }\right\}\nonumber \\[5pt] &s.t.\nonumber \\[5pt] &(1+\tau _c)c^R_t+p^R_t h^R_{t}\leq (1-\tau _{wr})w^R_t l^R_t+\Gamma ^R_t \end{align}
 $\beta _R$
is the discount factor of renter households. A representative renter at the beginning of period
 $t$
consumes
 $c^R_t$
and rents a rental house
 $h^R_t$
at current price
 $p^R_t$
from the patient household. The renter receives utility in the next period (the end of period t) when changes his housing, which introduces a dynamic feature in the renter’s problem. Renters cannot smooth their consumption by borrowing and lending. The renter supplies labor
 $l^R_t$
to the economy and earns wage
 $w^R_t$
. Because their income level is low, the government charges a lower tax on their wages,
 $\tau _{wr}\lt \tau _w$
. Their income is made up of their wage and the government transfer
 $\Gamma ^R_t$
. The first-order conditions with respect to consumption, rental housing, and labor, respectively, are
 \begin{align} (1+\tau _c) \lambda ^R_{t} = \frac{\varepsilon _{ct} }{c^R_t} \end{align}
 \begin{align} p^R_t=\beta _R \frac{\varphi _h E_t [\varepsilon ^R_{ht+1} \varepsilon _{ct+1}]}{\lambda ^R_t h^R_{t}} \end{align}
 \begin{align} \varphi ^R_l (l^R_t)^\iota =\lambda ^R_t (1-\tau _{wr})w^R_t \end{align}
where
 $\lambda ^R_t$
is the Lagrange multiplier of the budget constraint at time
 $t$
.
2.2 Financial intermediary (banker)
A representative banker consumes and intermediates between other agents. The banker issues liabilities
 $d_t$
and assets
 $a_t$
. The borrowers are either households who borrow in the form of mortgages
 $M_t$
, or governmentFootnote
8
whose borrowings are termed government bonds
 $b^g_t$
. The banker’s utility function and budget constraint are
 \begin{align} &\max _{c^B_t,a_t, d_t} E_t \sum _{\tau =t}^\infty \beta _B^{\tau -t}\log c^B_\tau \nonumber \\[5pt] &(1+\tau _c) c^B_t+(1+r_{t-1})d_{t-1}+a_t+AC^B_t\leq d_t + (1+r^b_{t-1})a_{t-1} \nonumber \\[5pt] &a_t=b^g_t+M_t\nonumber \\[5pt] &a_t-d_t \leq \varepsilon _{bt}(a_{t-1}-d_{t-1})+ (1-\varepsilon _{bt}) (1-\overline{\phi }) a_t \end{align}
At time
 $t$
, the bank consumes
 $c^B_t$
, receives new deposits and the return on last-period loans, and pays the interest on its liabilities.
 $AC^B$
is the adjustment cost of issuing liabilities and assets where
 $AC^B_t=\frac{\psi _{a}}{2}\frac{(a_t-a_{t-1})^2}{\overline{a}}+\frac{\psi _{db}}{2}\frac{(d_t-d_{t-1})^2}{\overline{d}}$
.
 $\beta _B$
is the discount factor of bankers.
The last equation in the banker’s problem (2.17) is the capital constraint similar to Iacoviello (Reference Iacoviello2015) which limits the bank’s lending to a fraction of its liabilities.
 $\varepsilon _{bt}$
is a shock to the inertia in the capital adequacy constraint. This dynamic constraint provides the possibility of a deviation from the LTA ratio target
 $\overline{\phi }$
, set by the authorities, so the bank is able to partially adjust to the target beyond one period. To better understand the mechanism, one can divide the capital constraint in (2.17) by
 $a_t$
and use
 $\Phi _t \equiv 1-\phi _t= \frac{a_t-d_t}{a_t}$
as the definition of the capital-to-asset ratio. As a result, the capital-to-asset ratio
 $\Phi _t$
is
 \begin{align} \Phi _t = \varepsilon _{bt}\frac{a_{t-1}}{a_t}\Phi _{t-1}+ (1-\varepsilon _{bt}) \overline{\Phi } \end{align}
This equation indicates that if financial conditions impose
 $0\lt \varepsilon _{b}\leq 1$
, the capital-to-asset ratio is a function of asset and so it is an endogenous variable (as asset
 $a_t$
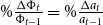
is endogenous). For example in the extreme case
 $\varepsilon _{b}= 1$
, the percentage change in the capital-to-asset ratio is exactly equal to the percentage change of assets, that is,
 $\%\frac{\Delta \Phi _t}{\Phi _{t-1}} = \%\frac{\Delta a_t}{a_{t-1}}$
. On the other hand, if the bank has to perfectly follow the regulation each period that is,
 $\varepsilon _{b}=0$
the leverage ratio is set to the regulation target
 $\overline{\phi }$
and so it is exogenous.
The first-order conditions with respect to consumption, liabilities, and assets, respectively, are
 \begin{align} (1+\tau _c) \lambda ^B_{t} = \frac{1 }{c^B_t} \end{align}
 \begin{align} 1 -\frac{\partial AC^B_t}{\partial d_t}=\frac{\lambda ^{\phi }_t}{\lambda ^B_t}+ \beta _B{E}_t \frac{\lambda ^B_{t+1}}{\lambda ^B_t} \left(1+r_{t}-\varepsilon _{bt+1} \frac{\lambda ^{\phi }_{t+1}}{\lambda ^B_{t+1}} + \frac{\partial AC^B_{t+1}}{\partial d_{t}}\right) \end{align}
 \begin{align} 1 +\frac{\partial AC^B_t}{\partial a_t}=(\overline{\phi }(1-\varepsilon _{bt})+\varepsilon _{bt}) \frac{\lambda ^{\phi }_t}{\lambda ^B_t}+\beta _B{E}_t \frac{\lambda ^B_{t+1}}{\lambda ^B_t}\left(1+r^b_{t}-\varepsilon _{bt+1} \frac{\lambda ^{\phi }_{t+1}}{\lambda ^B_{t+1}} - \frac{\partial AC^B_{t+1}}{\partial a_{t}}\right) \end{align}
where
 $\lambda ^B_t,\lambda ^{\phi }_t$
are the Lagrange multipliers of the budget constraint and the borrowing constraint at time
 $t$
, respectively.
2.3 Firms and Housing producers
Patient, impatient, and renter households work for the representative firm and receive wages depending on different labor elasticities,
 $\iota _P,\iota _I,\iota _R$
. It is assumed that
 $\iota _P+\iota _I+\iota _R=1$
. There is a continuum of identical firms of measure one. The firm produces a homogeneous good using a Cobb–Douglas technology
 \begin{align} Y_t=A_t k_{t-1}^\alpha ((l^P_t)^{\iota _P} (l^I_t)^{\iota _I }(l^R_t)^{\iota _R})^{1-\alpha } \end{align}
where
 $A_t$
is a technology shock. The firm maximizes its profit
 \begin{align} \max _{k_{t},l^P_t,l^I_t,l^R_t} Y_t-w^P_tl^P_t-w^I_tl^I_t-w^R_tl^R_t-r^k_t k_{t-1} \end{align}
Since markets are perfectly competitive, the market prices are
 \begin{align} \alpha \frac{Y_t}{k_{t-1}}=r^k_t \end{align}
 \begin{align} (1-\alpha )\iota _i\frac{Y_t}{l^i_t}=w^i_t,\quad i=P,I,R \end{align}
In the economy, there is a continuum of measure-one firms and perfectly competitive housing producers which provide housing to households.Footnote
9
In each period, housing producers buy the undepreciated part of houses from households at a relative price
 $p^h_t$
, then invest
 $i^h_t$
to produce new houses
 $h_t$
. Hence, they maximize their benefit as:
 \begin{equation} E_t\sum ^\infty _{\tau =t} \beta ^{\tau -t}_P\frac{\lambda _\tau ^P}{\lambda ^P_t}[p^h_\tau ( h_\tau -(1-\delta _h)h_{\tau -1})-i^h_\tau ] \end{equation}
where
 $h_t=h^P_t+h^I_t+h^R_t$
is total housing. The patient households’ stochastic discount factor is used to discount future profits.Footnote
10
Production is subject to an adjustment cost defined as a fraction of investment. As a result, housing production follows the law of motion:
 \begin{align} \left[1-\frac{\psi _{hp}}{2}\left(\frac{i^h_t}{i^h_{t-1}}-1\right)^2\right]i^h_t=h_t-(1-\delta _h)h_{t-1} \end{align}
The FOC with respect to housing reveals the house price:
 \begin{align} p^h_t&\left[1-\psi _{hp}\left(\frac{i^h_t}{i^h_{t-1}}-1\right)\frac{i^h_t}{i^h_{t-1}}-\frac{\psi _{hp}}{2}\left(\frac{i^h_t}{i^h_{t-1}}-1\right)^2\right] \nonumber \\ & +\beta _P{E}_t p^h_{t+1}\left[\frac{\lambda ^P_{t+1}}{\lambda ^P_{t}}\psi _{hp}\left(\frac{i^h_{t+1}}{i^h_{t}}-1\right)\left(\frac{i^h_{t+1}}{i^h_{t}}\right)^2\right]=1 \end{align}
2.4 Government and market clearing
The government collects all taxes from all agents,
 \begin{align} T_t&=\tau _c C_t +\tau _t \end{align}
where
 $T$
is the total tax revenue of the government.
 $C_t=c^P_t+c^I_t+c^R_t+c^B_t$
is total consumption.
 $\tau _t = \tau ^P_t +\tau ^I_t +\tau _{wr}w^R_t l^R_t$
is total tax paid by households. In each period, the government has access to bonds
 $b^g_t$
, and total tax
 $T_t$
, to pay its liabilities to the banker, lump-sum transfers
 $\Gamma _t$
, and government spending
 $g_t$
.
Hence, the government’s budget constraint is
 \begin{align} (1+r^b_{t-1})b^g_{t-1}+g_t+\Gamma _t=b^g_t+T_t \end{align}
Transfers to each household depend on level parameters,
 $\vartheta _P,\vartheta _I,\vartheta _R$
, which are specific to the type of household, so
 \begin{align} \Gamma _t=\Gamma ^P_t+\Gamma ^I_t+\Gamma ^R_t \end{align}
 \begin{align} \Gamma ^i_t=\vartheta _i Y_t,\quad i=I,P,R. \end{align}
Market clearing for this economy is
 \begin{equation} Y_t=C_t+i^h_t+i^k_t+g_t \end{equation}
An equilibrium defines a set of prices
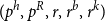 $(p^h,p^R,r,r^b,r^k)$
and allocations
 $(c^P,c^I,c^R,c^B,h^P,h^I,$
 $h^R,l^P,l^I,l^R,M,i^k,i^h,d,k,b_g,g,\Gamma ^P,\Gamma ^i,\Gamma ^R)$
so that all agents and firms maximize their objective functions subject to their respective constraints, while all constraints are binding and all markets clear (markets for goods, housing, labor, deposits, mortgages, capital, and government bonds).
3. Estimation and results
3.1 Calibration
Table 1 presents the model parameters values, which are calibrated as follows using quarterly US data to match steady state targets. The discount factors of households and the banker are set to target a
 $3\%$
annual risk-free interest rate on deposits and a
 $ 6\%$
annual interest rate on loans. Depreciation rates are set to
 $0.83\%$
for housing and
 $2\%$
for capital to target a
 $5\%$
housing investment to GDP ratio and a
 $15\%$
non-housing investment to GDP ratio (so total investment/GDP equal to
 $20\%$
) according to the US Bureau of Economic Analysis GDP data and the Flow of Funds Accounts (FOF; Federal Reserve Board). Housing preferences
 $\varphi ^P_h,\varphi ^I_h,\varphi ^R_h$
are set to
 $0.13,0.20,0.44$
, respectively, to secure
 $h_P/h=0.27,h_I/h=0.37,h_R/h=0.36$
, according to the Residential Finance Survey (RFS) and American Housing Survey (AHS).
 $\iota _P,\iota _I,\iota _R$
are set to
 $0.23,0.51,0.26$
, respectively, to target wage shares. The labor supply parameter is calibrated in order to get a one unit of patient labor supply at the steady state. Capital share in production
 $\alpha$
is set to
 $0.28$
to insure a capital-to-GDP equal to
 $1.75$
annually, based on the US Bureau of Economic Analysis capital data. The parameters for transfer shares
 $\vartheta _P,\vartheta _I,\vartheta _R$
are set to
 $0.059,0.058,0.036$
, respectively, to balance the budget constraints.Footnote
11
The LTV ratio is calibrated to fix the mortgage-to-housing value around
 $0.70$
according to the AHS. The LTA ratio is set to
 $0.90$
to be consistent with historical data on banks’ balance sheets [Iacoviello (Reference Iacoviello2005)]. All tax rates are set based on the US tax codes mentioned in Zubairy (Reference Zubairy2014). Inertia in borrowing constraint is set based on Alpanda and Zubairy (Reference Alpanda and Zubairy2016). The inverse of the Frisch elasticity of labor supply is set to
 $1$
in line with Smets and Wouters (Reference Smets and Wouters2007).
Calibrated parameters

3.2 Results
There are six shocks in the model, namely shocks to: preference
 $\varepsilon _{c}$
, housing demand
 $\varepsilon _{h}$
, technology
 $\varepsilon _{A}$
, investment
 $\varepsilon _{i}$
, LTV
 $\varepsilon _{m}$
, and the inertia in capital adequacy constraint of financial intermediaries
 $\varepsilon _{b}$
. They follow AR(1) process
 \begin{align} \log (\varepsilon _{it}) = \rho _i \log (\varepsilon _{it-1}) + \epsilon _{it}, \quad \epsilon _{it} \sim N (0, \sigma _i), \quad i= c,h,i,m \end{align}
 \begin{align} \log (A_t) = \rho _A \log (A_{t-1} ) + \epsilon _{At}, \quad \epsilon _{At} \sim N (0, \sigma _A) \end{align}
 \begin{align} \log (\varepsilon _{bt}/\overline{\varepsilon _{b}}) = \rho _b \log (\varepsilon _{bt-1}/\overline{\varepsilon _{b}}) + \epsilon ^b_t, \quad \epsilon ^b_t \sim N (0, \sigma _b) \end{align}
Following six shocks in the models, six time series are used to estimate the model. These series including real GDP, real consumption, real mortgages, real house prices, interest spreads, and total factor productivity are detrended and demeaned US quarterly data from 1990Q1 to 2019Q2.Footnote 12
Dynare and Bayesian methods, as introduced in An and Schorfheide (Reference An and Schorfheide2007), are used for the estimation. The optimizer for the mode computation is that introduced by Sims et al. (Reference Sims1999). The first 40 observations (1990Q1–1999Q4) are used as a training sample for the Kalman filter. The prior values are set as follows. It is assumed that all parameters are independent a priori. The housing stock adjustment costs are set as in Alpanda and Zubairy (Reference Alpanda and Zubairy2016). The adjustment cost for housing producers is set as in Roi et al. (Reference Roi and Mendes2007). The inertia in the capital constraint at the steady state
 $\overline{\varepsilon _{b}}$
, prior mean of standard deviations and autocorrelation of shocks, and the rest of adjustment costs are based on the estimation findings of Iacoviello (Reference Iacoviello2015). This arrangement covers a wide range of outcomes.Footnote
13
Table 2 presents the results of the estimation. The estimation shows that all the shocks are persistent with autocorrelation coefficients exceeding
 $0.83$
. The LTV shock for which the autocorrelation coefficient is around
 $0.99$
is the most persistent meaning that even a small shock will affect future values for a very long time. Figure 2 presents the mean over time of the posterior distribution of the smoothed shocks to the capital adequacy constraint and housing demand. As the figure indicates,
 $\varepsilon _{bt}$
was getting higher in the years preceding the 2008 financial crisis, that is, the financial condition was looser leading to high deviations from the regulatory target by banks; during the crisis, we observe negative shocks to
 $\varepsilon _{bt}$
, that is, capital constraints were complied with more strictly and banks; thus, they had a greater commitment to follow the regulatory target. After 2012, the financial conditions were more strict than before the crisis but looser than during the crisis (see Financial-Stability-Reports (2018) and Reports (Reference Reports2019), Section 3: leverage in the financial sector) which can be observed by shocks to
 $\varepsilon _{bt}$
around the mean. The housing demand shock arose before the crisis and at its maximum at 2006. It reduced afterward and touched its minimum in 2009. It has also been around its average in recent years. However, housing demand has followed a positive trajectory since 2017, which could be related to the US expansionary policy.
Estimation results

P: patient household, I: impatient, B: banker, HP: housing producer, I.G: inverse gamma, Be: beta, Ga: gamma, HPD: highest posterior density interval. The number of replications for the Metropolis–Hastings algorithm is set to
 $100000$
. Final value of minus the log posterior (or likelihood): −1077.754.
The mean over time of the posterior distribution of the smoothed shocks: (top) Inertia in capital adequacy constraint, and (bottom) housing demand.

The household and bank deposit adjustment costs are estimated at
 $0.03$
and
 $0.13$
. This difference between deposit adjustment costs shows that changing deposits is cheaper and easier for households than for bankers. In addition, the estimation indicates that for patient households, changing deposits is more convenient than changing houses (with an adjustment cost coefficient estimated at
 $0.14$
) or changing capital (with a coefficient estimated at
 $5$
). The result for the capital adjustment cost is consistent with the findings of Smets and Wouters (Reference Smets and Wouters2007). The housing producer adjustment cost is estimated at
 $15$
. This result is roughly consistent with Justiniano et al. (Reference Justiniano, Primiceri and Tambalotti2015). The estimated values for capital and housing producer adjustment costs confirm the existence of a high inertia in housing and capital investment.
The housing adjustment costs for impatient households is estimated twice of that of patient households. In addition, impatient households are subject to a mortgage adjustment cost. It shows that changing housing is therefore rather difficult for impatient households than patient households, who use their own resources to accumulate wealth. The inertia in capital adequacy constraint is estimated at
 $0.63$
which is higher than average. This illustrates that in average throughout the sample period, the financial sector had a high degree of freedom to deviate from the regulatory target and avoid an instant recapitalization after facing a shock.
3.3 Contribution of shocks
Figure 3 illustrates the historical shock decomposition for the variables further to the data from 2000Q1 to 2019Q2. The results outline that the preference, housing demand, and investment shocks made the biggest contributions to output before the crisis, while the TFP and LTV shocks were added to this list during the crisis. In recent years, the preference, housing demand, and TFP shocks, which are all considered as non-financial shocks, have made the biggest contribution to output.Footnote 14 This result could be explained by the introduction of strict financial regulations after the crisis, such that financial shocks have progressively come under control. Financial shocks, such as LTV and capital adequacy shocks, are more dominant in interest spreads and mortgages, while in house prices, the mix of financial and non-financial (housing and investment) shocks are the major contributors.
Historical decomposition of the estimated model. The solid line is the smoothed value of the respective variables in deviations from their steady state.

While the impact of typical financial shocks such as those to investment and LTV is evident in the model, the contribution of the capital adequacy shock as a pure direct financial shock to the financial sector is an interesting point of discussion. The capital adequacy shock does not make a major contribution to output or house prices but provided an important input in consumption, interest spreads, and mortgages, especially before the financial crisis. The explanation is as follows.
Before the financial crisis, the market experienced a positive shock to
 $\varepsilon _b$
which could be interpreted as a change in the market discipline induced by shareholders of the bank or by financial conditions. As explained in the financial sector Section 2.2, this led the banks to stray from the set targets. As a result, the capital constraint was relaxed and the economy experienced a decrease in the capital-to-asset ratio. This had a positive impact on mortgages and thus on housing demand, investment, and consumption. After the crisis, and especially between 2010 and 2013, we observe tighter financial conditions, that is, a negative shock to
 $\varepsilon _b$
. This reduces the contribution of the shock in the real variables. However, the spread is significantly influenced by the shock. To be more precise, by subtracting equations (2.21) from (2.20) (for simplicity, ignoring the adjustment costs)Footnote
15
, the spread is defined as a function of the inertia in capital adequacy constraint
 $\varepsilon _{bt}$
:
 \begin{align} r^b_{t}-r_t = \frac{(1- \overline{\phi }) \lambda ^{\phi }_t}{\beta _B{E}_t \lambda ^B_{t+1} } (1 - \varepsilon _{bt}) \end{align}
which indicates that the capital adequacy shock has a substantial impact on the interest spread between deposits and loans; the greater the inertia, the more relaxed the constraint and the smaller the spread.
Table 3 presents the accumulative contribution of each shock to the historical deviations in output, consumption, and house prices from their respective steady states before and during the 2008 financial crisis, and in recent years, that is, 2016–2019Q2. The results show that housing demand and investment shocks were the main drivers of the output boom and bust before and during the crisis. They have also played a dominant role in the growth of recent years. From 2005, the negative contribution of financial shocks started to reduce output. However, at the same time, non-financial shocks such as that to housing demand were strong enough to drive the economy; the positive contribution of housing demand alone was higher than all the negative impacts of financial shocks. This did not continue for long, however, and was reversed during the crisis; while financial shocks remained on their trajectory, housing demand, and preference shocks dropped drastically after 2008. As a result, the negative contribution of financial shocks offset the contribution of non-financial shocks, and output therefore dropped.
Historical decomposition (%)

In recent years, both financial and non-financial shocks have contributed positively to growth. Before the crisis, contributions of all financial shocks to house prices were positive. This was reinforced by the impact of housing demand. As a result, a huge increase in house prices is observed. This was reversed entirely during the crisis. All the shocks contributed to a decrease in house prices, with financial shocks the main drivers among them. In recent years, house prices have recovered, and financial and housing-demand shocks have made a positive contribution to this recovery.
3.4 Transmission mechanisms
The previous section illustrates how different shocks contribute in shaping the US economy from 1990 until recent years. This section takes a precise look on the transmission mechanisms of these shocks and how they propagate from one sector to another, then summarizes the model dynamics in response to the estimated shocks with an impulse response analysis.
The favorable financial situation before the crisis facilitated lending by banks, thereby increasing their leverage. As a result, mortgage demand, impatient housing demand, and consequently the return on mortgages all increased. Impatient households could afford this high return and consume more due to the wealth effect, the relaxed borrowing constraint (due to LTV shock), and the relaxed capital constraint (due to the capital adequacy shock). As a result, the financial sector which faces high mortgage demand responded by two actions as follows. First, increasing deposit issuance by proposing a higher interest rate. As a result, patient households reallocate their savings from capital and housing to deposits. The drop in capital investment gradually reduces output. Second, the bank may reallocate other assets to mortgages [Merler and Pisani-Ferry (Reference Merler and Pisani-Ferry2012)]. This channel needs a careful further investigation and I leave exploration of this topic for future research.
Another noteworthy fact which is captured by the model as shown in Figure 3 (house price) is the house price downward spiral when house prices still continue to fall, even after the crisis ends and recovery begins. In the context of the model, the house price downward spiral was a major factor contributing to the slow recovery after the Great Recession.Footnote 16 The mechanisms at work in house price behavior are as follows. The positive shock to housing demand was the reason for the initial house price increase after 2004. The increase in housing demand supported the increase in mortgages. Then, as discussed before, patient households prioritized deposits and decreased their housing investment. This, in turn, lowered demand and consequently house prices. In certain periods, this effect dominates the first mechanism, and house prices therefore come down. Impatient households benefit from lower house prices and expand their consumption and housing. This situation, in the presence of a positive shock to the capital adequacy constraint, leads financial agents to ignore the regulations and heat up the mortgage market by decreasing their bond holdings and increasing their liabilities. This is one step before the crisis. After the crisis, the drop in house prices does not end as the recovery begins; they continue to fall. Housing demand and investment shocks are mostly responsible for this fall.
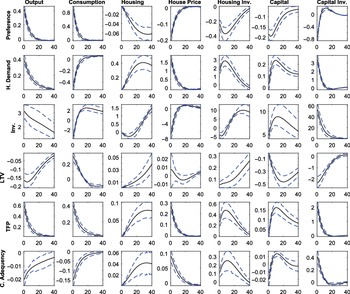
Figure 4 presents the impulse responses of key variables to financial and non-financial shocks estimated in the model. The figure indicates that the shock with the highest impact on GDP is the investment shock (about
 $3\%$
); the smallest impact comes from the capital constraint shock with an absolute term of
 $0.02\%$
. The estimated shocks to preference, housing demand, TFP, and investment have positive impacts on output. These positive responses are quite obvious as fully explained in the previous section. On the other hand, the shocks to LTV and capital adequacy lead to a decrease in output. These negative impacts are worth explaining.
Impulse response analysis for key variables. Y = Percentage. X = Quarter. Solid line: posterior IRF at mean, dash lines: posterior IRF at 90% confidence intervals.

First, the LTV: a shock to the LTV ratio has a direct impact on the ability of impatient households to raise mortgages. As a result, a positive shock increases mortgage demand. This pushes up both bank deposit demand (in order to supply mortgage demand) and impatient housing demand. The latter has a positive impact on house prices and housing investment. The rise in house prices brings down patient housing demand and makes space for a rise in consumption, capital, or deposits. Patient households prefer deposits for two reasons: first, the higher deposit demand from the banking sector which results in higher interest rates, and second, the fact that the deposit adjustment cost is much lower than that of capital. The aggregate impact of these mechanisms causes a decrease of
 $0.18\%$
in output.
Second, the shock to the capital adequacy constraint: as shown in equation (3.4), the shock to the capital adequacy constraint decreases the interest spread (i.e.
 $r^b_t-r_t$
) and relaxes the constraint. This means lower profit and consumption for bankers, and more leverage. This leverage is only possible through higher deposit demand, higher interest, and a higher mortgage supply. Mortgages are available for impatient households but at a higher price. This increases mortgages but dampens impatient consumption. As a result, house prices increase, but general consumption and, consequently, output decrease by about
 $-0.02\%$
. The impacts of the increase in house prices on patient households, and the rest of the mechanisms, are similar to the responses of LTV explained above.
4. Macroprudential regulations
4.1 Tools
The recent financial crisis resulted in a crucial role for macroprudential policy tools (hereafter MPTs) to ensure financial stability. This section investigates the application of three MPTs, namely (
 $i)$
LTA ratio, (
 $ii)$
LTV ratio, and (
 $iii)$
DTI ratio. The section below looks at the impact of each of these MPTs and two policy mixes: the LTA-LTV set and LTA-DTI set, through the lens of welfare analysis.
MPTs are varied and apply to different sides of the economy. The LTA policy is an MPT for the financial sector which restricts banks’ leverage. The goal is to reduce systematic risk by controlling
 $\overline{\phi }$
in the model. The LTV policy regulates
 $\theta$
in the model. Both the other MPTs, the LTV and DTI, are imposed to control borrowing constraints and thus have direct impacts on the mortgage and housing markets. The DTI policy puts caps on the credit growth of borrowers. In this paper, the DTI is introduced in the borrowing constraint of the impatient household problem (2.8) following Gelain et al. (Reference Gelain, Lansing and Mendicino2013).Footnote
17
As a result, the new borrowing constraint is
 \begin{align} M_t\leq \rho _m M_{t-1}+ (1-\rho _m) [\theta _w (w^I_t l^I_t) + (1-\theta _w) \varepsilon _{mt}\theta p^h_{t} h^I_t] \end{align}
where
 $\theta _w$
is the weight assigned to the borrower’s wage income.
 $\theta _w=0$
gives the benchmark model. Applying the new borrowing constraint, the FOCs of impatient households in respect to housing and labor change to
 \begin{align} p^h_{t}-\frac{\lambda ^m_t}{\lambda ^I_t}(1-\rho _m)\varepsilon _{mt} (1-\theta _w)\theta p^h_t =\beta _I{E}_t\left[\frac{\varphi ^I_h \varepsilon _{ht} \varepsilon _{ct}}{\lambda ^I_t h^I_t}+\frac{\lambda ^I_{t+1}}{\lambda ^I_t}((1-\delta _h-\tau _p)p^h_{t+1})\right] \end{align}
 \begin{align} \varphi ^I_l (l^I_t)^\iota =[\lambda ^I_t (1-\tau _w) + \lambda ^m_t(1-\rho _m)\theta _w] w^I_t \end{align}
The transmission mechanisms of LTA and LTV are similar to those of shocks to the borrowing constraint and LTV, respectively, which are extensively explained in the previous section. The effective mechanism of DTI policy is also similar to that of the LTV, as both control mortgages. However, the DTI and LTV policies are different in nature. The LTV policy makes mortgages dependent on the housing market. The DTI makes mortgages reliant on real wages, which, from equation (2.25), represent the general situation of the economy and output. So the DTI is a pro-cyclical policy. A strict implementation of a prudent DTI can regulate the housing boom and moderate the crisis. On the other hand, the DTI makes it difficult for the economy to recover after a crisis. The reasons are twofold. Firstly, GDP, capital, and wages decline after the crisis. The DTI policy restricts borrowers to their income, so their access to credit drops. Without a DTI policy, borrowers can raise more credit, even with low incomes. This could lead to a further contribution by impatient households, which might help the economy and boost the recovery. Secondly, a higher DTI results in a lower share of housing as collateral and lower mortgage demand. This reduces impatient consumption. The economy therefore slows down. This is why the policy-maker ought to take on board the fact that macroprudential policy tools should be timely, targeted, and temporary; otherwise, they may hinder growth and slow down recovery.
4.2 Welfare analysis
Welfare impacts in this paper are analyzed following Rubio and Carrasco-Gallego (Reference Rubio and Carrasco-Gallego2014). Patient households’, impatient households’, and renters’ welfare at time
 $t$
are
 \begin{align} f^i_{t} = E_t \sum _{\tau =t}^\infty \beta ^{\tau -t}_i\left\{ \varepsilon _{c\tau }\log c^i_\tau +\varphi ^R_h \varepsilon _{h\tau } \varepsilon _{c\tau }\log h^i_{\tau -1}-\varphi ^R_l \frac{(l^i_\tau )^{1+\iota }}{1+\iota }\right\}, \quad i= P,I,R \end{align}
The welfare change in terms of consumption equivalent is
 \begin{align}{CE}^i_t&=\exp \left[(1-\beta _i)(f^i_t - \overline{f}^i_t)\right],\quad i= P,I,R \end{align}
 $CE$
refers to the amount of consumption that household’s need to give away to obtain the benefits from the change in policy.
 $\overline{f}^i_t$
is welfare in the benchmark model, the model of Section 2 with the estimation results of Section 3. A new policy only changes the respective parameter in the benchmark model permanently from time t, ceteris paribus. With each change in a policy and consequently in the respective parameter, a new simulation is run to calculate
 $f^i_{t}$
. The welfare measurement of the economy (or social/total welfare) is the weighted average of households’ welfare:
 \begin{align}{CE}^T_t= \frac{1}{\overline{c}}\left[\overline{c}^P. CE^P_t + \overline{c}^I. CE^I_t+\overline{c}^R. CE^R_t\right] \end{align}
each agent’s welfare is weighted by her consumption where
 $\overline{c}^i, i=P,I,R$
are the steady state of patient, impatient, and renter household consumption, respectively.
 $\overline{c}$
is the steady state of total consumption.
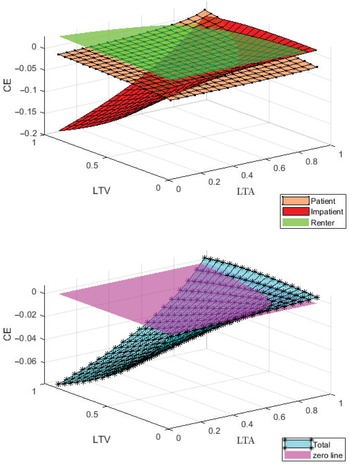
Figure 5 presents the welfare effects of different LTA and LTV policies separately. The LTA policy has a significant impact on total welfare. While it does not substantially affect patient household welfare, it does have a huge impact on impatient and renter households. The reason is hidden in the mortgage market and mortgage interest
 $r^b$
. From equation (2.21), the interest on mortgages is a decreasing function of LTA. A higher LTA relaxes the capital constraint and makes more mortgages available for impatient households at a lower price. This has a positive impact on all elements of impatient household welfare. Hence, impatient households are better off and welfare increases with respect to the LTA. For renters, the inverse is true due to the impact of rent prices; house prices and, consequently, rent prices rise due to impatient household demand. On the other hand, patient households do not notice a huge change. Patient household welfare increases slightly with respect to the LTA because of the secondary impact of the Lagrangian multiple of borrowing constraint on deposit interest, as the LTA does not have a direct impact on this interest (see equation (2.20)).
Welfare effect of a single macroprudential policy. (above) The LTV policy when the LTA ratio is fixed to that of the benchmark model. (bottom) The LTA policy when the LTV ratio is fixed to that of the benchmark model. Note that in this framework, CE close to zero means welfare moves around that of the benchmark model and does not mean that welfare is measured as zero.

The LTV policy introduces a trade-off between the welfare of patient and impatient household. Impatient households and renters are worse off with higher LTVs; however, patient household welfare increases. Once again, the reason is hidden in the mortgage market: this time from the demand side. From equation (2.10), the higher the LTV, the higher the house prices. Renters definitely do not benefit from this situation. Mortgage demand and mortgage interest also increase with the LTV policy. This means a higher LTV results in higher repayments for impatient households in each period. These repayments make impatient households worse off. On the other hand, patient households observe an increase in deposit interest and house prices, but thanks to other ways of smoothing their consumption, the net impact is positive.
Figure 6 presents the welfare effects of policy mixes, when the LTA and LTV policies are in force together. The figure illustrates that there are various policy sets which lead to the same total welfare as the benchmark model. However, the impact of each policy on economic variables and households obviously varies.
Welfare effect of a macroprudential policy mix: LTV and LTA together.

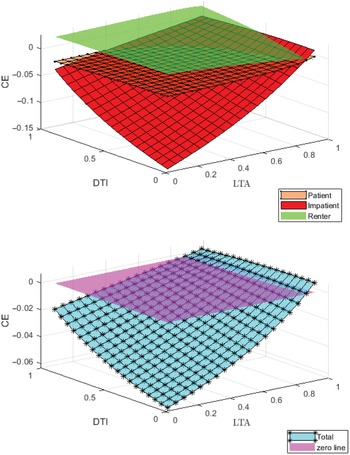
Figure 7 depicts the welfare changes brought about by DTI. Applying DTI makes impatient and renter households better off and patient households worse off. The reasons are as follows. The DTI policy abates the power of LTV, as evidenced in equation (4.2). The DTI reduces mortgage demand as it shifts mortgages away from house values to the wage share (from 1.5 times GDP to about 60% of GDP). These channels taper house prices, and the first winners are therefore the renters. The impacts on patient and impatient households follow the same mechanism as that of the LTV policy explained above. The results indicate that introducing the DTI policy into the economy improves total welfare, but not significantly.
Welfare effect of a single macroprudential policy: DTI when other parameters are set to that of the benchmark.

The welfare changes induced by a policy mix between LTA and DTI are illustrated in Figure 8. Similar to the previous policy mix, the points on the intersection between total welfare and the zero line are neutral policies. Policy-makers can choose between these points without changing total welfare; however, each point has a different impact on different types of households.
Welfare effect of a macroprudential policy mix: DTI and LTA together.

5. Conclusion
This paper applies a DSGE model to estimate and study financial and non-financial shocks and the application of macroprudential policies to an economy incorporating heterogeneous households, a financial sector, government, firms, a housing market, and house producers. The model features two financial frictions: first, borrowing constraints on borrower households based on house values, and second, flexible capital constraints on intermediary agents. This paper examines the impact of six shocks: preference, housing demand, technology, investment, LTV, and lastly, a shock to the inertia in capital adequacy constraint on financial intermediaries. This last shock is a new shock in the literature which captures the effective regulation level in the financial sector. In addition, the role of macroprudential policy tools in protecting financial stability is assessed through the lens of a welfare analysis.
A few essential points must be made regarding the role of intermediaries in financial shocks. This would be an interesting starting point for future studies. This model does not permit banks to run, though this is not the case in a real economy like that of 2007 when financial corporations which could not meet their obligations were forced to run. Different orientations such as those used by Uhlig (Reference Uhlig2010), Calvo (Reference Calvo2012) and Gertler and Kiyotaki (Reference Gertler and Kiyotaki2015) would make an interesting addition to the model.
The dynamic stochastic general equilibrium (DSGE) model presented here has the ability to explore the impacts of other scenarios, for example, the impacts of fiscal reforms and government or banking defaults, similar to Roubini and Sachs (Reference Roubini and Sachs1989) and Ramey (Reference Ramey2011). A government default may occur specifically in response to a government spending shock. One scenario could be a government default in order to provide more transfers to households. This situation could happen in an exceptional socio-political situation where governments might need political support. This is the case of some third world countries which have defaulted on their loans to increase public spending [Dinç (Reference Dinç2005)].
While the experiments of this paper are illustrative of an important transmission channel of financial and non-financial shocks to business cycles, the paper abstracts the role of conventional and unconventional monetary policy. The latter played a very important role in the dynamic behavior of the economy during the sample period studied in the paper. Exploring the behavior of the model at the Zero Lower Bound and other improvements related to conventional or unconventional monetary policies are all interesting potential extensions of the current paper for future research.