Implications
We investigated the effect of staged ovariectomy on mammary growth and development in prepubertal dairy heifers. Ovariectomies were performed at 2, 3 or 4 months of age and mammary parenchyma and fat pad were harvested for biochemical, histological and gene expression analyses after 30 days. Ovariectomy markedly reduced parenchymal growth and transcript abundance of a proliferation marker gene and selected estrogen-responsive genes. With the exception of animals ovariectomized before 2 months of age, the magnitude of response to ovariectomy was not dependent on age at ovariectomy. Our results support the assertion that the ovary is critically involved with prepubertal mammogenesis.
Introduction
Growth and development of mammary gland is regulated by the interaction of a variety of mammogenic hormones and growth factors. Historical evidence shows that the ovary is important for normal growth and functional development of the mammary gland (Akers, Reference Akers2002). However, mechanisms involved in ovarian regulation of mammary growth and development differ among species and vary during different physiological stages. Classic experiments were conducted in rats and mice (Cowie, Reference Cowie1949; Flux, Reference Flux1954), but a number of studies with ruminants have also been reported. An early study performed in lambs suggested that there was no apparent change in mammary parenchyma (PAR) when ovaries were removed at birth, while in cattle mammary growth after ovariectomy was almost nonexistent (Wallace, Reference Wallace1953). This suggests that even among ruminants there might be marked differences in response to endocrine ablation and replacement treatments. Later studies have confirmed differences in ovarian regulation of mammary growth and development between sheep and cattle (Purup et al., Reference Purup, Sejrsen and Akers1995; Ellis et al., Reference Ellis, McFadden and Akers1998; Berry et al., Reference Berry, Howard, Jobst, Jiang and Akers2003b).
Regulation of mammary growth by ovarian secretions is assumed to be primarily mediated through estrogen. However, the reduction in circulating concentration of estradiol in response to ovariectomy in prepubertal heifers was only 0.1 pg/ml (Purup et al., Reference Purup, Sejrsen, Foldager and Akers1993), which appears inadequate to elicit the dramatic reduction in parenchymal growth that was noted in that study. Moreover, literature shows that a daily dose of ∼0.1 mg/kg body weight (BW) estradiol is required to elicit positive responses in mammary epithelial cell (MEC) proliferation (Woodward et al., Reference Woodward, Beal and Akers1993; Capuco et al., Reference Capuco, Ellis, Wood, Akers and Garrett2002; Meyer et al., Reference Meyer, Capuco, Boisclair and Van Amburgh2006a). On the other hand, a large increase in the expression of estrogen receptor-α (ERα) was noted in conjunction with a significant reduction in MEC proliferation in older ovariectomized heifers (Berry et al., Reference Berry, Jobst, Ellis, Howard, Capuco and Akers2003a). This suggests there are locally active interacting mechanism(s) involving estrogen, estrogen receptor expression, cell proliferation pathways and likely other signaling elements that coordinate and control peripubertal mammary development in heifers and other ruminants.
Enhancement of lobulo-alveolar growth during later stages of pregnancy is necessary to ensure maximum milk yield in the following lactation. Thus, mammary growth throughout the early prepubertal period provides the foundation for the pronounced allometric growth and expansion of the ductular tree that begins just before the onset of puberty and the alveolar development that occurs during gestation. When ovaries were removed at birth, there was almost complete blockage of mammary development in calves (Wallace, Reference Wallace1953) and up to a 90% reduction in mammary parenchymal growth when heifers were ovariectomized at 2.5 months of age (Purup et al., Reference Purup, Sejrsen and Akers1995). When ovaries were removed from heifers between 2.5 and 3.0 months of age, there was a reduction in mammary development but not complete cessation (Berry et al., Reference Berry, Jobst, Ellis, Howard, Capuco and Akers2003a). These observations suggest that the magnitude of mammary gland response to ovariectomy depends on the age at which ovaries are removed. Therefore, we hypothesized that ovarian secretions are required to initiate mammary development but not required to maintain mammary growth in calves. The main objective was to determine whether there is a difference in the magnitude of response to ovariectomy performed at different stages of the prepubertal period on mammary growth and development. Data presented in this report document a persistent role for ovarian secretions in maintaining mammary development and provide insight into discordant endocrine regulation of development between parenchymal and mammary fat pad (MFP) tissues.
Material and methods
Animals and tissue collection
The Clemson University Institutional Animal Care and Use Committee approved all the procedures and protocols used in this study. Twenty-four Holstein heifers were purchased and housed in the Simpson Experiment Station at Clemson University. Heifers were acquired in two lots from two separate farms. All animals were weaned and underwent veterinary inspection before shipment to Clemson. Animals were fed a commercial heifer grower ration supplemented with a mixed forage pasture and high-quality hay available ad libitum. Heifers gained an average of 0.61 kg/day ± 0.05 kg during the 35 to 45 days they were housed at Clemson (including acclimation, surgery, and then tissue collection after 30 days, as described below).
Heifer health was regularly monitored by checking the body temperature, assessing the daily feed and water intake and observing behavioral changes. All animals were fed with standard commercial milk replacers and calf starter diets according to the manufacturer's instructions before weaning and with grains and hay thereafter in accordance with standard practices. BW was recorded a week before the surgery (week 0) and then weekly after surgery (weeks 1 to 4). After a 1-week adaptation period at the facility, heifers were assigned to a 2 × 3 factorial experimental design. The first factor was ovarian status, with heifers ovariectomized (OVX; n = 12) or sham operated (INT; n = 12). The second factor was age at which surgeries were performed (2, 3 or 4 months of age). Animals of different age groups were acquired in lots and hence surgery was performed at different time points. Surgeries were performed by laparoscopic intervention following a vertical incision of ∼10 cm on the left flank after the area was cleaned and desensitized with local anesthetic (Lidocane HCl, 2% injectable solution) (AGRI Laboratories, St. Joseph, MO, USA). Ovaries were isolated and removed using a Meagher Ovary Flute (c/o Harry Disney DVM, 2582 Bear Creek Road, Libby, Montana 59923; www.spaytool.com). In INT heifers, ovaries were palpated during a sham surgery, but left intact.
Thirty days after surgery, animals were humanely killed by captive bolt stunning followed by exsanguination and mammary tissues were harvested. The udder was removed immediately, weighed and then divided in half by dissecting through the medial suspensory ligament. The right udder half was used for biochemical analyses. Tissues for gene expression and histological analyses were sampled from the left udder half. Samples of mammary PAR and MFP were dissected from the left front quarter from each animal and fixed in 10% normal formalin for histological analyses.
All ovariectomies were confirmed at slaughter by careful carcass inspection and histological analysis of any suspect tissues. Two heifers in OVX were found to have fragments of ovarian tissue attached to the reproductive tract. Histological evaluation of these suspect tissue pieces revealed follicle structures. Therefore, those two heifers were excluded from final data analyses. In addition, mammary PAR was only faintly detectable as a minute narrow streak dorsal to the teat in two of the OVX heifers. Thus, there was no tissue available for analysis. Consequently, for measurements involving mammary PAR, heifers available for analysis were: 2 months (age at surgery) INT: n = 4, OVX: n = 2; 3 months INT: n = 4, OVX: n = 3; and 4 months INT: n = 4, OVX: n = 3. For other measurements (BW, composition of MFP, etc.) samples from the two heifers with limiting PAR were available for analysis.
Biochemical analysis of mammary PAR and MFP
One udder half was dissected to separate PAR and MFP and the components weighed separately. Tissue samples were then pulverized in a freezer mill (SPEX SamplePrep LLC, Metuchen, NJ, USA) and stored at −80°C until assayed. Total DNA and proteins were determined by homogenizing 250 mg of powdered sample in 1.5 ml of ice-cold high-salt homogenization buffer (0.05 M NaPO4, 2 M NaCl and 0.002 M EDTA) for 30 s using a tissue homogenizer (PRO Scientific Inc., Oxford, CT, USA). The homogenate was centrifuged at 1000 × g for 5 min at 4°C and the supernatant was decanted and saved at −80°C for DNA and protein estimation. Therefore, the subsequent tissue analysis did not account for insoluble proteins that would not have stayed suspended after centrifugation.
The concentrations of DNA in mammary tissue homogenates were determined using Hoefer DQ 300 Fluorometer (Hoefer Inc., San Francisco, CA, USA). The fluorometer was calibrated using the high-range assay buffer (1 μg/ml Hoechst dye) and DNA standard (1 mg/ml) solutions for PAR samples, whereas low-range assay buffer (0.1 μg/ml Hoechst dye) and DNA standards (100 ng/ml) were used for MFP samples. Concentrations of DNA were calculated by using the optical density (OD) reading of each sample and the corresponding DNA standards for triplicate samples. Total proteins in PAR and MFP were determined using BCA (a Bicinchoninic Acid Assay) protein assay kit (Pierce, Rockford, IL, USA) according to the manufacturer's instructions. Absorbance was measured at 562 nm wavelength on a plate reader (μQuant, Biotek instruments Inc., Winooski, VT, USA). Protein concentrations in duplicate samples were calculated using the OD readings and corresponding standard curve.
Lipid content of PAR and MFP were determined by gravimetrical method described previously (Hara and Radin, Reference Hara and Radin1978). Briefly, weighed amounts of pulverized tissue samples in duplicates were extracted with hexane-isopropanol extraction mixture (HIP; 3 : 2 vol/vol) in the ratio of sample to HIP volume (1 g to 18 ml) followed by sodium sulfate at a ratio of 1 g to 9 ml. After phase separation, the upper solvent phase was transferred to pre-weighed tubes. The lower aqueous layer was re-extracted in a similar manner as described above and the solvent layer was transferred and combined with that from the previous extraction. The combined solvent fractions were then evaporated using a N-Evap system (Organomation Associates Inc., Berlin, MA, USA) using nitrogen vapor. The tubes with lipid residue were weighed and the weight of lipid residue was calculated by subtracting the initial empty tube weight.
Histomorphometry
Formalin-fixed paraffin-embedded tissue sections were used for histological evaluation. Tissue sections 5 μm thick were stained with hematoxylin and eosin (Sigma-Aldrich, St. Louis, MO, USA) and photographed using Olympus BH2 light microscope connected to a QColor3 digital camera (Olympus America Inc., Center Valley, PA, USA). Photomicrographs were captured using×4 objective lens and with the help of Q-Capture suite software program (QImaging; Surrey, BC, Canada). Images were saved as JPEG files and area measurements were made using image analyzer software (Image-Pro Plus Version 6.2; Media Cybernetics; Silver Springs, MD, USA). Ten microscopic fields were analyzed per sample. Apart from the epithelial area measurements, the number of mammary ducts per field were counted and classified as buds (terminal structures), ductular branches or large subtending ducts leading to ductal units (Capuco et al., Reference Capuco, Ellis, Wood, Akers and Garrett2002; Brown et al., Reference Brown, VandeHaar, Daniels, Liesman, Chapin, Forrest, Akers, Pearson and Weber Nielsen2005). In addition, a minimum of six digital photographs (×20 objective lens) were taken to characterize the arrangement of epithelial cells within ductular structures.
Immunohistochemistry
Epithelial cell proliferation was assessed by determining the labeling index for the proliferating cell antigen Ki67 in MECs (Capuco et al., Reference Capuco, Ellis, Wood, Akers and Garrett2002). Briefly, formalin-fixed paraffin-embedded tissue sections were deparaffinized in xylene and then rehydrated in descending concentrations of ethanol. A quenching reaction was done by treating with 3% hydrogen peroxide followed by three phosphate-buffered saline washes to remove any endogenous peroxidase activity. Heat-induced antigen epitope retrieval was performed by boiling the tissue sections in citrate buffer (10 mM sodium citrate at pH 6.0). Sections were subsequently treated with a blocking solution (5% goat serum or CAS block) (Invitrogen, Carlsbad, CA, USA) to inhibit non-specific binding of the primary antibody. Sections were incubated overnight at 4°C with anti-Ki67 rabbit monoclonal antibody (Clone SP6, Fisher, Cat. no. RM-9106-S0; 1 : 200 dilution in CAS block). Each slide had a negative internal control that did not get treated with primary antibody, but was incubated with the blocking reagent. The secondary antibody (50 μl of Alexa 488 goat anti-rabbit; Molecular Probes, Invitrogen, Carlsbad, CA, USA) was diluted 1 : 200 in CAS block and sections were incubated in the dark at room temperature for 1 h. Counter staining with 4’-6-diamidino-2-phenylindole (DAPI), which was a part of the Prolong Gold anti-fade mounting solution (Invitrogen), was used to stain the chromatin. Photomicrographs were taken using Nikon Eclipse E600 microscope (Nikon Instruments, Inc., Melville, NY, USA) fitted with an epifluorescence attachment connected to a QColor3 digital camera (Olympus America Inc., Center Valley, PA, USA) at ×20 and ×40 magnifications using the Q-Capture suite software program (QImaging, Surrey, BC, Canada). The UV-2E/C DAPI and FITC filter blocks were used for visualization of DAPI and Ki67, respectively. Ten microscopic fields per sample were used for analysis. Using the Image-Pro software, we determined an average number of epithelial cells per unit of tissue area for each type of ductal structure and used these data to estimate the total number of epithelial cells within an outlined image. We then tallied the total number of labeled cells and expressed this as a percentage of total epithelial cells in each area.
Relative mRNA abundance
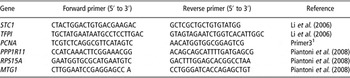
Total RNA from PAR and MFP was isolated using TRIZOL reagent (Life Technologies; Grand Island, NY, USA) according to the manufacturer's instructions. Isolated RNA was then purified by treating with DNase I and RNeasy kit (Qiagen Inc., Valencia, CA, USA) following the product protocol. Quantity of RNA was determined using a Nanodrop ND-1000 Spectrophotometer (Nanodrop Technologies Inc., Wilmington, DE, USA). Samples with a ratio of absorbance measurements at 260 and 280 nm (OD 260 nm/OD 280 nm) greater than 1.8 were accepted for further analysis. To evaluate the integrity of 18S and 28S ribosomal RNA, 5 μg RNA from each sample was electrophoresed on 1% agarose gel and visualized by ethidium bromide staining under UV light. In all, 4 μg total RNA was reverse transcribed to single-stranded cDNA in a final reaction volume of 40 μl using random primers. A control sample containing no reverse transcriptase enzyme (no-RT control) was used for each sample and this was later used in real-time PCR. Quantitative real-time PCR was performed using PCR kits and reagents from Applied Biosystem (Foster City, CA, USA) according to the manufacturer's instructions. A total of 20 ng cDNA was used in each reaction, along with 12.5 μl of SYBR Green dye, 9.5 μl of sterile distilled water, 0.5 μl of 10 μM forward primer and 0.5 μl of 10 μM reverse primer. The PCR conditions were: activation of DNA polymerase at 95°C for 10 min, denaturation at 95°C for 15 s and annealing/extension at 60°C for 1 min and the sequence was repeated for 40 cycles (Applied Biosystems). Real-time PCR reactions were performed in a 7300 Series Real-Time System and data were collected and analyzed using the systems’ SDS software. Each sample was assayed in triplicate and replicate samples having a standard error of >0.05 were rejected and the analysis repeated. Each PCR plate also contained a no-RT template control for each sample analyzed and a no-template control (nuclease-free water instead of cDNA template) per primer pair. Average cycle threshold (C t) values of triplicate samples collected using the SDS software for each target gene and endogenous reference genes were exported to Microsoft Office Excel. All the primers used were designed based on either literature or using Primer Express 3.0 software (Applied Biosystems). The sequences of these primers are shown in Table 1. Three endogenous reference genes; (i) protein phosphatase 1 regulatory (inhibitor) subunit 11 (PPP1R11); (ii) ribosomal protein S15A (RPS15A); and (iii) mitochondrial GTPase 1 homolog (MTG1) (Piantoni et al., Reference Piantoni, Bionaz, Graugnard, Daniels, Akers and Loor2008) were used for normalization of data. Primer pairs were tested for amplification efficiency. All the primer pairs used exhibited amplification efficiencies between 90% and 110%. In addition, the use of endogenous control genes were validated for each target gene by confirming that the slope of ΔC t v. log cDNA input was <0.1. A dissociation curve was performed after each real-time PCR run to rule out formation of primer dimers, genomic DNA contamination and other impurities in the PCR amplicons. In addition, the PCR products for each primer pair were electrophoresed on 2% agarose gel containing ethidium bromide and visualized under UV light to confirm purity and size of the amplicon. Relative gene expression was determined by comparative C t method, also known as the ΔΔC t method (Livak and Schmittgen, Reference Livak and Schmittgen2001). Normalization of C t value for each target gene from each animal was done by subtracting the geometric mean of C t for the three endogenous reference genes from the C t value of each target gene. This normalized value is called the ΔC t for each target gene and statistical analyses were performed on the ΔC t data set. Least-square of means of ΔC t were then used to calculate the fold change in mRNA expression for each target gene for the treatment group relative to control (2-ΔΔC t). Relative gene expression for the estrogen-responsive genes stanniocalcin1 (STC1) and a gene similar to tissue factor pathway inhibitor precursor (TFPI) (Li et al., Reference Li, Meyer, Van Tassell, Sonstegard, Connor, Van Amburgh, Boisclair and Capuco2006), as well as the proliferation marker gene proliferating cell nuclear antigen (PCNA) were determined.
Primer pair sequences of target and endogenous reference genes

Statistical analysis
Statistical analyses of data were performed using the Mixed analysis procedure of SAS (SAS 9.2; Cary, NC, USA). Data were analyzed to test the effects of treatment, age at surgery and interaction between treatment and age using heifer within treatment and age as the random effect. Positive interaction effects were further analyzed using the Slice option to determine the treatment differences between age groups. Significance was declared when P was less than or equal to 0.05.
The model used in all analyses was

where Yijk is the variable being tested, μ the overall mean, Ti the fixed effect of treatment (INT or OVX) (i = 1, 2), Aj the fixed effect of age at surgery (2, 3 or 4 months; j = 1, 2, 3), (TA)ij the fixed interaction of treatment and age and e (ij )k the residual error.
Gene expression data for PAR and MFP were analyzed combined as well as separately. When analyzed combined, main effects of tissue, interactions between tissue and treatment as well as tissue and age were also included in the model. The ΔC t data were used for statistical analyses to eliminate potential bias due to averaging data that had been transformed through the equation 2-ΔΔC t. The effect was declared significant when P ⩽ 0.05 for ΔC t data. However, data were presented as change in mRNA abundance for OVX animals relative to INT control animals using the comparative C t (2-ΔΔC t) method. As mentioned previously, the number of animals in each group used for statistical analyses was: INT, n = 4 for all age groups and for OVX n = 2, 3 and 3 for age at surgery 2, 3 and 4 months, respectively.
Results
Growth, mammary development and composition
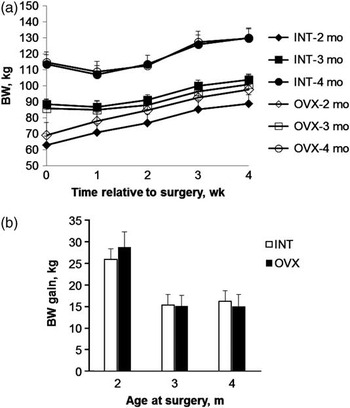
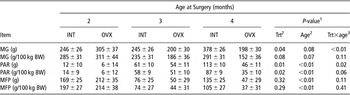
Both INT and OVX heifers were healthy and there was no difference in BW gain between treatment groups (Figure 1a and b). Heifers of 3 months of age at tissue harvest (surgery at 2 months, early) gained 25 to 28 kg during the 30-day period between surgery and sample collection while heifers of 4 (middle) and 5 months of age at harvest (late) gained 14 to 16 kg during the same period, that is, average daily gain of 1.0 and 0.5 kg/day, respectively. Overall there was a 42% decrease in PAR mass in ovariectomized heifers compared with controls. In two of the four heifers ovariectomized at 2months of age PAR appeared only as a barely detectable streak of tissue in the area dorsal to the teat. We estimate that this would only be a few mg of tissue if it were possible to accurately dissect it from the surrounding stromal tissue. Consequently, PAR-related data were not available from these two heifers. Weight of tissues per 100 kg BW for whole udder, mammary PAR and MFP are given in Table 2. When tissue weights were adjusted to BW, there was no difference in total udder weight between treatments or among age groups, but PAR mass was reduced in OVX heifers (P < 0.05). BW adjusted mass of PAR was also increased over time (P < 0.01; Table 2). Mass of PAR per 100 kg BW was reduced 56%, 12% and 59% in OVX for 2, 3 and 4 months age surgery groups, respectively. For MFP, there was no difference in tissue weight between treatments and no interaction between treatment and age. However, there were differences in MFP weights among age groups (Table 2). Mass of MFP was greater in 2 months heifers compared with 3- and 4-month heifers (P < 0.01), but there was no difference in MFP weights between 3- and 4-month heifers (P = 0.56).
Effect of ovariectomy on weekly BW and BW gain over the treatment period. (a) Weekly BW and (b) BW gain in INT (n = 12) and OVX (n = 8) dairy heifers operated at 2, 3 or 4 months of age and killed 30 days after surgery. Data presented as LSM and the bars represent s.e.m. (INT = sham operated; OVX = ovariectomized).

Effect of ovariectomy on udder, mammary parenchyma (PAR) and fat pad (MFP) mass. Gross weights and weights adjusted to BW for udder (MG), mammary PAR and MFP from heifers ovariectomized (OVX; n = 8) or sham operated (INT; n = 12) either at 2, 3 or 4 months of age and tissue harvested 30 days after surgeryFootnote †

† Data presented as LSM ± s.e.m.
1 Significance declared at P ⩽ 0.05.
2 P-value for treatment effect.
3 P-value for age effect.
4 P-value for interaction effect between treatment and age.
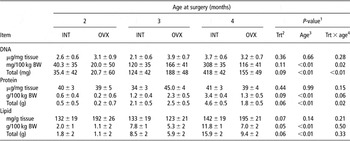
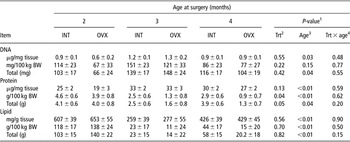
Proximate composition of DNA, protein and lipid in mammary PAR in terms of tissue concentration (wt/wt), quantity adjusted to BW as well as total amount present in PAR are provided in Table 3. In mammary PAR, there was no treatment effect for concentrations of DNA or protein within the tissue but there were tendencies for reductions in both in ovariectomized heifers when expressed on either a BW or total basis. The amount of lipid in PAR per 100 kg BW was reduced in OVX heifers (P = 0.05). There was an overall increase in PAR protein and lipid with increased age (P < 0.01). The amounts of DNA and protein were reduced in PAR of OVX compared with INT when surgery was performed at 4 months of age, but not in earlier surgery groups (treatment and age interaction effect, P < 0.01).
Effect of ovariectomy on proximate composition of mammary parenchyma (PAR). Amount of DNA, protein and lipid in the mammary PAR from heifers ovariectomized (OVX; n = 8) or sham operated (INT; n = 12) either at 2, 3 or 4 months of age and tissue harvested 30 days after surgeryFootnote †

† Data presented as LSM ± s.e.m.
1 Significance declared at P ⩽ 0.05.
2 P-value for treatment effect.
3 P-value for age effect.
4 P-value for interaction effect between treatment and age.
In MFP, content of DNA and lipid did not differ between treatments but protein was reduced in OVX heifers (Table 4). All the variables measured for the proximate composition of MFP were affected by age (P < 0.05). Overall, there was an increase in the amount of DNA with age while protein and lipid reduced with age (Table 4).
Effect of ovariectomy on proximate composition of mammary fat pad (MFP). Amount of DNA, protein and lipid in the MFP from heifers ovariectomized (OVX; n = 8) or sham operated (INT; n = 12) either at 2, 3 or 4 months of age and tissue harvested 30 days after surgeryFootnote †

† Data presented as LSM ± s.e.m.
1 Significance declared at P ⩽ 0.05.
2 P-value for treatment effect.
3 P-value for age effect.
4 P-value for interaction effect between treatment and age.
Histomorphometry
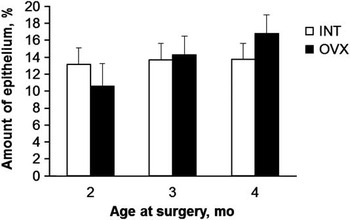
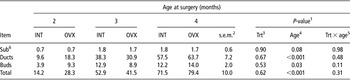
Epithelial proportion of mammary PAR in INT and OVX heifers are shown in Figure 2. The percent area of epithelium present in PAR was not different between INT and OVX (13.5 ± 1 v. 13.9 ± 1; P = 0.85). Neither did we find any difference in the proportion of epithelium present between age groups (P = 0.33) nor there was interaction between treatment and age (P = 0.46; Figure 2). In addition, the number of different types of mammary ducts was not impacted by treatment (Table 5). However, as the heifers matured there was an increase in the number of ductal structures as well as buds resulting in an overall increase in the total number of epithelial structures (Table 5). The number of large subtending ducts was similar among different age groups (P = 0.08).
Effect of ovariectomy on the percent area of epithelium present in mammary parenchyma (PAR). Proportion of epithelium present in unit area of PAR from Holstein heifers ovariectomized (OVX; n = 8) or sham operated (INT; n = 12) either at 2, 3 or 4 months of age and tissue harvested 30 days after surgery. Data presented as LSM and the bars represent s.e.m. There was no difference in the amount of epithelium present between INT and OVX heifers (P = 0.845) or between age at surgery (P = 0.334) and there was no interaction effect between treatment and age (P = 0.459).

Effect of ovariectomy on the number of different mammary ducts. Number of different types of mammary ducts in heifers ovariectomized (OVX; n = 8) or sham operated (INT; n = 12) either at 2, 3 or 4 months of age and tissue harvested 30 days after surgeryFootnote †

† Data presented as LSM.
1 Significance declared at P ⩽ 0.05.
2 Standard error of mean for treatment × age interaction.
3 P-value for treatment effect.
4 P-value for age effect.
5 P-value for interaction effect between treatment and age.
6 Subending ducts.
In contrast, epithelial stratification was altered in OVX animals. In general, OVX animals had two well-defined epithelial layers throughout most parenchymal structures, whereas INT animal frequently had areas where the parenchymal layers appeared more stratified. Accumulations of three to five cell layers in INT animals were commonly observed, but were rarely observed in OVX animals. Patterns of epithelial stratification were somewhat obscured by the thickness of the paraffin section (overlapping nuclei, etc.), but became evident with extended and practiced observation.
Immunohistochemistry for Ki67
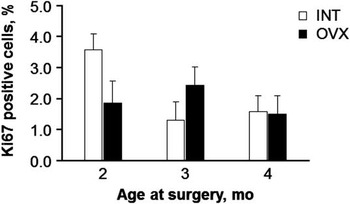
We did not find any difference in the number of proliferating epithelial cells between INT and OVX heifers based on Ki67 immunohistochemistry (P = 0.65; Figure 3). Of the total epithelial cells counted, ∼2% cells were positive for Ki67. There was no difference in the number of Ki67 positive cells between different age groups (P = 0.17) and no interaction among treatment and age (P = 0.09).
Effect of ovariectomy on mammary epithelial proliferation. Immunofluorescence staining for Ki67 in the mammary epithelial cells from INT (n = 12) and OVX (n = 8) heifers. Number of Ki67-positive cells was not different between treatments (P = 0.652) or age groups (P = 0.167) and there was no interaction between treatment and age (P = 0.099). Data presented as LSM and the bars represent s.e.m. (INT = sham operated; OVX = ovariectomized).

Relative mRNA abundance for stanniocalcin, TFPI and PCNA
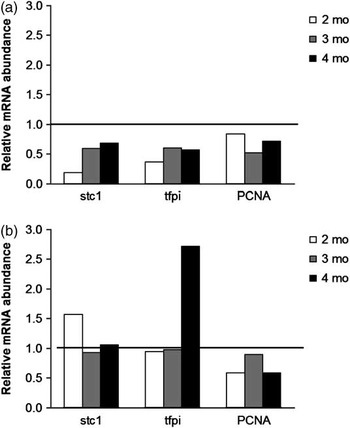
Relative mRNA expression of estrogen-responsive genes STC1 and TFPI as well as the proliferating cell marker PCNA were downregulated in PAR from ovariectomized heifers (P < 0.05; Figure 4a). Relative expression of STC1 increased linearly with age (P = 0.05), but no other genes evaluated were changed by age. There was no interaction between treatment and age for mRNA expression for the genes measured in PAR. Relative mRNA expressions of STC1, TFPI and PCNA in MFP were not affected by treatment or age (Figure 4b), and there was no interaction between treatment and age.
Effect of ovariectomy on relative mRNA expression in mammary parenchyma (PAR) and fat pad (MFP). Relative mRNA expression (2−ΔΔCt) of stc1, tfpi and PCNA in mammary PAR and MFP from OVX heifers (n = 8) relative to INT (n = 12) heifers either at 2, 3 or 4 months of age and tissue harvested 30 days after surgery. The horizontal line at onefold level indicates the mRNA expression in INT heifers. (a) Relative expressions of stc1, tfpi and PCNA in PAR were downregulated in OVX relative to INT (P < 0.05). (b) Relative gene expressions in MFP were not different between treatments or different age groups and there was no interaction between treatment and age (INT = sham operated; OVX = ovariectomized).

Discussion
On the basis of data from the limited range of prepubertal bovine ovariectomy studies that have evaluated mammary development, we hypothesized that the magnitude of response to ovariectomy would be age-dependent. We interpreted the available data to indicate that the degree to which prepubertal mammary development was ovary-dependent changed over time. Our results indicated that, at least through the first 4 to 5 months of prepubertal mammogenesis, that the ovary maintains a role in promoting parenchymal development.
Our study is the first to specifically examine whether the age at ovariectomy affects the subsequent physiologic response. Previous studies have either used fixed ages at ovariectomy (e.g. Wallace, Reference Wallace1953; Purup et al., Reference Purup, Sejrsen, Foldager and Akers1993; Ballagh et al., Reference Ballagh, Korn, Riggs, Pratt, Dessauge, Akers and Ellis2008) or utilized animals with a broader range of starting ages (e.g. Berry et al., Reference Berry, Jobst, Ellis, Howard, Capuco and Akers2003a). We also made the decision to use a laparoscopic approach knowing that in these very young heifers the reproductive tract is positioned in a relatively extreme caudal position and has not achieved sufficient rostral elongation to easily facilitate the laparoscopic ovariectomy approach we utilized. As a result the surgery is somewhat challenging and all ovariectomies must be verified at slaughter. But, this approach, compared with a midlateral incision, avoids possible impacts on developing mammary vasculature. Two of our OVX animals had ovarian remnants and were excluded from further analyses.
The other reason for our unbalanced animal numbers for analysis of parenchymal effects was that two heifers in the OVX group had nearly undetectable parenchymal tissue. In these two cases, tissue appearance was visually similar to mammary glands from very young heifers as illustrated in Capuco and Akers (Reference Capuco and Akers2010), with little or no detectable parenchymal tissue when the glands were dissected. Both of these animals were in the youngest age group (2 months at surgery). Importantly, the lack of parenchymal development was not related to either reduced BW or rate of gain in these two heifers compared with cohorts. One of the excluded heifers was among the heaviest in the treatment group, while the other was the second smallest and slight parenchyma was detected in the smaller heifer. Our result is both problematic and exciting. Had we included, for example, a parenchymal weight estimate close to zero in our statistical analysis, the variation would have been extreme, that is, several g v. a few mg. Regardless, we were unable to accurately remove or sample the parenchymal tissue for quantitative analysis; therefore, exclusion seemed a logical choice. Consequently, our statistical analyses were adversely affected by the reduced power. Nonetheless, the appearance of this seemingly extreme biological effect suggests that our age at ovariectomy hypothesis has merit. Specifically, it appears that if ovariectomy is performed before the onset of rapid PAR development that subsequent PAR development is completely blocked. Our assertion is certainly supported by Wallace (Reference Wallace1953) who showed that ovariectomy at birth prevented subsequent parenchymal development. Purup et al. (Reference Purup, Sejrsen, Foldager and Akers1993) also noted that two heifers ovariectomized before 2.5 months of age had no detectable parenchymal tissue when the animals were slaughtered several months later. Thus, by excluding these heifers in our study, we are presenting a very conservative interpretation of the response.
An important point to emphasize is that physiological changes occur at a very rapid pace in these very young animals. As we have reported (Akers et al., Reference Akers, Ellis and Berry2005), changes in growth of PAR mass between 30 and 90 days of age in Holstein heifers is dramatic and exponential ∼60-fold compared with an approximate doubling of BW during the same period. Given that the selection of 2 months of age as a starting age for ovariectomy was somewhat arbitrary; we propose that the excluded animals (those without dissectible PAR) were ovariectomized before this initial rapid increase in PAR growth. Certainly, there is a continuum of development of the mammary epithelium across the prepubertal period. Thus, some animals likely exhibit the onset of rapidly increasing PAR growth earlier than others. Based simply on age, some animals are likely further along this continuum of development than others. Thus, we propose the two animals in the 2-month group with failed parenchymal development were by chance ovariectomized before onset of rapid parenchymal development.
Even without the excluded heifers, we observed a statistically significant reduction in PAR growth in heifers ovariectomized at 2, 3 or 4 months of age and evaluated 30 days after surgery. This reduction in parenchymal weights corresponds with previous findings in heifers that were evaluated several months after the time of ovariectomy (Purup et al., Reference Purup, Sejrsen, Foldager and Akers1993; Berry et al., Reference Berry, Howard, Jobst, Jiang and Akers2003b). As the age at slaughter was different for each group, we deemed it appropriate to express tissue weights and composition on a BW basis. In contrast to Purup et al. (Reference Purup, Sejrsen, Foldager and Akers1993), there was no overall difference in MFP weights between OVX and INT. The lack of difference was unexpected but suggests that the impact of ovariectomy on MFP development does not become evident until >30 days following ovary removal. An alternative conclusion is that unlike PAR, MFP development in very young prepubertal heifers is indeed ovary independent. We did not anticipate that the MFP mass would be greater in heifers at 3 months compared with heifers sampled at 4 and 5 months. Although there was no significant effect of age on MFP DNA expressed on a BW basis, heifers sampled at 4 and 5 months of age had smaller MFP mass (Table 2) and four- to eightfold less MFP lipid (128, 16 and 29 g/100 kg BW, 3, 4 and 5 months, respectively). On the basis of the analysis of tissue composition, it seems that there was minimal proliferation of MFP cells in either OVX or INT animals between 2 and 5 months (i.e. lack of DNA accumulation) but decreases in lipid accumulation in MFP adipocytes. The impact of these metabolic changes on subsequent development of mammary PAR is unknown but evidence for this phenomenon in the MFP of prepubertal heifers has not been previously reported. In retrospect, the lack of comparable data on MFP development probably reflects a bias for mammary biologists and lactation physiologists to focus on the epithelial components of the developing mammary gland. Given the longstanding dogma that the MFP is essentially for progressive development of mammary ducts and future lobulo-alveolar growth, our observations highlight how little we understand about interactions between these tissue compartments in the udder of prepubertal heifers.
Amounts of DNA, protein and lipid in PAR and MFP were comparable with previous reports taking into account the age and BW of the animals at slaughter (Purup et al., Reference Purup, Sejrsen, Foldager and Akers1993; Meyer et al., Reference Meyer, Capuco, Ross, Lintault and Van Amburgh2006b; Daniels et al., Reference Daniels, Capuco, McGilliard, James and Akers2008). In response to ovariectomy, protein and DNA content of PAR were reduced only in the 4-month age group. However, there was a significant reduction in the lipid content of PAR in ovariectomized heifers (Table 3). Therefore, a portion of the overall reduction in PAR mass can be attributed to reduced lipid accumulation. In the case of MFP, the amount of protein was reduced in response to ovariectomy with no change in DNA or lipid. Others have reported a significant reduction of protein and DNA in parenchymal and extra-parenchymal tissues when heifers were ovariectomized at 2.5 months of age and mammary tissues were collected 6 months after surgery (Purup et al., Reference Purup, Sejrsen, Foldager and Akers1993).
The general histological appearance of mammary PAR resembles that seen in previous reports (Capuco et al., Reference Capuco, Ellis, Wood, Akers and Garrett2002; Ballagh et al., Reference Ballagh, Korn, Riggs, Pratt, Dessauge, Akers and Ellis2008). We observed extensive branching and ductular elongation in PAR sections, especially in older animals. Purup et al. (Reference Purup, Sejrsen, Foldager and Akers1993) reported less epithelium and lumen and more stromal area along with more number of large ducts in ovariectomized heifers. But, it is important to remember that these effects were evident several months after the time of ovariectomy. We did not find differences in the percent epithelial area or the presence of different-sized ducts in response to ovariectomy. We observed large multilayered ducts along with branching and budding of small ducts in both treatments. But, as in the report by Ballagh et al. (Reference Ballagh, Korn, Riggs, Pratt, Dessauge, Akers and Ellis2008), we also noted altered epithelial stratification patterns in OVX heifers, generally two layers in OVX, v. three to five layers in INT animals. The reduced stratification could be indicative of reduced growth rates, emerging changes in the pattern of morphogenesis or similar growth alterations. It is not clear whether the altered patterns of epithelial stratification would have diverged further if the treatment period was longer than 30 days, but the observations from the study by Ballagh et al. (Reference Ballagh, Korn, Riggs, Pratt, Dessauge, Akers and Ellis2008) suggest that such divergence is likely. Thus, ovariectomy may well produce subtle but important alterations in patterns of ductal development and/or changes in lineages of cell types within developing ducts. For example, the enhanced accumulation and apparent differentiation of myoepithelial cells as observed by Ballagh et al. (Reference Ballagh, Korn, Riggs, Pratt, Dessauge, Akers and Ellis2008) after ovariectomy supports the idea that the ovary is important in setting patterns of cell interactions within the developing ductular structures.
Coinciding with the histomorphometry, ovariectomy did not affect the proliferation of epithelial cells as evidenced by Ki67 immunohistochemistry. The fact that PAR mass was reduced but there was no difference in cell proliferation rate is difficult to explain. It is possible that cell death rates were altered, but this was not evaluated in this study. Although it is known that there are regional differences in the proliferation rate of MECs, our sampling scheme was consistent, that is, tissue was collected from a random area of the mid-parenchyma. On the other hand, the relative gene expression of another proliferation antigen PCNA in PAR was consistently reduced in OVX heifers (Figure 4).
Our failure to note a reduction in epithelial proliferation coincides with the lack of changes in protein and DNA content of PAR. There was a 10-fold decrease in epithelial proliferation along with an increase in the proportion of ERα-positive epithelial cells in ovariectomized heifers when ovaries were removed between 1 and 3 months of age and samples collected at 6 months of age (Berry et al., Reference Berry, Jobst, Ellis, Howard, Capuco and Akers2003a). Even though the age at which surgeries were performed overlap between the two studies, we failed to show a reduction in cell proliferation in our study. This may reflect the relative short interval (30 days) between ovariectomy and tissue collection. In agreement with our observations, Meyer et al. (Reference Meyer, Capuco, Boisclair and Van Amburgh2006a) did not find an effect of ovariectomy on MEC proliferation when the heifers were ovariectomized at 4.6 months and samples harvested after 33 days.
Although estrogen-mediated epithelial cell proliferation is well documented in rodents, only a few reports are available on estrogen-induced proliferative responses in prepubertal bovine mammary gland. The epithelial cell proliferation increased within 72 h of estradiol administration in prepubertal heifers (Capuco et al., Reference Capuco, Ellis, Wood, Akers and Garrett2002). Woodward et al. (Reference Woodward, Beal and Akers1993) showed that exogenous estradiol, but not progesterone, increased cell proliferation in prepubertal heifers. Effects of estrogen on mammary gland are believed to be predominantly mediated through the nuclear receptor ERα (Connor et al., Reference Connor, Wood, Sonstegard, da Mota, Bennett, Williams and Capuco2005). But, ironically, most of the proliferating cells are ERα negative (Saji et al., Reference Saji, Jensen, Nilsson, Rylander, Warner and Gustafsson2000; Capuco et al., Reference Capuco, Ellis, Wood, Akers and Garrett2002). This suggests a paracrine action of estrogen in eliciting its mitogenic effects.
Unlike Ki67-positive cells we did measure a significant reduction in the mRNA expression of PCNA in the PAR as a result of ovariectomy. Likewise, selected estrogen-responsive genes were reduced by ovariectomy. Stanniocalcin is involved primarily in calcium and phosphorus homeostasis and both circulating levels and local expression of stanniocalcin-1 in mammary gland increase in response to exogenous estrogen (Li et al., Reference Li, Meyer, Van Tassell, Sonstegard, Connor, Van Amburgh, Boisclair and Capuco2006; Meyer et al., Reference Meyer, Capuco, Ross, Lintault and Van Amburgh2006b; Tremblay et al., Reference Tremblay, Delbecchi, Loiselle, Ster, Wagner, Talbot and Lacasse2009). Tissue factor pathway inhibitor precursor is a serine protease inhibitor and gene expression of TFPI in mammary gland increases in response to estrogen (Li et al., Reference Li, Meyer, Van Tassell, Sonstegard, Connor, Van Amburgh, Boisclair and Capuco2006). Neither STC1 nor TFPI were reported to be affected by ovariectomy in a recent study using microarray analysis (Li et al., Reference Li, Meyer, Van Tassell, Sonstegard, Connor, Van Amburgh, Boisclair and Capuco2006). They reasoned that the failure to find a difference in gene expression in their study may partially be due to older age (∼4.5 months) of heifers at ovariectomy. Therefore, the results from this study suggest that some changes in gene expression were affected by ovariectomy, and there are indications that such effects are related to the age at ovariectomy.
In mouse mammary glands, the non-epithelial cells in MFP are required for normal as well as estrogen-induced cell proliferation (Cunha et al., Reference Cunha, Young, Hom, Cooke, Taylor and Lubahn1997). Further, proliferation of epithelial cells as a result of exogenous estrogen administration was greatest in PAR regions adjacent to MFP (Capuco et al., Reference Capuco, Ellis, Wood, Akers and Garrett2002). However, very little work has been carried out in evaluating the ovarian regulation of gene expression in prepubertal MFP. We showed considerable abundance of mRNA expression of STC1, TFPI and PCNA in MFP. However, gene expression in MFP was not affected by ovariectomy. Others have also reported that relative mRNA expression of estrogen-responsive genes in MFP was similar in both OVX and INT heifers (Meyer et al., Reference Meyer, Capuco, Boisclair and Van Amburgh2006a).
The study described in this report demonstrates a persistent requirement for ovarian secretions, a differential endocrine regulation of PAR and MFP development and provides information to address the temporal progression of the ovariectomy effect. Our study also highlights the need to better understand the cell lineages involved in parenchymal development. The data also provide impetus for further analysis of stromal development, especially in relation to the timing and duration of allometric parenchymal development.
Acknowledgements
The authors extend their gratitude to Dr. Kristy Daniels (Department of Animal Science, Ohio State University) for technical as well as intellectual support. The authors also thank Cathy Parsons (Virginia Tech) for technical support. In addition, we would like to acknowledge Katherine Ballagh and Nancy Korn (Clemson University) for their assistance with animal care and tissue collection. This project was supported by National Research Initiative Competitive Grant no. 2006-35206-16699, ‘Ovarian Regulation of Stem Cells and IGF-I Axis Molecules in Prepubertal Heifer Mammary Gland’ to R. M. Akers and S. E. Ellis from the USDA National Institute of Food and Agriculture.