Implications
Previous studies have reported on the adaptability of African indigenous Sanga cattle breeds (Bos taurus africanus) to harsh subtropical climates. Unfortunately, Sanga breeds are often regarded as inferior in terms of meat quality mostly because they are judged by their conformational similarity to B. indicus. In this study, we compared a variety of Southern African Sanga breeds and the Brahman and also investigated the underlying reasons for their variation in meat quality potential. Favourable results will help to establish the breeds under investigation as breeds suitable for challenging environmental conditions with regard to performance, yield and product quality. Previous studies focussed on one or two Sanga breeds in comparison with other breeds and no thorough study has been undertaken to explain the basis for variation in meat quality among Sanga breeds and in comparison with B. indicus, which is normally known for tougher meat.
Introduction
Cattle indigenous to Africa were often in the past misnamed as B. indicus, based on their phenotype, whereas Meyer (Reference Meyer1984) showed that most of these breeds are more related to Bos taurus than B. indicus. They are believed to be a variation of crosses between humpless Hamitic longhorn cattle (B. taurus) from Arabia, Zebu cattle from Asia (B. indicus) and possibly humpless shorthorn cattle from Spain (Payne, Reference Payne1964; Schoeman, Reference Schoeman1989). As the migration of man continued southwards, new breeds and types evolved with some predominantly Zebu, such as the Boran, Masai, Sokoto and others, such as the Sanga types (also known as Bos taurus africanus; Afrikaner, Nguni (NG) and Tuli), showing genetic markers unique to both B. taurus and B. indicus cattle types (Meyer, Reference Meyer1984). The Bonsmara (BO), a composite indigenous African breed, originated from a 5/8 : 3/8 combination of the Afrikaner (indigenous) and Shorthorn/Hereford (Bonsma, Reference Bonsma1980) to take advantage of the combination of the growth performance, carcass quality, fertility and mothering ability of British breeds (which was lacking for the Afrikaner at that stage) and the hardiness of the Sanga. The Drakensberger (DR) is believed to be a commercially improved Sanga (Anonymous, 2000).
B. indicus cattle breeds are very popular in regions where tropical environmental challenges such as ticks, heat, drought and poor grazing exist. However, delayed age at puberty (Plasse et al., Reference Plasse, Warnick and Koger1968; Cartwright, Reference Cartwright1980), lower vigour of newborn calves (Reynolds et al., Reference Reynolds, De Rouen, Moin and Koonce1980), less intramuscular fat (Huffman et al., Reference Huffman, Williams, Hargrove, Johnson and Marshall1990; Whipple et al., Reference Whipple, Koohmaraie, Dikeman, Crouse, Hunt and Klemm1990b) and less tender meat (Crouse et al., Reference Crouse, Cundiff, Koch, Koohmaraie and Seideman1989; Wheeler et al., Reference Wheeler, Savell, Cross, Lunt and Smith1990; Shackelford et al., Reference Shackelford, Koohmaraie, Miller, Crouse and Reagan1991) resulting from high percentage B. indicus (Brahman (BR)) seem to set the platform in countries such as South Africa, United States and Australia to consider other breeds to fulfil these challenges. The specific qualities of tropically adapted Sanga cattle breeds are well documented. They are known for high fertility (Maule, Reference Maule1973), low inter-calving periods (Scholtz, Reference Scholtz1988), ease of calving (Schoeman, Reference Schoeman1989), cow efficiency (kg calf/kg cow; Schoeman, Reference Schoeman1989), are adapted to poor grazing conditions, for example, due to maintenance of high blood urea (Meissner and Roux, Reference Meissner and Roux1982; Osler et al., Reference Osler, Meyer, Linington and Van der Merwe1993) and have a high tick resistance (Afrikaner: Bonsma, Reference Bonsma1980; NG: Schoeman, Reference Schoeman1989).
Recent reports show that Sanga and Sanga-derived breeds have carcass and meat quality attributes that compare favourably to those of British and Continental breeds and are often better than those of the B. indicus breeds and crosses under commercial grain finishing systems (e.g. Gazzola et al., Reference Gazzola, O’Neill and Frisch1999; Strydom et al., Reference Strydom, Naudé, Scholtz and Van Wyk2000a and Reference Strydom, Naudé, Scholtz and Van Wyk2000b; Frylinck et al., Reference Frylinck, Strydom, Smith and Heinze2001; Wheeler et al., Reference Wheeler, Cundiff, Shackelford and Koohmaraie2001; Casas and Cundiff, Reference Casas and Cundiff2003). In this study, variation in meat tenderness and other physical characteristics between Sanga and Sanga-derived breeds and between Sanga and BR (B. indicus) was investigated. In addition, supportive histological, chemical and biochemical evidence was provided to explain the variation in these quality characteristics. Previous studies have focused on fewer breeds and/or lacked supportive data to explain differences among breeds and breed types.
Material and methods
Experimental design and feedlot phase
Animals of three indigenous Southern African breeds (Sanga or B. taurus africanus), viz. NG, DR and Tuli, of one Sanga-related breed, viz. BO (composite) and BR (B. indicus) were selected from a larger group of animals (Strydom et al., Reference Strydom, Frylinck, Van Der Westhuizen and Burrow2008) to investigate certain histological, biochemical and physical properties of the loin muscle (M. longissimus thoracis et lumborum). Twelve animals of each breed were selected and slaughtered at three different market endpoints, the first endpoint representing the typical domestic (South African) specification (SL1) and the second (SL2) and third (SL3) being of heavier weight specification to determine the breeds’ suitability for foreign production systems and markets. The average days on feed (after adaptation) were of 91 ± 5 (SL1), 140 ± 5 (SL2) and 169 ± 5 days (SL3), respectively, and four animals per breed were slaughtered at each endpoint. The processing, housing and feeding of the animals were described in detail by Strydom et al. (Reference Strydom, Frylinck, Van Der Westhuizen and Burrow2008), but in summary all animals were implanted with Ralgro® (Zeranol 36 mg; Intervet/Schering-Plough Animal Health, Gauteng, South Africa) after adaptation to the feedlot diet, followed by a Revalor-S® implant (140 mg of Trenbolone Acetate and 28 mg β-oestradiol; Intervet/Schering-Plough Animal Health) 49 days later. Animals were kept in 10 × 20 m pens, holding five to ten animals per pen and the pens were equipped with Calan gate self-feeders (American Calan Inc., Northwest, NH, USA). The feedlot diet was grain-based and provided 11 MJ ME/kg energy, 13.5% crude protein, 0.4% phosphorus, 0.8% calcium and 8% crude fibre on a dry matter basis.
Slaughter and sampling procedures
All animals were slaughtered, processed and sampled at the abattoir of the Animal Production Institute (Agricultural Research Council, Irene, Gauteng, South Africa). Carcasses were electrically stimulated for 60 s after exsanguination (400 V peak, 5 ms pulses at 15 pulses/s) and entered the cold rooms 45 min after killing. Warm and cold carcass weights were recorded. Samples for muscle fibre typing were collected from the M. longissimus lumborum (LL, between the fourth and fifth lumbar vertebrae) before electrical stimulation. Carcasses were classified according to the official South African classification standards for age (by dentition) and fatness (visual appraisal; Agricultural Product Standards, 1999). Muscle pH and temperature of the M. longissimus thoracis (LT, between the last two ribs) were recorded with a digital hand-held meat pH meter (Sentron, Model 1001, Sentron Technologies, Roden, The Netherlands) at 1, 2, 3, 4 and 18 h post mortem to describe the course of pH and temperature decline and the ultimate pH (pHu). The LT and LL of both carcass sides were sampled between the third last rib and last lumbar vertebra on the day after slaughter. Samples were collected for measurements of colour, tenderness determined by shear force (SF), sarcomere length, muscle fibre type, drip loss, water holding capacity (WHC), collagen properties, chemical composition and proteolytic enzyme activities. Sarcomere length, drip loss, water-holding and colour measurements were performed on fresh samples (<2 days post mortem). Samples for the remaining tests were vacuum packaged and frozen (−20°C or −70°C) or aged at 2°C ± 2°C for 14 or 21 days post mortem, depending on the type of test.
Muscle biochemistry
Samples collected for enzyme studies (24 h post mortem) were frozen in liquid nitrogen and preserved at −70°C. Calpastatin in combination with μ-calpain and m-calpain was extracted from 5 g of the LL frozen samples as described by Dransfield (Reference Dransfield1996) and separated by means of the two-step gradient ion-exchange chromatography method according to Geesink and Koohmaraie (Reference Geesink and Koohmaraie1999). Calpain assays were determined by using azocasein as substrate according to Dransfield (Reference Dransfield1996). The use of azocasein eliminates the problem of background absorbance of non-specific proteins in the extracts. One unit of calpain activity was defined as an increase in absorbance of 1.0unit/h at 366 nm and 25°C. One unit of calpastatin activity is defined as the amount that inhibited one unit of m-calpain activity. Data were expressed as units/g of muscle.
Frozen samples of the LL were analysed for collagen content and solubility according to the method described by Bergman and Loxley (Reference Bergman and Loxley1963), Hill (Reference Hill1966) and Weber (Reference Weber1973).
Histological measurements
Samples for sarcomere lengths of fresh LL samples (24 h post mortem), were prepared according to the method of Hegarty and Naudé (Reference Hegarty and Naudé1970) by using distilled water instead of Ringer–Locke solution (Dreyer et al., Reference Dreyer, Van Rensburg, Naudé, Gouws and Stiemie1979). Fifty sarcomeres per sample were measured by means of video image analysis (VIA) using an Olympus B × 40 system microscope at a ×1000 magnification equipped with a CC12 video camera (Olympus, Tokyo, Japan). AnalySIS Life Science software package (Soft Imaging Systems Gmbh, Münster, Germany) was used to process and quantify measurements.
Myofibril fragment lengths (MFLs) of LL aged for 2, 14 and 21 days post mortem were measured by means of VIA. Myofibrils were extracted according to Culler et al. (Reference Culler, Parrish, Smith and Cross1978) as modified by Heinze and Bruggemann (Reference Heinze and Bruggemann1994). Hundred myofibril fragments per sample were examined and measured with an Olympus B × 40 system microscope at ×400 magnification.
Muscle fibre typing of the LL was performed on 100 g samples removed directly after exsanguination and frozen in liquid nitrogen. For histochemical demonstration of succinic dehydrogenase situated in the mitochondria, the nitro-blue tetrazolium technique of Malaty and Bourne (Reference Malaty and Bourne1953) was used. Fibres were classified under ×100 magnification by means of VIA into red or slow oxidative (SO), intermediate or fast oxidative glycolytic (FOG) and white or fast glycolytic (FG) according to the intensity of the staining reaction. Fibre cross-sectional areas were also determined by VIA.
Chemical composition, drip loss, WHC and colour of fresh meat
Samples of the LL were ground for proximate analyses of protein, fat, moisture and ash (Association of Official Analytical Chemists, 1990).
Drip loss was measured using 50 g of fresh LL (24 h post mortem) sliced into cubes of 10 × 10 × 20 mm that were suspended on a pin inside a sample bottle (200 ml). Duplicate samples were stored for 3 days at 4°C ± 2°C. Drip loss percentage was calculated as:

WHC was determined by calculating the ratio of meat area and liquid area after pressing a 400 to 600 mg meat sample on a filter paper (Whatman 4) sandwiched between two perspex plates, and pressed at constant pressure for 5 min according to the method described by Grau and Hamm (Reference Grau and Hamm1953). The areas were measured by means of a VIA (Soft Imaging System, Olympus, Japan) described by Irie et al. (Reference Irie, Izumo and Mohri1996) and WHC was expressed as the area of the meat divided by the area of the moisture.
Meat colour was measured with a Minolta meter (Model CR200, Osaka, Japan) on fresh samples (24 h post mortem). Two freshly cut steaks of 15 mm thickness each of the LL were allowed to bloom for 60 min at chiller temperatures (4°C ± 2°C) before recording. Three recordings were performed on each steak. The data were obtained as L* (dark to light); a* (green to red) and b* (blue to yellow) values from which the physiological attribute of chroma (S (saturation index) = (a2 + b2)1/2) was calculated (MacDougall, Reference MacDougall1977).
Warner–Bratzler SF measurements
Samples for Warner–Bratzler SF were aged for 2 and 21 days post mortem and then were frozen (−20°C). Once frozen, the samples were processed into 30 mm steaks by means of a band saw. The frozen steaks were thawed at 4°C for 24 h and then were cooked using an oven-broiling (Mielé, model H217, Mielé & Cie, Gütersloh, Germany) method with direct radiant heat (American Meat Science Association (AMSA), 1995). The steaks were broiled at 260°C (pre-set) to 70°C internal temperature and cooled down to 18°C. Eight round cores (12.7 mm diameter) were removed from the steaks parallel to the long axis of the muscle fibres (AMSA, 1995). Each core was sheared once through the centre, perpendicular to the fibre direction, by a Warner–Bratzler shear device mounted on a Universal Instron apparatus (Model 4301, Instron Ltd, Buckinghamshire, UK; crosshead speed = 200 mm/min). SF was measured as the peak force (kg) average for eight cores per sample.
Statistical analyses
The data were subjected to analysis of variance (GenStat® VSN International, Hemel Hempstead, UK; Payne et al., Reference Payne, Murray, Harding, Baird and Soutar2007) breed and slaughter group as main effects. The data were found to be normally distributed with homogeneous treatment variances. No significant interactions between breed and slaughter group were detected for any characteristic, and for the sake of the objectives of this study, the data of all three slaughter groups were pooled for each breed. Treatment means were separated using Fisher’s protected t-test least significant difference at the 5% level of significance.
Results
Carcass weight and fatness; pH and temperature decline
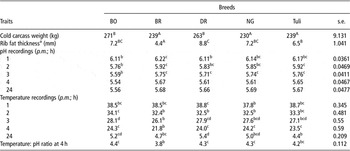
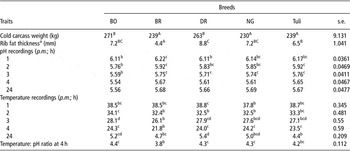
DR and BO produced heavier carcasses than those of NG, Tuli and BR after an average 132 days on feed (P < 0.05; Table 1). BR carcasses had less rib fat cover than the other breeds (P < 0.01). As a result of carcass size and leanness, BR carcasses chilled faster than BO and DR carcasses (P < 0.05) according to loin muscle temperature at three and four hours post mortem. As a result of electrical stimulation, commencement of rigor (pH = 6) occurred within 2 h post mortem when muscle temperatures were still above 30°C. BO loins showed a faster pH decline than other breeds and reached pH = 5.5 by 4 h post mortem.
Breed comparisons for cold carcass weights, rib fat thickness and LT pH and temperature recordings at different times p.m.
LT = longissimus thoracis; p.m. = post mortem; BO = Bonsmara; BR = Brahman; DR = Drakensberger; NG = Nguni.
aRib fat thickness measured between the 10th and 11th rib over the broadest part of the LT.
b,c,dMeans within the same row with different superscripts differ significantly at P < 0.05.
A,B,CMeans within the same row with different superscripts differ significantly at P < 0.01.
SF tenderness
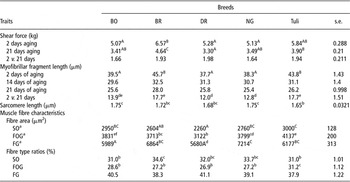
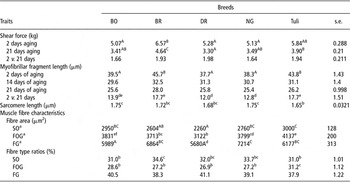
BR loins had higher (P < 0.01) SF values at 2 d post mortem than all other breeds except the Tuli, which did not differ from any breed group (Table 2). Prolonged aging decreased the mean SF by 1.6 to 2.0 kg among breeds. Aged loins of BO, DR and NG were still significantly more tender than BR loin after 21 days, whereas the SF of Tuli loins was higher than the SF of DR loins.
Breed comparisons for shear force tenderness and histological measurements
BO = Bonsmara; BR = Brahman; DR = Drakensberger; NG = Nguni; SO = slow oxidative; FOG = fast oxidative glycolytic; FG = fast glycolytic.
aSO: red; FOG: intermediate; FG: white.
b,c,d,e,fMeans within the same row with different superscripts differ significantly at P < 0.05.
A,B,CMeans within the same row with different superscripts differ significantly at P < 0.01.
Muscle histology
Variation in MFL at 2 days post mortem mirrored the variation in SF among breeds, with breeds showing lower SF also recording shorter MFL (Table 2). At 14 and 21 days post mortem, the differences among breeds were not significant, whereas the changes in MFL between 2 and 14 and 2 and 21 days post mortem were higher for Tuli and BR samples (P < 0.05), indicating a higher degree of fragmentation over the length of aging. Tuli loins had shorter sarcomere lengths than BO and NG loins (P < 0.05).
DR had the smallest fibre area for all fibre types and differed significantly from all breeds for FOG area (P < 0.05), from BO, NG and Tuli for SO area and from BR and NG for FG area (Table 2). In addition, Tuli had larger SO areas than BR (P < 0.05) and NG had larger FG areas than BO and Tuli (P < 0.05). Tuli had higher FOG fibre ratios than all other breeds (P < 0.05), whereas BR had higher SO fibre ratios than BO and Tuli (P < 0.05).
Muscle biochemistry
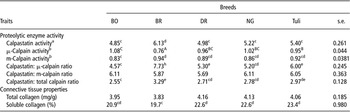
BR had higher calpastatin activity and calpastatin: μ-calpain ratio and lower μ-calpain activity than other breeds (P < 0.05; Table 3). Tuli had a higher calpastatin: μ-calpain ratio than BO, DR and NG (P < 0.05) and DR had higher ratios than BO. Tuli also had higher μ-calpain activity than BO (P < 0.05).
Breed comparisons for biochemical characteristics of LL

LL = M. longissimus lumborum; BO = Bonsmara; BR = Brahman; DR = Drakensberger; NG = Nguni.
aCalpastatin activity: one unit of calpastatin activity is defined as the amount that inhibited one unit of m-calpain activity.
bOne unit of calpain activity is defined as an increase in absorbance at 366 nm of 1.0 absorbance unit per gram of muscle per hour at 25°C.
c,d,eMeans within the same row with different superscripts differ significantly at P < 0.05.
A,B,C,Means within the same row with different superscripts differ significantly at P < 0.01.
No differences were found for collagen content among breeds, but BR loins had less soluble collagen than loins of DR, NG and Tuli (P < 0.05).
Muscle colour, moisture and cooking-related properties
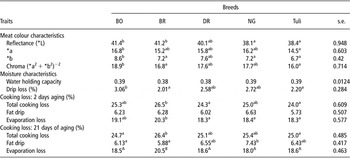
NG and Tuli loins recorded lower values for light reflectance (L*) compared with BO and BR (P < 0.05). BO loins also recorded higher a* values than Tuli loins and also higher b* values than BR, NG and Tuli loins (Table 4). Consequently, BO loins showed higher chroma values than BR and Tuli loins (P < 0.05).
Breed comparisons for colour, moisture and cooking related characteristics of LL steaks

BO = Bonsmara; BR = Brahman; DR = Drakensberger; NG = Nguni.
a,bMeans within the same row with different superscripts differ significantly at P < 0.05.
A,BMeans within the same row with different superscripts differ significantly at P < 0.01.
Drip loss for BO loins was higher compared with Tuli and BR loins (P < 0.05; Table 4). On the other hand, BR recorded higher cooking losses for samples aged for 2 days than Tuli and DR due to higher evaporative losses compared with NG, DR and Tuli (P < 0.05). These differences persisted with extended aging (21 days).
Discussion
Tenderness-related characteristics
Most of the tenderness-related results in this study clearly distinguish BR (B. indicus) from Sanga breeds (B. taurus africanus). However, some variation also existed among the Sanga breeds with Tuli associating more with BR than with the other Sanga breeds.
Comparison between BR and Sanga
Various studies support the differences in meat tenderness found between Sanga breeds and B. indicus or indicus-related breeds and some gave supportive results to explain the differences. Strydom et al. (Reference Strydom, Naudé, Scholtz and Van Wyk2000b) and Frylinck et al. (Reference Frylinck, Strydom, Smith and Heinze2001) found lower SF values for BO, NG and Afrikaner (Sanga) compared with Santa Gertrudis (indicus related) and BR, respectively. Herring et al. (Reference Herring, Sanders, Knutson and Lunt1996) reported lower SF values for the Tuli, compared with the Boran (African B. indicus). The disposition of the BR in general is attributed to a lack of aging ability caused by lower calpain activities, higher calpastatin activities or both (Johnson et al., Reference Johnson, Calkins, Huffman, Johnson and Hargrove1990; Wheeler et al., Reference Wheeler, Savell, Cross, Lunt and Smith1990; Whipple et al., Reference Whipple, Koohmaraie, Dikeman, Crouse, Hunt and Klemm1990b; Shackelford et al., Reference Shackelford, Koohmaraie, Miller, Crouse and Reagan1991; Pringle et al., Reference Pringle, Williams, Lamb, Johnson and West1997). In this study, favourable lower calpastatin (inhibitor) and higher calpain activities accompanied the low SF of BO and other Sanga breeds relative to those of BR. In support, Frylinck et al. (Reference Frylinck, Strydom, Smith and Heinze2001) also reported higher calpastatin and lower calpain activities for BR compared with BO, NG and Afrikaner (Sanga). Variation in MFL among breeds, especially at 2 days post mortem, corresponded with the variation in proteolytic enzyme activity showing less fragmentation for BR loins in early post mortem compared with the other Sanga breeds except for the Tuli. Whipple et al. (Reference Whipple, Koohmaraie, Dikeman and Crouse1990a) found similar differences between B. indicus and B. taurus breeds for MFI (a myofibrillar fragmentation measurement tool similar to MFL), although the differences remained significant throughout 14 days of aging as opposed to this study. The relatively higher rate of fragmentation (measured as differences between 2 and 21 days MFL) for BR (and Tuli) with prolonged aging suggested delayed aging for the tougher breeds, although this was not reflected in final SF values (21 days).
In certain studies (e.g. Koch et al., Reference Koch, Dikeman and Crouse1982), the disposition of the B. indicus breeds was often confounded by differences in carcass weight and/or fatness, and therefore, susceptibility to cold shortening, although Johnson et al. (Reference Johnson, Calkins, Huffman, Johnson and Hargrove1990) and Wheeler et al. (Reference Wheeler, Savell, Cross, Lunt and Smith1990) attempted to minimize any confounding by slaughtering the cattle at similar fat. In this study, cold shortening probably did not play a role, as witnessed by comparison of sarcomere length and pH and temperature decline (Tables 1 and 2), despite the fact that BR carcasses were leaner than those of other breeds (Table 1). All breed groups also reached the onset of rigor (theoretically at pH = 6) within 2 h post mortem, when the muscle temperature was between 32°C and 34°C on average and reached final pH before the average muscle temperature dropped below 20°C (Table 1).
It is believed that total fibre composition (fibre area and ratios of fibre types) could influence muscles to have different abilities to release and sequester Ca2+, activate ATPase activities, produce adenine nucleotides, stimulate glycolysis, produce lactate and decrease post mortem pH and thereby influence the rate and amount of aging (Seideman et al., Reference Seideman, Crouse and Cross1986; Lefaucheur, Reference Lefaucheur2010). However, according to Table 2, the fibre characteristics of NG and BR were very similar, yet their tenderness measurements supported by proteolytic enzyme activities showed large differences in favour of NG. The effect of fibre type and size variation on tenderness is therefore inconclusive. Taylor (Reference Taylor2004) also suggested that differences in fibre characteristics found between breeds would rather relate to differences in colour between breeds than to differences in meat tenderness.
BR had significantly less soluble collagen than DR, NG and Tuli (P < 0.05), although this characteristic had no linear relationship with SF. According to Seideman et al. (Reference Seideman, Koohmaraie and Crouse1987) and Wheeler and Koohmaraie (Reference Wheeler and Koohmaraie1994), meat tenderness (and other qualities, like colour and juiciness) is mostly influenced by conditions of rigor development and subsequent degradation of myofibrillar, cytoskeletal and associated proteins and to a far lesser extent by stromal protein (connective tissue) in animals of the same age.
Comparison among Sanga breeds
No previous studies reporting collectively on the meat quality of Sanga breeds (Strydom et al., Reference Strydom, Naudé, Scholtz and Van Wyk2000a; Frylinck et al., Reference Frylinck, Strydom, Smith and Heinze2001) have included the Tuli and DR. For the Tuli, most reports made comparisons with B. indicus, British or European breeds. Shackelford et al. (Reference Shackelford, Koohmaraie and Wheeler1995) found no differences in SF tenderness of Tuli, Hereford, Angus, Piemontese and Belgian Blue. Wheeler et al. (Reference Wheeler, Cundiff, Shackelford and Koohmaraie2001) reported Tuli loins as second most tender after Angus and then followed by Hereford, Belgian Blue, Boran and BR after 14 days of aging. The trend towards higher SF values for Tuli compared with other Sanga breeds (P < 0.05 for DR v. Tuli at 21 days) in this study was therefore unexpected. Like BR, higher SF values of the Tuli coincided with higher (P < 0.05) calpastatin: μ-calpain ratios and 2-day MFL values. The calcium-dependent protease system (CDP) was probably also the main contributor to SF differences between Tuli and other Sanga breeds (Ferguson et al., Reference Ferguson, Bruce, Thompson, Egan, Perry and Shorthose2001; Koohmaraie and Geesink, Reference Koohmaraie and Geesink2006), since other measurements did not give conclusive evidence for variation among Sanga breeds but could also have had smaller contributions. No other references to the CDP system of Tuli compared with other breeds could be found, but O’Connor et al. (Reference O’Connor, Tatum, Wulf, Green and Smith1997) reported no difference in calpastatin activity between B. indicus composites and tropically adapted B. taurus (Senegus) composites.
Tuli sarcomere lengths were significantly shorter (P < 0.05) than those of NG and BO, but similar to those of DR, and ironically recorded the lowest SF values at 21 days. Despite this contradiction, SF and sarcomere length did show a slightly negative relationship of r = −0.39 and r = −0.28 at 2 and 21 days of aging. Considering the actual sarcomere length, Marsh and Leet (1966, as cited by Takahashi et al., Reference Takahashi, Lochner and Marsh1984) found that a shortening of <20% produced almost negligible effects on beef tenderness. If the resting sarcomere length of bovine muscle is taken as 2.1 μm (Marsh and Carse, 1974, as cited by Takahashi et al., Reference Takahashi, Lochner and Marsh1984), then percentage shortening on average for the Tuli was 23% and <20% or less for the rest of the breeds (20% for DR). The generally larger fibre size of the Tuli (Table 2) could also be indicative of shortened fibres (Taylor, Reference Taylor2004). Considering the above contradictions, sarcomere length could have contributed to the slightly tougher meat of the Tuli together with other factors discussed previously.
External effects on tenderness development
BO had a faster decline in pH and a slower chilling rate than the other breeds and was, at all stages, significantly different from the BR due to higher carcass weights (and relatively fatter). The ratio of temperature to pH at 4 h post mortem was significantly lower for the BR compared with the other groups (Table 1). Whether pH/temperature ratios in the development of rigor played a mayor role in tenderness differences is uncertain, although high temperature/pH ratio at 4 h was moderately related to a downward effect on SF at 2 days (r = −0.4) and slightly less after prolonged aging (r = −0.34). Rapid rigor resulting in low pH with higher muscle temperatures significantly increases the rate of calpain autolysis (Koohmaraie, Reference Koohmaraie1992). The net effect is that rapid rigor development produces rapid tenderization in the first 24 to 48 h with little or no further change following subsequent aging in extreme conditions (Dransfield, Reference Dransfield1994). It is possible that BO has gained some benefit from such conditions (compared with BR), although effects demonstrated by Dransfield (Reference Dransfield1994) occurred under more extreme pH/temperature conditions (such as with stimulation and no stimulation). In this study, the pH/temperature conditions were not so extreme that it greatly affected the prolonged aging. Furthermore, although the other breeds had similar post mortem conditions as BR, their (NG and DR) SF values at both 2 and 21 days were much lower. Therefore, other factors also accounted for the variation in tenderness.
Meat colour and moisture characteristics
Variation in colour and water-binding characteristics can be related to variation in the glycolysis rate and muscle temperature decline. Offer (Reference Offer1991), Den Hertog-Meischke et al. (Reference Den Hertog-Meischke, Smulders, Van Logtestijn and Van Knapen1997) and Hector et al. (Reference Hector, Brew-Graves, Hassen and Ledward1992) demonstrated excess myosin denaturation resulting in a more open structure, paler appearance (higher L*; MacDougall, Reference MacDougall1982) and higher purge when fast pH decline and/or slow muscle temperature rates occurred (e.g. electrical stimulation or not). Under these conditions, the more open structure was also responsible for the greater initial bloom (a* and higher chroma) allowing oxygen penetration further into the muscle and formation of more oxy-myoglobin (Sammel et al., Reference Sammel, Hunt, Kropf, Hachmeister, Kastner and Johnson2002) but faster deterioration of colour over time. Smaller but similar differences in the relative rates of pH and temperature decline of BO compared with other breeds probably caused the higher L*, a*, chroma and drip loss values of BO, although these arguments do not explain the high L* value of BR (Table 4). In general, high values for colour attributes and drip loss were associated with low pH values both before and during rigor (r = −0.5 to −0.71 between a*, b*, chroma, drip loss on one side and pH at 4 and 24 h post mortem) and was probably enhanced by slower temperature decline. From these arguments, it can be concluded that the limited variation in colour and moisture characteristics among breeds is a function of the physical factors, such as carcass size and fatness, which influence pH and temperature decline. Although BR, Tuli and NG had relatively large FG (white fibre) areas compared with the other breeds, these differences gave no conclusive evidence towards the variation in colour characteristics as suggested by Taylor (Reference Taylor2004).
At both 2 and 21 days of aging, the BR had the highest evaporation loss when steaks were broiled, leading to high overall cooking losses. The BR was leaner than the other breeds and less fat drip loss and proportionally more evaporation loss were expected.
Conclusions and recommendations
The CDP supported by MFL provided the best explanation for variation in meat tenderness (according to SF) between Sanga breeds and BR, and among Sanga breeds. Neither prolonged aging nor electrical stimulation could overcome these differences. It seems that the Tuli has a slight disposition in terms of tenderness when compared with other Sanga breeds. Small (but significant) differences in other quality-related characteristics, such as colour and drip loss, occurred among Sanga breeds and between Sanga and BR, but most of these could be attributed to small variation in rigor conditions.
Acknowledgements
Ina van Heerden, Elsa Visser, Janice van Niekerk, Jocelyn Anderson and Hanlie Snyman of the Agricultural Research Council (ARC)–Animal Production Institute (API) assistance in sensory evaluation, biochemistry and histology. Feedlot and abattoir personnel of ARC–API for assistance in the rearing and processing of experimental animals and carcasses. The ARC for facilities and financial support.