
Summary of key findings
• The response rate was 78.6%; good, but not amongst the best (section 3);
• Nine percent of respondents failed to meet the SLS Statement of Standards 3.1 on space and physical facilities, through not housing all relevant collections in one place (section 6);
• The ratio of students to seats has worsened to its least favourable since statistics were first collected in the 1990s, with a median of 5.70 students to every seat in study areas by the law collection and a mean of 8.20 students per seat. Some respondents noted the difficulty of accurately identifying such seating where the law collection is just one of many collections or activity areas on a particular floor of the library building (section 7);
• Some respondents noted difficulties when trying to identify accurately the number of PCs workstations earmarked specifically for the use of law students. Broadly, the results indicated a stable or slightly improved provision of PCs (section 8);
• WiFi access was almost universally available within libraries in general and other, non-specific parts of the university, but much less frequently available in the law collection itself and the law school in particular (section 8);
• Thirty-three percent of respondents reported an increase in the number of visits to the law library; 56% said numbers were constant and 11% reported a fall. These results must be qualified for the majority of reports were based on subjective, personal observation rather than objective, gate logs or head counts (section 9);
• More libraries were open longer during term-time weekdays than previously. There was a dramatic increase in the number of libraries providing 24-hour access to print collections. Both term-time weekend and vacation opening hours have continued to increase (section 10);
• Staffed issue services were available for slightly longer, on average, than previously (section 10);
• More libraries were providing enquiry desk services during a term-time week within the range of 35 to 40 hours a week (section 10);
• Sixty-four percent of libraries serving distance leaning students provided three basic services: a link to the library catalogue, a link to full text databases and full text of materials scanned into the VLE. This is a considerable improvement on the 43% in 2006 (section 11);
• The three most popular law databases in terms of number of subscriptions continued to be Westlaw UK, Lexis®Library and HeinOnline. But there was still great fluidity in the range of subscriptions held, for 23% of respondents were considering cancelling a subscription to an electronic source before the end of July 2011 whilst 14% were considering a new subscription before the same date (section 12);
• More than half of respondents – the highest percentage ever – said they had cancelled subscriptions to the print version of law material during the current year, where the same resource was available electronically (section 14);
• Law journals were most frequently cut, followed by practitioner encyclopedias, legislation, law reports and, finally, government publications. Cuts were made on the basis of the availability of an electronic alternative and jurisdiction played little part in the decision (section 14);
• Mean expenditure increased by less than 1% on the level in 2009. Whilst old universities reported modest increases in expenditure, new universities and other types of institutions reported falls (section 15.1);
• The proportion of total law material expenditure on monographs remained stable at 22%, serials were down slightly at 54% and databases up slightly at 25% (section 15.2);
• Separate results on overall expenditure on law library materials in institutions not providing vocational or professional award courses are provided for the first time (section 15.6);
• In general, a much higher proportion of income to fund the acquisition of law materials came from general library funds than ever before (section 16);
• Over half of all law schools made no contribution to funding the acquisition of law materials, a higher percentage than in past years. However, of those that did, they appeared to do so more generously than last year (section 16.1);
• A slightly lower percentage of responding libraries this year did not have any library staff which spent 50% or more of their working time on the care and servicing of the law collection. However, several wrote of their activities either being diluted into library-wide responsibilities or the law collection being serviced from a team of staff with wider subject duties (section 17);
• Staffing levels declined across all sectors and at all levels of post. As a proportion, fewer staff possessed library and information science qualifications, but slightly more than last year possessed a law qualification (sections 17.1 to 17.4);
• Ninety percent of respondents were aware of the revised SLS Statement of Standards (2009 version) and as many as 55% had used the Statement in discussions on funding and administration (section 18);
• In 2006 a majority of respondents considered that only a marginal move to electronic provision of legal materials would occur in the next five years. In 2011 a majority considered a significant move towards electronic provision likely in the next five years (section 19);
• A majority of respondents felt that over the next five years the proportion spent in their library on the purchase of law monographs as compared with law serials would be constant, but nearly a third thought the balance would move marginally in favour of serials (section 19);
• Over two thirds of respondents considered that over the next five years the proportion spent on purchasing legal materials relating to the law of Great Britain and European Union as compared with foreign and international law would remain constant (section 19).
1. Introduction
The following report outlines the activities and funding of academic law libraries in the UK and Ireland in the academic year 2009/2010. The figures have been taken from the results of a postal questionnaire undertaken by Information Services staff at Cardiff University on behalf of the Society of Legal Scholars (SLS).
This survey has been run on an annual basis since 1996 and reported in The Law Librarian and latterly in Legal Information Management. It is sponsored either by the British and Irish Association of Law Librarians (BIALL) or by SLS.
I shall attempt to draw comparisons with previous surveys where helpful. In particular “2009” refers to the 2008/2009 data (Clinch, Reference Clinch2010) “2008” refers to the 2007/2008 data (Clinch, Reference Clinch2009), “2006” refers to the 2005/2006 data (Clinch, Reference Clinch2007). All the previous surveys referred to are referenced at the end of the report.
2. Methodology
The survey methodology followed the format of previous years. In January 2011 a questionnaire was dispatched to 112 institutions in the UK and Ireland, an increase of one in the number surveyed. This was a recently founded university in the south of England which offered an undergraduate law course for the first time during 2009/2010. As in the past research centres with no students or only small numbers of postgraduates where the main university law library was invited to respond to the survey, were excluded. For similar reasons, the Oxbridge college libraries were excluded but, as usual, responses from the Bodleian and Squire law libraries were invited. The text of the questionnaire was made available on the BIALL website at www.biall.org.uk.
3. Response rates
This year 88 forms were returned representing a response rate of 78.6%, a slight decrease on last year's 82.9%, and well below the record of 85.4%, set in 2003/2004. I am grateful to all those law librarians who took the time to respond. I do not know the reasons for non-returns. On our part we try to be flexible and have permitted some respondents to take up to nine weeks to send in a promised reply.
The fall of the response rate to below 80% is a concern but should still permit the presentation of a reasonably accurate picture of academic law libraries in the British Isles.
To help detect patterns in law library provision, the data have been analysed, as in previous years, by type of institution:
• “old” universities incorporated before 1992;
• “new” universities incorporated in or after 1992;
• institutes of higher education and other types of institution.
Forty-five old universities responded (46 last year), as did 38 new universities (41 last year) and 5 other institutions (5 last year). The response profile has changed, with over 7% fewer responses from new universities. This may have affected comparisons with past results.
4. Definitions
In many of the following sections, the survey responses are analysed using range, mean and median.
• The range indicates the smallest and the greatest value of the responses and helps us understand the diversity of responses.
• The mean has been calculated by adding up all the responses and dividing by the number of responses to get an “average”. The mean can be distorted by one or two responses which are very large or very small.
• The median is the mid point and is calculated through ordering the responses by size from the smallest to the greatest and finding the middle response. There will be an equal number of responses below the median and above the median and so it provides a benchmark of what a “typical” university is doing.
All percentages from this point onwards have been rounded to the nearest whole number.
5. Student numbers
A representation of the number of law students served by the libraries helps in understanding the framework in which provision is made and can assist librarians in comparing their provision with institutions of similar sizes.
Respondents were asked to indicate the total number of taught course students (bodies, not FTEs) in the Law School enrolled on exempting undergraduate law degrees or professional or academic postgraduate courses in law. All eighty eight respondents gave figures for student numbers, ranging from 49 to 7,884 (74 to 6,570 in 2009). The median number of law students was 682 (694 in 2009). The mean number however was 903 (902 in 2009).
Respondents in old universities reported student numbers between 75 and 1,730 (75 to 1,626 last year), with a mean of 817 (785 last year) and a median of 833 (717 last year). In new universities, the range was 114 to 3,180 (74 to 3,200 last year), with a mean of 771 (last year: 827) and a median of 544 (last year: 600). Amongst the five other institutions, the number of students varied hugely as usual and included three small schools and the two largest law schools in the survey, with numbers ranging from 150 to 7,884 (2009: 220 to 6,570). The mean was 2,834 (2009: 2,581) and the median was 364 (2009: 362), an increase of 10% in the mean and a negligible change in the median on last year (2009: mean: decrease 22%; median decrease 22%).
Some significant movements are evident in the number of students attending responding institutions in 2009/2010 as compared with the previous year. The mean and median amongst old universities are both higher whilst the same measures for new universities are considerably lower. This could be due to the slightly changed survey response profile.
Eighty-five or 97% of respondents (90 or 98% in 2009) offered an exempting undergraduate law degree. Thirty or 34% of respondents (34 or 37% in 2009) hosted the Legal Practice Course (LPC), Bar Vocational Course (BVC) or Diploma in Legal Practice (Scotland). This represents 24% of old university respondents, 45% of new universities and 40% of other institutions. Twenty-six or 30% (29 or 32% in 2009) of respondents provided courses leading to other law professional awards, such as the Common Professional Examination or Institute of Legal Executives qualification. Seven percent of old universities, 50% of new universities and 80% of other institutions ran such courses. The final category was for other taught courses, such as LLM, which led to a postgraduate award in law. Seventy-six or 86% (82 or 89% in 2009) of institutions ran these postgraduate taught courses, including 93% of old and 84% of new universities and 40% other institutions.
The movements in the percentages of respondents offering particular courses this year, as compared with last year, are relatively small.
Respondents also indicated whether the law school enrolled students onto research courses, such as those leading to PhD and MPhil. Sixty-five or 74% (67 or 73% in 2009) of institutions indicated that they did. Ninety-six percent of old universities, 58% of new universities and 0% of other institutions had such students. Research students were not included in the count of law students detailed above.
This year we again asked about the number of students enrolled on distance learning courses for law. The question was last posed in 2008. Twenty-four institutions or 27% (2008: 22 or 25%; 2006: 25 or 28%) offered this mode of study. Student numbers ranged from 6 to 1,500 (2008: 12 to 1,324; 2006: 3 to 733), though one institution was unable to give a figure for the number of students enrolled. The median number of students was 77 (2008: 81; 2006: 70) and the mean 48 (2008: 51; 2006: 122). Thirteen (29%) percent of old universities had students enrolled on distance learning courses; the number of students ranged from 16 to 374, with a median of 77 students. Nine (24%) of new universities had distance learning students, with numbers ranging from 6 to 1,500, and a median of 47. One (20%) other type of institution had distance learning students, with 188 enrolled. Although, in general, relatively small numbers of students are enrolled on distance courses, libraries provide special support arrangements which are investigated in section 11, below.
6. Location of the law library
Respondents were asked to indicate, from a list, which most closely matched the circumstances in their institution.
• 33% had a single law library in a location separated from other subject collections (37% in 2009). Of these, there were 20 (2009: 24) old universities, 8 (2009: 9) new and 1 (2009: 1) other institution.
• 33% had a law collection not so separated but shelved so as to form a single identifiable unit (33% in 2009). These included 17 (2009: 15) old universities, 11 (2009: 13) new and 1 (2009: 2) other institution.
• 25% had several law collections each in a different location (23% in 2009). These included 5 (2009: 4) old, 14 (2009: 15) new universities and 3 (2009: 2) other institutions.
• 9% had a law collection dispersed wholly or partly among other subject collections (8% in 2009). Of these, 3 (2009: 3) were old universities, 5 (2009: 4) were new universities and 0 (2009: 0) other institutions.
Forty-six percent (2009: 52%) of old universities responding had a single and separate law library, while 21% (2009: 22%) of new universities and 20% (2009: 22%) of other institutions had a single and separate law library.
Thirty-eight percent (2009: 33%) of old universities described their law collection as being shelved so as to form a single identifiable unit but not separate from other collections. Twenty-nine percent (2009: 32%) of new universities described their law collection in a similar way, and 20% (2009: 40%) of other responding institutions.
Eleven percent (2009: 9%) of old universities had several law collections, each in a different location, but 37% (2009: 37%) of new universities and three other institutions (60%) reported several collections (2009: 2, 40%). As in past surveys, the main reason for more than one law collection was the establishment of a separate library targeted at vocational course students (12 respondents), such as those on the LPC or BVC, in addition to a main law collection. Other respondents mentioned other reasons for separate locations: for module texts while main law materials are held elsewhere and separate collections for graduate diploma students. No respondents possessed a separate library targeted at researchers.
The comments to the SLS Statement of Standards 3.1 (Society of Legal Scholars, 2009) on space and physical facilities require “the housing of all relevant collections … as a unified whole in one place …”. This year the figures suggest that this criterion was not met by at least the 9% of institutions reporting dispersed collections. Seven percent of old universities, 13% of new universities and 0% of higher education institutions had law collections wholly or partly dispersed among other subject collections. Last year the figure was also 8% of institutions overall; in detail, in 2009, 7% of old, 10% of new and 0% of other institutions had dispersed collections.
The general response profile for different types of institution has altered a little between last year's and this year's surveys, so the actual institutions responding are different and are the most likely reason for the changes noted.
7. Provision of seating
Respondents were asked to indicate the number of seats in study areas by the law collection/s, excluding workstation places. This question has been asked in alternate years so the data for 2010 can be compared with that for 2008 and 2006.
Eighty-eight institutions provided figures. The figures ranged from 0 to 1,563 with a mean of 204 (2008: 214; 2006: 214) and a median of 120 (2008: 130; 2006: 133). The results must be viewed with some caution. As has been noted in section 6 above, there is a significant number of institutions where the law collection is not separate from other subjects, and respondents have taken different views on how to count the amount of seating which was ‘by the law collection’ as required by the survey question.
A more useful measure is the ratio of students to seats. Eighty-five of the 88 responding institutions were able to provide data for both variables. The ratio ranged from 0.6 to 56.0 students per seat, with a median of 5.70 (2008: 5.41; 2006: 5.64) and a mean of 8.20 students per seat (2008: 8.10; 2006: 6.53). The data were analysed according to the type of institution. The 43 old universities had a ratio of between 0.60 and 15.90 (2008: 0.45 and 30.00; 2006: 0.52 and 15.58) with a median of 4.83 (2008: 4.81; 2006: 5.15). Thirty seven new universities had a ratio of between 0.60 and 56.60 (2008: 0.59 and 87.38), with a median of 7.70 (2008: 6.28; 2006: 7.30). The five other institutions had a ratio of between 1.70 and 13.40 (2008: 3.66 and 13.12; 2006: 0.47 and 10.67), with a median of 4.69 (2008: 8.51; 2006: 2.74).
Sixty percent (2008: 55%; 2006: 45%) of old universities were at or below the overall median ratio of 5.70, as compared with 38% (2008: 45%; 2006: 62%) of new universities and 60% (2008: 50%; 2006: 17%) of other institutions.
A further analysis highlights the differences between the various categories of respondent: 12% of old universities were in the quartile of respondents with the least favourable student to seat ratios, as compared with 38% of new universities and 40% of other institutions (2008: 14%, 33%, 50%; 2006: 12%, 43%, 17%). The percentage of old universities appearing in the quartile with the least favourable student seat ratios, is at the second lowest level since 2000, when it was just 3%, while the percentage of new universities with the least favourable student seat ratios has risen since 2008.
The median ratio of students to seats in a selection of past surveys has been 1994: 3.5:1, 2004: 5.3:1, 2006: 5.6:1 and 2008: 5.4:1). This year's ratio of 5.7:1 is the least favourable ever reported. Some caution should be expressed in using the student : seat ratio, for many librarians noted the difficulty of identifying the number of ‘seats by the law collection’, where the trend in design is towards seating areas provided according to different study environments (silent, quiet, group activity) rather than made available to serve a particular subject.
The ratio may be compared with the former University Grants Committee ratio for law libraries of 2:1. This ratio received indirect endorsement in the Follett Report of 1993. Further, the comments to SLS Standard 3.2 states that ‘a ratio of students per seat exceeding 5:1 should be regarded as high and in need of early reduction, or of compensation through extended opening hours’. The survey results indicate that study space is under continuing pressure from student numbers in all sectors but, as discussed in section 10 below, there continues to be a considerable increase in the opening hours of responding libraries.
8. Workstations
The survey asked respondents to indicate the number of PC or Mac workstations which can access electronic law materials, and are available for law student use:
• adjacent to, or in the same building as, the law collection;
• in the building where the law school is housed.
In response to the first part of the question, a number of respondents noted that although the workstations counted as ‘in the same building as the law collections’ they were shared with non-law students. It was difficult to determine accurately the numbers available for law student use. Further, some respondents not only included fixed workstations but noted the number of laptops available for student use. The questions on workstation provision were devised originally in the mid-1990s, when the SLS was concerned about the level of investment in IT hardware. But since then developments in library facilities and computer technology have made accurate tracking of the relative ease of law student access to IT less reliable.
Eighty-seven respondents (99%) provided figures for the numbers of workstations near the law collections. The numbers ranged from 10 to 1,467–50% (the median) had at least 130 (2008: 126, 2006: 96) and the mean was 218 (2008: 188, 2006: 166). The trend of providing further workstations to complement traditional study places appears to have increased.
Eighty-four respondents (95%) provided figures for the number of workstations in the law school. Of these, 20 law schools did not have any workstations for student use (2008: 19; 2006: 23). For those who did, the range was from 4 to 983, with a mean of 104 (2008: 75, 2006: 84) and a median of 50 (2008: 29, 2006: 52). Whilst the range of numbers remains reasonably constant, the mean and median see-saw; this may be due to changes in the response profile.
The ratio of law students to workstations gives a more effective picture of the levels of provision. The figures for workstations adjacent to the law collections and in the law school were combined for this measure. 86 (2008: 86) institutions were able to provide data for both parts of the ratio.
The ratio ranged from 0.15 to 33.33 students per workstation (2008: 0.36 to 250.00; 2006: 0.61 to 22.92), with a median of 3.80 (2008: 3.44; 2006: 3.25) and a mean of 6.17 (2008: 9.10; 2006: 5.15). Twenty-eight institutions had a ratio of law students to workstations of less than 2 (2008: 23; 2006: 17). When interpreting these figures the comments at the beginning of this section should be noted: the difficulty of identifying accurately the numbers of PCs ‘in the same building as the law collections’, where they were shared with non-law students.
As in the past surveys on this topic, the results for the average law student to workstation ratio were dissimilar in the old and new university sectors. In the 44 old universities, the mean ratio was 7.74 and the median was 5.16 (2008: 13.92 and 5.06; 2006: 6.57 and 4.82). For the 38 new universities, the mean was 4.70 and the median 1.87 (2008: 4.59 and 2.39; 2006: 4.27 and 2.74). The figures for the 5 other institutions were a mean of 3.61 but a median of 3.00 (2008: 3.64 and 3.19; 2006: 1.44 and 1.42).
For the first time a question was included on the provision of WiFi access to law databases in different locations across the institution. All 88 respondents answered. Fifty-seven (65%) provided access adjacent to the law collection; 88 (100%) provided access within the university or college library in part or whole; 73 (83%) in the law school building; 64 (73%) in student halls and 80 (91%) in other parts of the institution to which students have access. It is notable that access is almost universal within the library in general and other, non-specific parts of the university, but much less frequently available in the law collection and law school in particular.
9. Library use
This year we continued to monitor trends in the number of visits to the law library, last measured in 2008. The aim was to determine whether increased access to law databases from outside the university or college campus had affected the number of visits to the library. The question asked respondents to compare the number of visits to the law collections in 2009 with 2010. The question recognised that a level of judgement would be needed but asked respondents to note the basis for their comparison. Eighty-eight institutions responded. Twenty-nine institutions or 33% (2008: 29%; 2006: 30%) saw an increase in visits, in 49 or 56% (2008: 49%; 2006: 52%) the number of visits remained constant, and in 10 or 11% (2008: 19%, 2006: 18%) the number of visits decreased.
Twenty-seven (31%) respondents mentioned more than one basis for comparison. Personal observation was mentioned 55 times (2008: 55), exit gate logs 32 times (2008: 24), SCONUL statistics 16 (2008: 10), issue statistics 4 times (2008: 4), enquiry desk statistics 4 times (2008: 4), occupancy counts not attributed to SCONUL 4 times (2008: 0), shelving statistics once (2008: 2). The continued heavy reliance on personal observation as the basis for comparison might suggest the results are subjective rather than objective. The number of institutions reporting an increase in the number of visits has risen slightly, more than half report stable numbers and considerably fewer than in 2006 and 2008 report a decrease in the number of visits.
10. Opening hours and services
Opening hours were last surveyed in 2008. For the 88 responding libraries (2008: 89; 2006: 91) the median number of term-time weekly opening hours was 84 (2008: 81; 2006: 79). The mean for weekly term-time hours was 92.39 (2008: 89.87; 2006: 84.82). Hours ranged from 50 to 168 (2008: 32 to 168; 2006: 54 to 168). Thirteen libraries (15% of all respondents, all in England except for one in Northern Ireland and eight of which are new universities) stated that they provided 24 hour access throughout the term to their paper-based collections. This is an increase on the 5 new universities in 2008 and 2 new universities in 2006. Twenty-five responding libraries were open for more than 100 hours per week (2008: 18; 2006: 15); they were 12 old, 12 new and 1 other institution (2008: 7 old, 10 new and 1 other; 2006: 6 old, 8 new, 1 other). Seventy percent of institutions offered at least 73 hours (2008: 72.3; 2006: 71 hours) and 25% at least 103 hours (2008: 96; 2006: 93 hours).
Eighty-eight respondents gave details of opening hours in vacation. The median for weekly opening times was 54 hours (2008: 49.6; 2006: 45) and the mean was 60.8 hours (2008: 56.3 2006: 51.7).
The results for term-time weekday opening indicate that more libraries continue to open for longer than ever before. There has been a dramatic increase in the number providing 24 hour access to print collections. Vacation opening hours have continued to increase also.
All 88 respondents gave details of term-time weekend opening. Two did not open on Saturdays (2008: 1; 2006: all opened). The number of institutions opening on Sundays remained constant. In 2010, 89% of institutions (same as 2008) opened as compared with 85% in 2006. The incidence of term-time Sunday opening varied between types of institution, though the gap between old and new universities remains small: 89% of old universities, 95% of new universities, and 40% of other institutions (2008: 87%, 93%, 50%; 2006: 80%, 92%, 71%).
Most of the results for term-time weekend opening in 2009/2010 indicate continued extensions in opening hours.
Information was sought on the time at which the law library closed in a standard term-time week, Monday to Thursday. This information was first sought in the 2002 survey. All 88 respondents provided this information. 13 libraries, comprising 5 old universities and 8 new universities, stated they provided 24 hour access during these days (2008: 11, comprising 3 old and 8 new universities; 2006: 6 libraries, comprising 1 old and 5 new universities). Of the remaining 75 libraries, 19 or 22% (2008: 20 or 23%; 2006: 20 or 24%) closed at 10pm and 14 or 16% (2008: 18 or 20%; 2006: 21 libraries or 25%) at 9 pm. The earliest closing time was 7 pm (2008: 5 pm; 2006: 7 pm) and the latest 2 am (2008 & 2006: 2 am). The median time was 10 pm (the same as in 2008 & 2006). A few respondents closed at different times on different nights over the period Monday to Thursday.
Not all facilities are necessarily available throughout opening hours. To help provide an indication of key opening hours respondents were asked to indicate the number of hours during a term-time week when a book loan service was available for law items. All 88 institutions responded, although one respondent did not operate a book loan service. For the remaining 87 respondents the mean was 68.5 hours (2008: 67.6 hours; 2006: 69.1 hours). The median was 70 hours (2008: 70 hours; 2006: 71 hours). The range was 0 hours to 137.3 hours (2008: 0 hours to 108 hours). Three institutions (two old and one new) reported that there was no staffed issue service. This is considerably less than in 2008 (9 institutions, five old, three new and one other).
This year, the survey results for the availability of a book loan service show a slight increase in the number of hours for which a staffed issue service is available but a considerable fall in the number of institutions with no staffed issue service.
As in 2006 and 2008 we asked whether respondents provide a self-issue system for use with items from the law collection. For 2010, 90% (2008: 83%; 2006: 75%) said they did provide self-issue facilities. As was also noted in the 2006 survey results, institutions which offered a self-issue service were more likely than those which did not, to be open longer than the median number of hours.
88 respondents (100%) indicated the number of hours during term-time weeks that a reader enquiry service for law was provided by professionally qualified staff. Hours when professional staff could only offer a service of referral onto a law specialist were to be excluded. Seven respondents did not provide a reader enquiry service for law (2008: 2; 2006: 4). For the remainder, the mean number of hours for which an enquiry service was available was 36.9 hours (2008: 35.8 hours; 2006: 38.1 hours) and the median was 37 hours (2008 and 2006: 37 hours). The range was 2 to 79 hours (2008: 3 to 76 hours; 2006: 2 to 75 hours). 62% of respondents provided an enquiry service for between 35 and 40 hours per week (2008: 51%; 2006: 57%).
There continue to be slight variations in the number of hours a reader enquiry service is provided but with an enhanced concentration of availability within the range of 35 to 40 hours a week.
As in 2006 and 2008 we asked about membership of reciprocal borrowing schemes. All eighty-eight respondents provided details. Seventy-nine respondents (90%) were members of SCONUL Access (2008: 94%). Thirty-two (36%) were members of SCONUL RX. Thirty-two (36%) were members of regional schemes (2008: 38 or 43%; 2006: 41 or 48%). Seven or 6% were members of other schemes (2008: 5 or 6%; 2006: 11 or 13%) and 5 (6%) provided specialised reciprocal borrowing arrangements with other institutions. HWATL, INSPIRE and RUN were mentioned.
11. Distance learning
At the request of the Society of Legal Scholars we again asked questions this year about special support provided by the law library for distance learning courses. As has been noted in section 5, above, only 24 or 27% of respondents (2008: 25%; 2006: 27%) offered this type of course. Five of these institutions (3 old and 2 new universities) had made arrangements for their distance learning students studying law to have access to a physical (not electronic) law library other than at the institution where they were registered and outside the national reciprocal borrowing schemes mentioned in section 10 above. 3 institutions (two old universities and one new) provided no additional support other than reciprocal borrowing arrangements.
Twenty-two institutions provided additional support to distance learners other than that already described. Fifteen or 68% (2008: 16 or 84%) provided postal delivery of photocopying (subject to copyright), 15 or 68% (2008: 14 or 74%) postal loans, 15 or 68% (2008: 14 or 74%) a phone/e-mail/fax legal research enquiry service, 7 or 32% (2008: 10 or 53%) undertook database searches by library staff on behalf of the distance learning students. Also mentioned, by five respondents (2008: 4) was the provision of study packs of readings, 3 respondents mentioned online tutorials and/or library information placed on e-learning portals and one respondent (2008: 1) provided enhancements to the inter-library loan service. Eighteen respondents or 82% (2008: 95%) offered a package including more than one of the services noted.
Some further questions probed the nature of the additional services a little deeper. All 24 institutions (2008: 100%; 2006: 96%) offering law by distance learning provided access for learners outside the campus to databases and learning materials. Twenty-three or 96% (2008: 95%; 2006: 92%) used a virtual learning environment (VLE) for the delivery of law distance learning courses. All twenty-two of these institutions provided details of how access to law library materials (by which was meant the law and commentary on it) for distance learning students was provided through the VLE. Respondents were asked to include as many means of access as applied. Seventeen or 77% (2008: same) provided links to full text online subscription databases, 18 or 82% (2008: 19 or 86%) provided a link to the library catalogue, 18 or 82% (2008: 19 or 86%) scanned full text material into the VLE. Two respondents mentioned links to web sites other than those for subscription services. Nineteen or 86% (2008: 20 or 91%) institutions provided more than one means of access, with 14 or 64% (2008 13 or 59%) providing all three suggested on the questionnaire: link to library catalogue, link to full text databases and full text of materials scanned into the VLE. This last result continues the improvement from 2006, where only 43% suggested all three means of access.
12. Legal Databases
Contrary to the rest of the questionnaire, respondents were asked to indicate their legal database subscriptions at the present time, rather than in the year 2009/2010. The results below therefore show the position in February 2011.
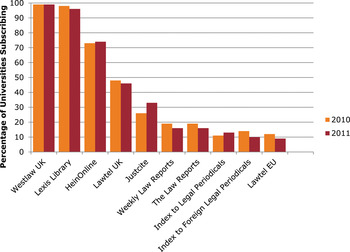
As in recent years, all respondents gave details of subscription databases used in connection with the teaching and research work of the law school. The ten most frequently mentioned law databases are displayed in the graph.
Top 10 legal databases

The law databases' academic market is still fluid but much less than several years ago and about the same as last year. Fourteen percent of respondents (11% last year and 10% the year before) were planning new subscriptions before the end of July 2011 but 23% (26% last year and 24% the year before) noted planned or recent cancellations before the financial year end.
A small number of law databases continue to dominate the market. Westlaw UK was taken by every respondent bar one (99%) and Lexis® Library was taken by all bar four (96% of respondents). Last year Westlaw UK was taken by all respondents and Lexis® Library by all bar two (98%). HeinOnline, retained its market position being taken by 65 or 74% of respondents, keeping the third position it gained in 2007. Lawtel UK held on to 4th place but with a slightly reduced percentage of respondents, with 44 or 46% of respondents (last year: 44 or 48% of respondents) taking the database.
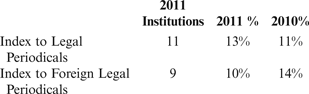
Of the other databases mentioned by respondents small falls were again recorded by Justis Law Reports and Justis Weekly Reports. There were small percentage changes for Index to Legal Periodicals and Index to Foreign Legal Periodicals. Justcite also remained stable in 5th position. Lawtel EU just remained in the top ten, taken by 9% of respondents (12% down on the position in 2010). European databases in general continue to show weakening demand this year.
Looking at the returns for Westlaw UK in more detail, no respondents reported plans to either extend or reduce their coverage of subscriptions in the year to July 2011. Four respondents (2009: 3) subscribed to Westlaw IE (Irish Law). Three were based in the Irish Republic and one in London but one of the Irish respondents did not subscribe to Westlaw UK.
Respondents were asked to indicate the subscriptions they took to particular parts of the Lexis® Library product. Journals on Lexis® Library continued to be the most popular product, taken by 94% of respondents (2009: 97%). The Cases module on Lexis® Library was tied second most popular, taken by 92% of respondents (2009: 95%), with Legislation (2009: 89%). Halsbury's Laws rose one place to fourth, taken by 83% of respondents (2009: 75%) while International Materials were fifth most popular, taken by 78% of respondents (2009: 82%).
Encyclopaedia of Forms and Precedents in electronic format was taken by 49% of respondents (2009: 47%). No other Lexis® Library products were taken by 10% or more respondents. The next most popular were Employment Law by 6% of respondents to Lexis® Library products (2009: 8%), followed by Company and Commercial by 5% (2009: 3%) and the three following by 4% each: Current Awareness (2009: 3%), Family (2009: 3%) and Tax (2009: 4%). The following were taken by 2% each: Civil Procedure (2009: 3%), Local Government (2009: 4%), News & Commentary (2009: not recorded), PSL (2009: not recorded) and Quicklaw (2009: not recorded). A further 10 Lexis® Library databases were each mentioned by less than 2% of respondents. One respondent hoped to take out a subscription to Encyclopaedia of Forms and Precedents (EFP) before July 2011, but, on the other hand, one respondent mentioned cancelling EFP and another possibly cancelling the Journals library. In the latter instance, the results of a comparison of the Lexis® Library content with that of HeinOnline would be the deciding factor. Another respondent was cancelling the News library on Lexis® Library because of duplication with another News-specific database.
HeinOnline retained its third position with a 74% share of the market (2009: 73%). No new subscriptions were mentioned but three respondents were due to cancel or had cancelled during 2010/2011 subscriptions to HeinOnline, one of them mentioning specifically the Legal Classics library, due to lack of use.
Lawtel UK again slipped slightly, dropping to 46% of respondents, from 48% last year. Kemp on Lawtel was listed by two respondents but one was going to cancel it because of the expense for a small LPC cohort. No respondents hoped to subscribe to Lawtel UK but two hoped to cancel subscriptions to Lawtel UK by July 2011 due to cost and budget constraints.
Justis Weekly Law Reports was subscribed to by 14 institutions, representing a fall to 16% of respondents (2009: 19%), Another Justis product, The Law Reports, was also taken by 14 respondents or 16%, a continued fall over the last few years (2009: 19%). Three respondents said they took all Justis products (2009: 3). Six respondents (2009: 9) took the English Reports, still the most popular product apart from Weekly Law Reports and The Law Reports. JustCite increased its share and was mentioned by 29 or 33% (2009: 26%), but two respondents were considering cancelling the subscription on the grounds of under use. One respondent was due to cancel ‘Justis’ by July 2011 but gave no further details. 15 other products were each taken by no more than three respondents each.
Subscriptions to the Current Legal Information (CLI) database continue to decline, down from 88% of respondents subscribing in 2000 to just 5 respondents or 6% in February 2011.
Databases of European legal information continue to be casualties in the changing academic legal database market. Eurolaw has slipped down the list again, subscribed to by just 1 respondent or 1% (2009: 3%), but one also planned to cancel Eurolaw before July 2011 because of cost and under use. Lawtel EU was taken by 8 respondents or 9% (2009: 12%). Two respondents planned to cancel Lawtel EU by July 2011 because of duplication of materials elsewhere and lack of use. Other full text EU databases were taken by only 6 respondents, the equivalent of 7% of respondents (2009: 8%). They included European Sources Online (2 respondents).
The median number of legal database subscriptions taken in responding law libraries in February 2011 was 4, the same as in the three previous years. The numbers of legal databases offered by institutions ranged from 2 to 50 (2009: 2 to 72).
Other than the databases already discussed in detail, the following databases were mentioned by 10% or more respondents:
Other databases mentioned were i-law and Casetrack (8 respondents each), Kluwer International Arbitration and PLC (7 respondents each), Oxford Reports on International Law (6 respondents) and Localaw (5 respondents).
As an indication of the broad range of databases thought to be relevant to the study of law in UK universities, a total of 54 databases other than those already featured were each mentioned by under 10% of survey respondents (2009: 91 databases). The fall in the range of databases may reflect tightening budgets.
All bar one database was accessed via the Internet. The transfer from CD-ROM to the Internet has been rapid and is now almost complete. In 1999 just 32% of legal databases were Internet based.
13. Other databases
In addition to law databases, law schools use a range of more general information databases such as the newspapers which are of relevance to students in a wide range of disciplines. 51 respondents (56%) noted other subscription databases which contribute significantly to the teaching and research work of their law school. This showed a small rise from the 52% recorded last year.
The EBSCO journal subscription service was mentioned by 10 institutions (2009: 12) and IBSS (International Bibliography of the Social Sciences) by just 6 respondents (2009: 7). ISI Web of Science service, the most widely used of the general databases mentioned in 2009 and 2010, held on to this position with 44 respondents (50%) mentioning the service this year (42 or 46% last year).
By February 2011, 53 or 60% of law schools served by responding libraries used a web-based combined newspaper database to access the full range of newspapers (2009: 50 or 54%). The suppliers were Nexis UK used by 30 respondents (2009: 30), Factiva with 6 respondents (2009: 7), Proquest with 5 respondents (2009: 9), Infotrac with 4 respondents (2009: 4), Gale with 4 respondents (2009: 2) and Newsbank with 4 respondent (2009: 1) and UK Newspapers Online with one respondent (2009: 0). No other newspaper databases were mentioned. The results for this year indicate the continued popularity for Nexis UK, with only slight changes in the subscriber newspaper databases used to contribute significantly to teaching and research in the law school.
ASSIA was mentioned by 28 respondents (32%), the same as recorded last year.
Bookdata was not used by any law school (2009: 3%). Thirty-four respondents mentioned a total of 41 (2009: 49) other cross-disciplinary or social science indexes or electronic journal providers which contributed significantly to the teaching and research work of the law school. Criminal Justice Abstracts was mentioned by 18% of respondents, EBSCO Academic Search or Business Source Premier by 11% of respondents, JSTOR by 8% and IBSS by 7%.
14. E-journals and e-books
Every other year since 2004, we have asked questions about electronic journals and books, a sector of the publishing market which has developed rapidly in the last few years. We repeated the same questions as used in 2008, to try to gauge the impact electronic materials are having on print subscriptions.
Eighty-two, or 93% of respondents (2008: 79, 89%; 2006: 75, 82%), said they subscribed to an electronic journal database which includes law titles, excluding Lexis® Library, Westlaw UK, HeinOnline, e-journal gateways (e.g. Swets) and special deals (e.g. NESLI). The pattern across different types of institution showed increased take-up amongst new universities and other types of institution on previous years. Forty-three were old universities (2008: 45; 2006: 41), 37 were new universities (2008 & 2006: 32) and 5 (2008 & 2006: 2) were other types of institution.
However, as a result of subscribing to a law e-journal database 39, or 44%, of those with access had cancelled a print subscription to a law journal (2008: 27 or 30%; 2006: 20 or 22%). Twenty (2008: 17; 2006: 12) old universities, 16 (2008: 10; 2006: 7) new universities and 2 (2008: 0; 2006: 1) other institutions had replaced a law journal print subscription with electronic access.
An increasing number of institutions: 45 or 51% of respondents (2008: 39 or 44%; 2006: 33 or 36%) said they had cancelled subscriptions to the print version of law material during the current year where the same resource was available electronically. They were 24 old universities, 18 new and 3 other types of institution.
As in 2006 and 2008 we sought information about the impact electronic subscriptions were having on print subscriptions. Were institutions starting to cut specific print subs when the same material was available electronically? Which types of print publication were being cut? Were there differences in the cuts made by the different types of institution?
Forty-one institutions (2008: 38) provided details of the titles of print materials they had cancelled where the same material was available electronically. They comprised 24 old institutions, 15 new and 2 other. A further six respondents (2008: 2) said there were too many titles to list! Of those who sent lists at least one extended to nearly two sides of A4 in small typeface! On these superficial measures alone cuts are biting.
Excluding instances where respondents said they were cancelling duplicate subscriptions to leave only a single subscription, a total of 425 print titles (2008: 290; 2006: 186) were cancelled. That number excludes a) three respondents (2008: 1) stating ‘all print journals on Westlaw UK/Lexis’, b) one respondent who cancelled several US National Reporter series and several Canadian law reports, but did not provide details of how many and c) one respondent who cancelled tax loose-leaf works (no details) to pay for the Lexis® Library Tax module. All this adds up to more cancellations than was recorded in either 2006 or 2008.
In 2006 the cancellations axe fell most heavily on practitioner encyclopedias with 63 titles cancelled. In 2008, this was down to 33 cancellations. In 2010, although 47 cancellations were reported this number was dwarfed by the number of cancellations of journals (see below). Of the practitioner titles cancelled, five were subscriptions to Halsbury's Laws, by one old university and four new universities.
In 2008 the bulk of all cancellations (197) fell on law journals and law reports, especially where they were available on the large databases such as Westlaw UK and LexisNexis Butterworths (as it then was called). In 2010, a record 299 law journal or law report titles was cancelled, comprising 276 law journal and 23 law report titles. Looking only at journals, old universities mentioned 241 (95 in 2008) which had been cancelled, whilst new universities mentioned 33 (31 in 2008) and other institutions 2 (18 in 2008). Many fewer law reports titles were cancelled: 17 by old universities (2008: 13), 5 by new universities (2008: 15) and 1 by one other type of institution (2008: 25). The titles cancelled in many instances were not specialised or esoteric but often featured such core titles as Cambridge Law Journal, Common Market Law Reports, Criminal Law Review, Family Law, Family Law Reports, Journal of Law and Society and Public Law. Further, the jurisdictional spread of both law report and law journal titles cancelled was wide, covering not just the UK but also the EU, international law, US, Canada, France, Germany, Israel and Russia. The decision to cancel appeared to be motivated not just by the availability of an electronic equivalent, but also a desire to reappraise the worth of titles to the current aims of law teaching and research in the institution.
In 2008 only one subscription to Halsbury's Statutes was reported cancelled. In 2010 the picture was quite different, with four subscriptions gone (2 old universities and 2 new universities) as well as two subscriptions (both by new universities) to Halsbury's Statutory Instruments.
Finally, some 14 official publications and 26 titles containing legislation published by a range of jurisdictions including the EU and the UN were cancelled.
In summary, this snapshot of cancellations indicates that the priority for cancellation appears to remain with law journals and law reports including, though not exclusively, those available electronically. Practitioner encyclopedias feature more often than in 2008. The print versions of all three Halsbury's publications have been cancelled in larger numbers than previously.
We asked two new questions to gain an impression of which parts of the law collection had sustained cuts and why. Of the 72 respondents who reported cuts 28 or 39% reported the cuts falling equally on UK and foreign, comparative and international (FCIL) materials, 26 or 36% more heavily on UK materials and 10 or 14% more heavily on FCIL materials.
Sixty-three respondents gave reasons for where the cuts fell, some citing several different factors. By far most frequently cited (21 times) was the availability of materials in electronic format, resulting in the cancellation of print subscriptions. A number of respondents commented that jurisdiction was immaterial; format was the driver, along with student preference for electronic versions. Second most frequently mentioned (15 times) was that the cuts had to fall on UK materials because there were either, very few or no FCIL materials held.
The remaining reasons which were cited seven or fewer times, related to the driver for cancellations rather than what the question was trying to ascertain: the jurisdictional nature of the cuts. One respondent noted that the reduced law materials budget ‘was primarily because of the spiralling cost of Science Direct’. Thus, it was not just a matter of priorities within the law budget but priorities within the university acquisitions budget as a whole which were driving cuts. Another respondent commented that since their collection contained a large proportion of FCIL material, the weakness of the pound was driving cuts in this area. Other drivers mentioned by respondents were changes to law course content (4 times) and reviews of the relevance of materials to the teaching and research aims of the school (3 times).
As in 2006 and 2008 we asked about subscriptions to e-book publishers. Eighty-five respondents (2008: 77) listed the e-book publishers to which they subscribed for law titles. They were 43 old universities and 37 new universities and all 5 other types of institution. 55 subscribed to Dawsonera (2008: 41), 51 subscribed to My-i-library (2008: 51), 37 subscribed to NetLibrary (2008: 31), 30 to Oxford Scholarship Online (2008: 8), 22 to E_brary (2008:); 6 to EBL (2008: 0), 5 to Cambridge Books/Companions Online (2008: 0), 3 to Taylor and Francis e-books (2008: 4) and the remaining 8 e-book publishers were subscribed to by two or fewer respondents.
15. Expenditure
Eighty-five of the 88 respondents were able to provide total expenditure figures for 2009/10. Those respondents who could not either worked to a different financial year than the standard or could not disaggregate law expenditure from other subjects.
15.1 Total expenditure on law materials
Total expenditure on the acquisition of law materials ranged from £17,839 to £1,273,900 (2009: £34,097 to £1,177,057). Mean expenditure was £165,396 (2009: £163,898), less than a 1% increase on 2009, and is the lowest percentage increase for many years.
It is helpful in understanding these changes to compare the expenditure in the different types of institution.
Old universities
43 responses (2009: 45)
Range £35,919 to £638,550; median £173,908, up 10% on 2009; mean £178,324, up less than 0.4% from last year. 75% of old universities spent at least £102,940 (up 1.4% on last year) and 25% spent more than £212,293 (up 6.9% on last year).
New universities
37 responses (2009: 41)
Range £36,000 to £459,600; median £96,343, down 17% on 2009; mean £118,455, down 4% from last year. 75% of new universities spent at least £67,774 (down 9.5% on last year) and 25% spent more than £147,643 (down 5% on last year).
Other institutions
5 responses (2009: 5)
Range £17,839 to £1,273,900; median £63,025, down 8% on 2009; mean £401,573, down 4% from last year. 75% spent at least £29,093 (down 70% on last year) and 25% spent more than £943,327 (down 1.2% on last year).
The results indicate how the harsher financial climate is biting with varying severity across the three sectors. For old universities the results are still positive whereas for new universities and other types on institution all the indicators are downward.
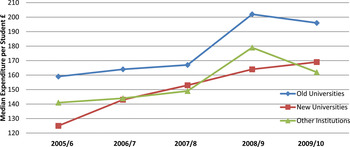
For each law student in a typical university (looking at the median) £176 was spent on law materials. This is nearly a 2% increase on the figure for 2009. However, the rate of increase has not been evenly distributed across the higher education sector. In an old university, median spend per student was £196 (2009: £202) but for a student in a new university the median was £169 (2009: £164), a gap between old and new universities of 16% (2009: 23%). In other types of institution the median spend per student was £162 (2009: £179). As graph 2 illustrates, the gap between old and new universities fluctuates over time but narrowed in 2009/2010 due to the fall in median expenditure in old universities and increase in the median for new universities. Per capita expenditure at other types of institution has declined considerably and fallen below that for new universities.
Library materials expenditure per student

Taking the mean, rather than the median, the pattern is of a widening gap between sectors. Mean law materials expenditure per student in old universities was £224, up 3% from 2009 whereas in new universities it was £190, an 8% decrease on 2009. In other types of institution the mean spend per student was £153 (2009: £181), indicating a steep decline over the last two years, but these results have been calculated over just five respondents.
15.2 Monograph expenditure
Eighty-four respondents provided details of spending on books, six fewer than last year. Some respondents had difficulty providing a discrete and accurate figure for law expenditure alone owing to the way the university or college budget is divided amongst subject areas.
Expenditure on monographs ranged from £2,291 to £303,400 (2009: £2,441 to £231,996), with a mean of £34,049, a fall of nearly 1% on 2009 and a median of £22,871, a fall of nearly 4% on last year.
In 2010, on average, monograph acquisitions accounted for 22% of total law material expenditure (2009: 22%; 2008: 24%). The proportion of total expenditure spent on books ranged from 6% to 59% with a median of 21% (2009: 4% to 59%, median 21%; 2008: 4% to 100%, median 22%).
Analysed by type of institution the figures for monograph expenditure were:
Old universities
43 respondents (2009: 44)
Range £7,998 to £101,004; median £30,000, almost the same as last year; mean £36,690 a fall of 4% on 2009. Mean of 23% of total law material expenditure (2009: 24%; 2008: 28%).
New universities
36 respondents (2009: 41)
Range £4,953 to £101,700; median £20,465, almost the same as last year; mean £23,773, down 5% on last year. Mean of 21% of total law material expenditure (2009: 20%; 2008: 21%).
Other institutions
5 institutions (2009: 5)
Range £2,291 to £303,400; median £14,288, a fall of 43%; mean £85,331, a rise of over 12% on last year. Mean of 20% of total law material expenditure (2009: 21%; 2008: 16%).
The figures for old and new universities show a fall in expenditure on monographs while other institutions recorded a rise. However, the percentage of total law expenditure devoted to monographs has moved only a percentage point either way in each of the three sectors.
15.3 Serials expenditure
Eighty-three of the 88 respondents who gave any financial figures were able to provide a figure for their spending on serials, down four on last year. The questionnaire defined serials as law journals, statutes, law reports and loose-leaf updates.
As a mean, serials accounted for 54% of total law materials expenditure, down on last year and at its lowest level ever (2009: 56%; 2008: 55%). The proportion of expenditure given to serials ranged from 13% to 85% (2009: 17% to 93%; 2008: 11% to 90%) with a median of 57% (2009: 55%; 2008: 55%). Overall, serials expenditure ranged from £3,000 to £817,000 (2009: £9,229 to £800,061), with a median of £72, 770 (2009: £64,749) and a mean of £97,095 (2009: £96,234), the median up 12.4%, and the mean up by under 1%. The rise in both indicators is far less than in 2009. The rise in the median is more than 4% less than in 2009 and the rise in the mean is more than 7% less.
Overall, whilst the actual amounts sent on serials have risen, the percentage of total law expenditure spent on these materials is slightly lower than in the last two years. However, when analysed by type of institution the results given below indicate a variable pattern:
Analysed by type of institution the figures were:
Old universities
42 responses (2009: 42)
Range £25,976 to £482,150; median £95,369, up 6.9% on last year, continuing the reversal of the downward trend established between 2004 and 2007; mean £107,816, up 4.3% continuing the rising trend established in 2007. Mean of 58% of total law material expenditure (2009: 57%; 2008: 54%).
New universities
36 responses (2009: 40)
Range £10,065 to £284,100; median £49,267, a fall of over 12% on last year, reversing the previous upward trend established in 2007; mean £65,215, a fall of 4.8% on last year. Mean of 51% of total law material expenditure (2009: 54%; 2008: 51%).
Other institutions
5 responses (2009: 5)
Range £3,000 to £817,000; median £38,426, a fall of over 30% on last year; mean £236,581, a fall of over 8% on last year. Mean of 43% of total law material expenditure (2009: 57%; 2008: 65%).
The indicators for old universities show rises in the actual sums spent on serials and in the proportion of the total budget spent on this type of material. New universities reduced the actual sums spent quite dramatically and the proportion of total budget spent on serials fell back to 2008 levels. All the results for other institutions are affected by the small number of institutions in the profile.
15.4 Database expenditure
Databases accounted for 25% of total law materials expenditure in the mean, ranging from 6% to 70% and with a median of 22% (2009: mean of 24%, median of 21%; 2008: mean of 23%, median of 20%). Of the 81 responses (2009: 85), expenditure ranged from £7,774 to £193,730 (2009: £9,705 to £180,623) with a median of £25,355 (2009: £25,126), a rise of under 1% on last year, and a mean of £37,037 (2009: £37,365), a fall of under 1% on last year, stalling the staggering upward trend recorded between 2008 and 2009.
Analysed by type of institution the figures were:
Old universities
40 respondents (2009: 39)
Range £10,300 to £138,000; median £30,000, a little over 1% up on last year; mean £36,944, nearly 6% down on last year. Median 21% and mean 21% of total law material expenditure (2009: 20% and 23%; 2008: 15% and 18% respectively).
New universities
36 respondents (2009: 41)
Range £7,774 to £81,793; median £23,081, down over 1% on 2009; mean £31,418, only a quarter percent more than last year. Median 24% and mean 27% of total law material expenditure (2009: 23% and 27%; 2008: 25% and 27%).
Other institutions
5 respondents (2009: 5)
Range £10,311 to £193,730; median £21,118, a rise of 40% on 2009; mean £78,242, a rise of 9% on last year. Median 32% and mean 37% of total law material expenditure (2009: 18% and 20%; 2008: 16% and 17%).
Spending on databases in both old and new universities has stabilised on last year's considerable increases.
Respondents were asked to distinguish, if possible, between expenditure on locally stored databases such as CD-ROMs and expenditure on remote, in effect web-based, databases.
15.4.1 Expenditure on web-based databases
For most institutions the figures for web database expenditure do not include broad-based electronic information such as ISI Web of Knowledge, newspaper databases or electronic journals which, although used by law staff and students, are usually funded outside the law budget for use by students across all subject disciplines.
Seventy-eight respondents (2009: 80) noted expenditure on web databases ranging from £7,774 to £193,730 (2009: £9,705 to £180,623), with a median of £24,665, up 3% on 2009, and a mean of £35,461, up 6% on last year. The dramatic rises recorded between 2008 and 2009 have not been repeated. Amongst respondents providing this detailed information, web databases accounted for a mean of 25% of law material expenditure and a median of 22%, (2009: 23% and 21%; 2008: 22% and 19%).
15.4.2 Expenditure on CD-ROM databases
Just 2 respondents (2009: 1) reported expenditure on CD-ROMs or other locally-stored databases. The sums were £272 and £2,266.
15.5 Other expenditure on law materials
Sixteen respondents noted “other” expenditure, five fewer than last year. Expenditure ranged from £22 to £57,020 (2009: £36 to £49,747), with a median of £2,326 (2009: £2,140), a 9% rise, and a mean of £6,153 (2009: £6,090) a rise of 1%. Six respondents spent the money on binding and eight on inter-library loans (two mentioned both). E-books were mentioned twice and digitisation of materials for Moodle once.
15.6 Expenditure by institutions not providing vocational or professional award courses
At the suggestion of one respondent we have carried out some analyses on expenditure by only those institutions which offer only an exempting law degree or LLM courses, that is, do not offer vocational courses, such as the LPC, BPTC or Diploma in Legal Practice (Scotland) or courses leading to professional awards, such as the CPE and ILEX. These institutions believe that vocational courses require the purchase of expensive practitioner materials and so the results given earlier in section 15 are inflated and make comparison with their situation very difficult. So, we have re-run the analyses for total expenditure and included the same calculations retrospectively on the data for 2008/2009 to provide some points of comparison.
Total expenditure on the acquisition of law materials ranged from £35,919 to £638,550 (2009: £34,097 to £632,450). Mean expenditure was £150,332 (2009: £142,856), a 5% increase on 2009.
It is helpful in understanding these changes to compare the expenditure in the different types of institution.
Old universities
30 respondents (2009: 27)
Range £35,919 to £638,550 (2009: £54,258 to £632,450); median £174,506 (2009: £146,248), a 19% increase on last year; mean £189,149 (2009: £180,752), 5% up on last year.
New universities
13 respondents (2009: 15)
Range £36,000 to £111,492 (2009: £34,097 to £130,127); median £66,157 (2009: £78,055), 15% lower than in 2009; mean £69,215 (2009: £77,474), 11% down on last year.
Other institutions
1 respondent (2009: 2)
Only one respondent was identified this year, with an expenditure of £40,348. The figures drawn from the 2008/2009 survey from two respondents are printed below for the first time.
Range (2009: £49,303 to £68,588); median (2009: £58,945); mean (2009: £58,945).
Comparing these results with those in paragraph 15.1 for all respondents in each of the three sectors, there is very little difference between the median and the mean for old universities, but a significant difference amongst new universities. The reason for the difference lay in the numbers of students at each institution – those new universities which do not offer vocational courses have significantly smaller numbers of students than those that do, hence a smaller expenditure on the acquisition of library materials.
16. Sources of income
Eighty-five (2009: 90) respondents gave details of the source of the funds from which law material expenditure was met.
The greatest proportion of acquisitions was funded from general library funds and all except seven institutions responding received at least part of their income this way. Using the mean, 88% of old universities', 90% of new universities' and 95% of other institutions' income for law library materials was from general library funds (86%, 86% and 82% last year). When the median is used the figures are 98%, 100%, 100% (2009: 90%, 99% and 88%). The increase in these percentages indicates an increased focus on general library funds as the source. As will be seen, fewer libraries in all categories obtained funds from outside this source.
Law schools contributed to funding the acquisition of law materials in 39 institutions (2009: 47). As has been noted in previous survey reports, a considerable number of law schools make no such contribution at all (55% this year, 47% in 2009). Fifty-six percent (2009: 59%) of old university law schools, 34% (2009: 44%) of new university law schools but not one (2009: 40%) of other institutions' schools contributed something. The fall in the number of new university and other institution law schools contributing is marked.
Of the law schools that contributed, the amount ranged from £1,000 to £220,066 (2009: £1,434 to £731,868). The median contribution was £26,237, a dramatic rise of nearly 46%, redressing considerable falls in 2008 and 2009. The mean was £48,897, down 8% on last year, continuing the downward trend at about the same rate as in 2008 and 2009.
For the libraries that received funds from the law school, these funds represented a mean of 29% of the total income for the purchase of law materials, with a median of 23% (27% and 17% last year). The percentage contributions by law schools based in old and new universities moved further apart this year. Of the old university law schools who contributed anything, the mean contribution represented 30% of the funds for library materials (2009: 23%), while new university law schools contributed 28% (2009: 28%). No ‘other’ institutions received funds from the law school (2009: 75%).
In old universities, median law school funding for law materials was £25,619, up a staggering 104% on last year. The mean was £51,442, up 26% on last year. In new universities the comparative figures were a median of £32,400, up 68% on last year and a mean of £43,805, up 16% on 2009.
Over half of all law schools make no contribution to funding the acquisition of law materials, a higher percentage than in past years. There was a considerable fall in the proportion of new university and other institution law schools making a contribution. But, taking the mean, those law schools which did contribute, gave considerably more than in the past. The pattern across the three sectors indicated that, unlike past years, old university law schools contributed the largest proportion to the law library budget, followed by new universities. The proportion contributed by new universities remained stable whilst nothing was contributed by law schools at the five ‘other’ types of institutions which responded to the survey.
Nine institutions (2009: 11) reported receiving income from other university budgets for law materials. For these five old universities and four new universities, the amount of income from these sources ranged from £2,500 to £171,850 (2009: £9,103 to £187,875).
One other type of institution reported funding from user charges (2009: 2). The sum was £10,200 (2009: £11,510 and £14,000).
Finally, six institutions (2009: 8) reported receiving financial contributions towards law materials from outside bodies. The sums ranged from £60 to £192,000 (2009: £714 to £218,800), with a median income of £6,125 (2009: £12,450) and a mean income of £40,256 (2009: £38,681). Of these, five were old universities, one was a new university.
16.1 Targeted funding from the law school
Two further questions sought to explore whether law schools paid for specific materials or services.
The first question asked respondents to indicate whether specific types of materials were paid for by the law school. 32 respondents (36%) replied in the positive (2009: 35, 38%). By far the most frequently mentioned was payment of or contributions towards the cost of electronic databases – 18 respondents (2009: 23). Seven respondents noted that the law school contributed towards the cost of law books, journals or reports (14 in 2009) ranging from research journals to multiple copies of textbooks. Library materials for the Legal Practice Course or Bar Vocational Course were mentioned specifically by eight respondents (6 in 2009).
In the second question in this section, respondents were asked to indicate whether the law school contributed to law library expenditure other than for the purchase of law materials. Twelve respondents (8 in 2009) received this additional funding. Eleven indicated the total amount of the contribution, ranging from £2,171 to £193,788 (2009: £150 to £46,047). Once again, the highest figure was at an old university where the Law School paid for staff salaries for a vocational library (£188,850). Other respondents received funding towards the cost of staff salaries ranging from £2,171 to £41,423. In addition, four received funding for other purposes: library staff training, provision of extra PCs, reducing the binding backlog, library refurbishment, copyright and security matters.
17. Staffing
The responses to the questions on staffing provide a picture of the number and qualifications of library staff in academic law libraries. The definition of law library staff provided in the questionnaire was the same as for the previous surveys. To be included in the survey, library staff were to spend 50% or more of their working time on the care and servicing of the law collection. Six (7%) of the 88 responding institutions had no staff which met this criterion (2009: 8 or 9%). Of these, 3 (2009: 3) were old universities and 3 (2009: 5) were new universities. The results reverse the worsening trend begun in 2007. In a number of instances respondents mentioned that law was just one of a number of subjects for which a team of librarians was responsible, but no one spent the requisite 50% or more of their time on law alone, or that their responsibilities were diversifying into library-wide activities.
For the 82 respondents (2009: 84) with staff who met the criterion, the full time equivalent (FTE) number of staff ranged from 0.4 to 24 (2009: 0.5 to 25.8) with a median of 1.0 (2009: 1.5) and a mean of 3.0 (2009: 3.3). Thirty-four percent (2009: 39%) had exactly one FTE member of law library staff.
As in previous surveys, old universities ranged most widely in the number of law library staff and 17% had four or more FTE (2009: 24%), continuing the declining trend in numbers over the last few years, compared to 9% of new universities (2009: 5%).
The median for old universities' FTE law library staffing was 2.0 (2009: 2.0) with a mean of 3.4 (2009: 3.9). The median for new universities was 1 (2009: 1) and the mean was 1.5 (2009: 1.6). The five other institutions were very varied in their staffing levels, from 1 to 21.5 FTE. Two of the five had over 20 staff.
The staffing picture portrays decline across all sectors.
Respondents were asked for the FTE number of staff in professional, clerical and other posts.
17.1 Professional posts
Of the 82 institutions which had staff with the care and servicing of the law collections as their sole or principal function, nine (5 old universities, 3 new universities and 1 other institution) did not have a professional post (2009: 13). Overall, then, of the 82 responding law libraries with staff who met the definition, 89% had a designated professional who could dedicate a significant proportion of their time to the needs of the law service (2009: 85%). This reverses the downward trend, noted from 2005 onwards.
The number of professional FTE posts ranged from 0.4 to 8.6 (2009: 0.5 to 8.9) but 56% of institutions (2009: 60%) with any professional posts had exactly one FTE.
In old universities, 22 of the 42 respondents had exactly 1 FTE, with 8 institutions with less than 1 FTE; 10 had more than one and the maximum was 8.60 FTE professional posts. The mean for old universities was 1.4 FTEs (2009: 1.5 FTEs). In contrast with the results for the results for last three years, there were two responding institutions without a professional person spending 50% or more of their time servicing the law collection and depending on a member of clerical staff with a LIS qualification. Overall, the results are of concern for they show a reduction in the level of professional staffing.
In new universities, 20 of the 35 respondents had exactly 1 FTE professional post, 12 had fewer and 3 had more, comprising 2 with 1.5 FTE and 1 with 2.0 FTE (2009: 3 with 2 FTE and 1 with 2.5 FTE). The mean for new universities was 0.93 (2009: 1.1 FTE). These results, like those for old universities indicate a decline in the level of professional staffing. In other institutions, one had no professional staff, one had exactly 1 FTE and two had more, to a maximum of 8.5 FTE (2009: 2 at 1 FTE, two with more, to a maximum of 15.9 FTE). Again, there appears to be a decrease in the levels of professional staffing.
17.2 Clerical posts
Turning to clerical posts, 46 institutions had clerical staff who met the definition given in section 17. Of the other 36 who had library staff but no clerical staff, 12 were old universities, 23 were new universities and 1 was an ‘other’ institution.
For those that did have clerical staffing, numbers ranged from 0.25 to 15.4 (2009: 0.25 to 16.40), with a median of 1.25 (2009: 1.50), continuing a downward trend. Seventy-one percent of old universities reported clerical staff for law as opposed to just 34% of new universities (2009: 67%, 29%). As found in past years, old universities typically had larger numbers of clerical staff. Seven of the 30 old universities with clerical staff had four or more such staff and the mean was 2.9 FTEs (2009: 3.5 FTEs), whereas of the 12 new universities with clerical staffing none (2009: 0) had four or more FTE. Two (2009: 2) of the four other institutions with clerical staff for law, had four or more FTE – they both have law libraries scattered across the regions of England.
In the past a partial explanation for the large difference between the presence of clerical staffing in old and new universities could be drawn from the location of the law library, but in 2010 this was not so marked. Of the 14 (2009: 19) institutions with more than 2 FTE clerical staff, only 5 (36%) had a law library located separately from other collections (2009: 79%). Two institutions (40%) were in old universities. Where there is a separate law library, staffing is less likely to be shared between subjects and circulation and other activities will be dedicated to the law collections. It is noteworthy however, that 24% of respondents who had a single law library in a separate location had professional staff but no clerical staffing or “other” staff dedicated to the law service (2009: 32%).
17.3 Staff employed in other posts
Five institutions (2009: 8) noted law library staff, other than clerical or professional staff, who met the criterion noted in section 17 above. Of these, 3 were old universities and 1 was new and one another type of institution. FTE numbers of such staff ranged from 0.5 to 1.0 (2009: 0.35 to 1.0). Their duties were specified by four respondents and included student/staff aides for evenings and weekends and an ICT technician.
17.4 Qualifications of staff
Respondents were asked to indicate how many of the staff whose principal function was the care of the law collections had a professional librarianship or information science (LIS) qualification or an academic or professional qualification in law.
Eighty-one respondents or 92% (2009: 81 or 90% of all respondents) had at least one member of staff who had a LIS qualification, although for 18 institutions this was less than one full-time member of staff (2009: 12). 43 (2009: 46) institutions had exactly one FTE member of staff with a LIS qualification and 5 (2009: 9) had three or more FTE staff with such a qualification, up to a maximum of 13.5 FTE (2009: 15.5 FTE). Of the seven institutions which did not have any law library staff with a LIS qualification, three were old universities and three new. No institutions had law library staff employed in a professional librarian post, without a LIS qualification.
Twenty two of the 88 respondents representing 25% of institutions (2009: 23%) had staff with an academic or professional qualification in law. This is a slight increase on last year and a return to the level seen in most years. Twelve (2009: 15) had at least one member of staff so qualified, and 12 (2009: 12) had exactly 1 FTE staff member with a law qualification. As found in past surveys, library staff with law qualifications were much more common in old universities. Looking at only those institutions which had any staff which met the criterion noted in section 17 above, in old universities 36% (2009: 35%) of law libraries had law qualified staff, compared to new universities where only 11% (2009: 10%) had law qualified staff. Two (2009: 1) of the five other institutions had such staff. Overall, 73% of the libraries with law qualified staff were in old universities, three percent lower than last year, a sharper fall than reported between 2008 and 2009.
18. The SLS Statement of Standards, 2009
Two new questions were added at the request of SLS to gauge how far law librarians were aware of the new Statement and whether they had had occasion to use it in discussions on funding and administration of the law collection in their institution. It is pleasing to record that 79 or 90% of respondents were aware of the revised Statement and as many as 48 (55%) had used the Statement in discussions.
19. The future
Since 2004 and every other year since, we asked for the personal views of respondents on the changes they envisage over the next five years to the provision of legal information within their library. We repeated the questions this year.
Eighty-eight (100%) of respondents (2008: 89 or 100%; 2006: 87 or 96%) gave their views on the balance of provision between electronic and paper access to legal information. 61% (2008: 51%; 2006: 41%) felt the move would be significantly in favour of electronic access. However, 36% (2008: 42%; 2006: 47%) considered that in the next five years in their library the balance would move only marginally in favour of electronic access. Just 2% (2008: 8%; 2006: 12%) felt the balance would remain constant. As in all previous surveys no respondents considered there would be a move away from electronic access.
Over the last four years respondent's views on the future have moved away from considering only a marginal move towards electronic provision possible, towards a majority considering a significant move towards electronic provision likely.
Looking at differences between the types of institution, 38% (2008: 40%) of old universities felt the move towards electronic would be marginal, whilst 37% (2008: 45%) of new universities and 20% (2008: 25%) of other types of institution also thought the move would be marginal. There was close agreement in the proportion of old and new universities who thought that the move towards electronic would be significant: 60% (2008: 49%) and 60% (2008: 50%) of respondents respectively. 80% (2008: 75%) of other types of institution thought the balance between paper and electronic sources would move significantly in favour of electronic. 2% (2008: 0%) of old universities and 3% (2008: 0%) of new universities thought the balance would remain constant but not one (2008: 0%) other type of institution thought the balance would remain constant.
Since 2004, when these questions were first posed, the views of the three sectors have become more closely aligned, and now a high percentage of respondents in all sectors consider library provision will move significantly in favour of electronic delivery.
Eighty-eight (100%) respondents provided their views on the balance of expenditure between monographs and serials. The results consolidate trends established in past years. Just 1% (2008: 7%) considered that the balance would move significantly in favour of serials, 31% (2008: 20%) felt the balance would move marginally in favour of serials, but the majority 53% (2008: 46%) considered the balance would remain constant. 15% (2008: 24%) thought the balance would move marginally in favour of monographs, but no respondents (2008: 2%) that the balance would move significantly in favour of monographs.
There was general agreement between respondents from the three types of institution, except that 36% of respondents from old universities considered that the proportion spent would move marginally in favour of serials, as opposed to only 26% in new universities and 20% in other types of institution. On the other hand, 46% of respondents from old universities thought the balance would remain constant as opposed to 61% of respondents from new universities and 60% at other types of institution.
Finally, 88 (100%) respondents provided their views on the changes over the next five years in the proportion spent in their library purchasing legal materials relating to the law of Great Britain and the European Union as compared with foreign and international law. The pattern is similar to that reported in the past two surveys. 7% (2008: 4%) considered the proportion would move significantly in favour of Great Britain and the EU, 9% (2008: 9%) considered the proportion would move marginally in favour of Great Britain and the EU. 69% (2008: 66%) considered the proportion would remain constant. Twelve percent (2008: 20%) thought the proportion would move marginally in favour of foreign and international law, and 2% (2008: 1%) considered the proportion would move significantly in favour of foreign and international law.
When analysed by type of institution there was considerable unanimity of response. Similar numbers (between 60% and 71%) believed that the balance would remain constant, but whilst 13% of old universities though the balance would move marginally in favour of foreign and international law, only 8% of new university respondents felt this way – possibly a reflection of the greater accent on foreign and international law in old university collections. Thirteen percent (2008: 7%) of old universities and 8% (2008: 13%) of new universities believed the balance would move marginally in favour of Great Britain and the EU.
Overall, there is considerable uniformity in responses on future trends across the three parts of the higher education sector.
Acknowledgements
I thought the survey conducted in 2010 would have been my last but, by the autumn of 2010 when planning for the survey commences, it was clear that there would not be staff in place at Cardiff University to take on the management role for 2011. So, I volunteered to undertake the survey for a further year. My job has been made easy by still having Jenny Smith, a library assistant at Cardiff University fill the important administrative role with her customary diligence and efficiency. The survey could not run without a person of this calibre in support.