I. INTRODUCTION
Over the last decades, ultrafine-grained (UFG) and nanocrystalline (NC) materials with grain sizes below 1 μm and 100 nm, respectively, have gained significant attention. These materials exhibit superior strength at room temperature and in some cases enhanced ductility for UFG material. This exceptional behavior is strongly related to their enhanced strain-rate sensitivity (SRS), compared to coarse-grained (CG) and single crystalline (SX) materials.Reference Gleiter1–Reference May, Höppel and Göken4
With conventional uniaxial macroscopic testing like compressionReference May, Höppel and Göken4–Reference Vevecka-Piftaj, Böhner, May, Höppel and Göken6 and tensile testing,Reference Dalla Torre, Van Swygenhoven and Victoria7–Reference Vehoff, Lemaire, Schüler, Waschkies and Yang9 the deformation resistance is studied on a macroscopic scale, averaging over many microstructural length scales and features. However, nanoindentation testing allows studying these effects on a local scale. Oliver and PharrReference Oliver and Pharr10 have already shown that nanoindentation is a feasible method for testing the local deformation resistance, i.e., hardness and Young’s modulus. Mayo and Nix Reference Mayo and Nix11 developed a nanoindentation method for the determination of SRS on a submicron level by controlling the loading rate. The indentation strain rate was determined from the depth–time data for a given range of indentation depth. Using this technique, they could show an enhanced SRS of NC ZnOReference Mayo, Siegel, Narayanasamy and Nix12 and NC-TiO2.Reference Mayo, Siegel, Liao and Nix13 A more general theoretical work on dynamic nanoindentation was given by Bower et al.,Reference Bower, Fleck, Needleman and Ogbonna14 who used finite element modeling (FEM) to describe indentations in power law creeping solids. They showed that Mulhearn and Tabor’sReference Mulhearn and Tabor15 concept on effective stress and effective strain rate generally applies to power law creeping solids. In 1999, Lucas and OliverReference Lucas and Oliver16 proposed a new method using a  technique for controlling the indentation strain rate during indentation experiments and found a good agreement with uniaxial test data. In this work, strain-rate jumps were already performed for showing a path-independent indentation steady-state hardness.
Alkorta et al.Reference Alkorta, Martinez-Esnaola and Sevillano17 also used an indentation strain-rate jump technique to examine the SRS in UFG niobium. They compared nanoindentation creep experiments with nanoindentation jump experiments for different strain-rate levels. They found a strong influence of thermal drift during creep experiments and showed that a strain-rate jump technique is more useful for determining SRS and for minimizing these influences.
So far, no quantitative comparison between the SRS measured by macroscopical methods and nanoindentation techniques has been carried out. In this work, nanoindentation tests were performed using a newly developed nanoindentation method with implemented strain-rate jumps and a conventional constant strain-rate nanoindentation technique for measuring the SRS of NC-Ni. To understand the differences between the two nanoindentation approaches, compression tests and FEM simulations were accomplished. The finite element (FE) simulations were used for analyzing the SRS in indentation experiments, using the experimentally determined SRS as input in the simulations.
Finally, the developed nanoindentation strain-rate jump technique was applied on accumulative roll-bonded Al to investigate local differences in the mechanical properties and the SRS.
II. STRAIN-RATE SENSITIVITY MEASUREMENTS
The SRS in uniaxial tensile or compression testing is defined as the change in stress σ divided by the change in strain rate  at constant temperature using the following equationReference Hart18:
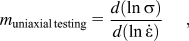
where m is the SRS exponent, which describes the SRS behavior of the material assuming a constant microstructure. This m-value can be determined by using either strain-rate jump tests during a single macroscopic test or experiments with several tests at different strain rates.
For nanoindentation SRS measurements, different approaches and types of tests are discussed in literature. Mayo and NixReference Mayo and Nix11 used tests with constant loading rate to determine a stress exponent. Hence, the SRS can be deduced:

According to Mayo and Nix,Reference Mayo and Nix11 the indentation strain rate can be derived from the concept of true strain. Approximating the specimen length by the indentation depth and assuming the hardness to be independent of the indentation depth, this can be estimated asReference Lucas and Oliver16:
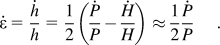
Moreover, the SRS can also be written as:
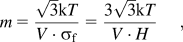
where k is the Boltzmann constant, T is the absolute temperature, σ f is the flow stress, H is the hardness, and V is the activation volume for the plastic deformation, which is directly related to the deformation mechanism.Reference Lu, Schwaiger, Shan, Dao, Lu and Suresh19 Thereby, the hardness H is related to the flow stress using a constraint factor of 3.
It is well known that the hardness of most metallic materials exhibits a strong indentation size effect and the hardness increases for small indentation depths. The Nix/Gao modelReference Nix and Gao20 related the indentation size effect to geometrically necessary dislocations, the density of which is proportional to the inverse indentation depth. It has been found that this size effect is strongly reduced in UFG and NC materials due to a smaller internal length scale, which is strongly related to an increasing dislocation density in the materials and to the higher flow stress.Reference Durst, Backes and Göken21–Reference Mirshams and Parakala23 For indentation depths greater than 100 nm, this leads to a nearly depth-independent hardness in indentation experiments. Thus NC materials are well suited for comparing macroscopic and local SRS measurements, and it is expected that both methods should lead to similar results.
III. EXPERIMENTAL
A. Materials and sample preparation
Plates of NC-Ni were produced by pulsed electrodeposition according to Li et al.Reference Li, Mueller, Höppel, Göken and Blum5 and Natter and Hempelmann.Reference Natter and Hempelmann24 Using this technique, samples with a thickness of 2 mm and a width of several centimeters were produced with a grain size of down to 25 nm. The grain size can be controlled by the pulse parameters, bath additives, and bath temperature.
Commercially pure Al (AA1050A) sheets with UFG microstructure were produced by the accumulative roll bonding (ARB) process. Further details on the ARB process and the materials properties can be found in Höppel et al.Reference Höppel, May and Göken8 and Böhner et al.Reference Böhner, Maier, Durst, Höppel and Göken25
NC-Ni and UFG-Al cross sections were prepared for metallographic and nanoindentation examinations. The specimens were mounted in Technovit 4071 (Technovit, Heraeus-Kulzer, Germany) and acrylic resin Technovit 2000 LC, respectively, ground, polished with diamond down to 1 μm, and electrolytically polished.
B. Nanoindentation experiments
The nanoindentation experiments were performed on a Nanoindenter G200 (Agilent Technologies, Chandler, AZ), using a three-sided Berkovich diamond and the continuous stiffness method (CSM). Tip shape calibration was performed according to the Oliver–PharrReference Oliver and Pharr10 method and then the machine compliance was taken into account. Using a standard CSM method, the indentation stiffness is determined continuously and the reduced modulus and indentation hardness is obtained as a function of the indentation depth. According to Durst et al.Reference Durst, Franke, Böhner and Göken26 and Pharr et al.,Reference Pharr, Strader and Oliver27 the CSM technique can lead to a significant error in the indentation data for soft metallic materials like single crystals with a large E/H ratio. This error is directly related to the dynamic unloading of the tip and influences moreover the measured force, displacement, and stiffness data. Therefore, Pharr suggested a correction for load and displacement which considers the harmonic load and harmonic displacement in the load– displacement data. This correction has been used in the current approach. Furthermore, the studied materials have a relatively small E/H ratio (NC-Ni ∼40, UFG-Al ∼115) and are not prone to this effect.
C. Nanoindentation strain-rate jump tests
A nanoindentation testing technique was developed, where a standard CSM method was adapted to perform several abrupt changes in the applied strain rate at defined indentation depths during one single indentation, so called strain-rate jumps.
The applied indentation strain rate  is directly associated with the effective strain rate
 according to Eq. (3). In this article, all analyses are based on the effective strain rate
 .
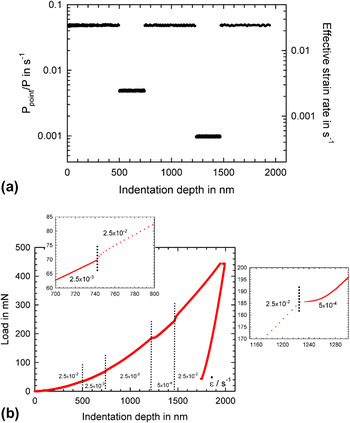
For performing these experiments on NC-Ni, the indentation strain rate was kept constant up to an indentation depth of ∼500 nm until the hardness stayed constant and was independent of the indentation depth. Afterward, changes in the strain rate were applied every 250 nm. Three different strain rates were used during a single indentation experiment. The hardness at different strain rates was determined at a particular indentation-depth range between 200 and 250 nm. Figure 1(a) shows the applied indentation strain rate  and the corresponding effective strain rate
 during the nanoindentation experiment. After each jump of the effective strain rate, the new strain rate is reached very fast and no transients are found in the strain rate. The total indentation time adds up to around 660 s, even though strain rates down to 5 × 10⁻⁴ s−1 are used.
Nanoindentation strain-rate jump experiment with three different applied strain rates: (a) applied indentation strain rate  and corresponding
 and (b) corresponding load–displacement curve of nanocrystalline (NC) Ni.

Figure 1(b) shows the corresponding load–displacement curve for an exemplary nanoindentation strain-rate jump experiment. Upon a change in the indentation strain rate, the indentation load is observed to go through a short transient period.Reference Lucas and Oliver16 After an additional displacement of ∼50 nm, the load-displacement behavior becomes self-similar again. The transition region is strongly related to the time-dependent behavior of the tested material. Thus, for positive strain-rate-sensitive materials, a jump to a higher strain rate leads to an upward kink, whereas a jump to a lower strain rate is related to a downward kink in the load–displacement curve as shown in Fig. 1(b).
Moreover, the samples were conventionally tested using a standard CSM method for determining the SRS from nanoindentation experiments.Reference Mueller, Durst, Amberger and Göken28 The indentation depth was set to 2000 nm, and several indentation strain rates (5 × 10⁻² –5 × 10⁻⁴ s−1) were applied. The hardness at each strain rate was averaged over at least six indentations at indentation depths between 1.0 and 1.9 μm.
IV. NANOINDENTATION
A. Nanoindentation strain-rate jump results
Figure 2 shows the resulting hardness and Young’s modulus data from a strain-rate jump test. It is found that the hardness of NC-Ni clearly changes with the strain rate, whereas the hardness is smaller at lower indentation strain rates. A short transient behavior as found in the corresponding load-displacement plot is also found for the resulting hardness-indentation depth curves.
Resulting hardness and Young’s modulus of NC Ni in a nanoindentation strain-rate jump experiment with reversible strain-rate jumps.

Upon contact, the hardness initially increases strongly and remains constant at 5.4 GPa after an indentation depth of around 200 nm. Decreasing the strain rate from the initial value of 2.5 × 10⁻² s−1 to 2.5 × 10⁻³ s−1, the hardness drops down to a value of 5.2 GPa. By increasing the strain rate back to the initial value, the initial hardness plateau is reached again. After strongly decreasing the strain rate to a value of 5 × 10⁻⁴ s−1, a transient behavior in hardness is observed for a displacement of nearly 150 nm, until a steady-state condition is reached again and the hardness stays constant. The Young’s modulus as a function of indentation depth is quite constant over the whole experiment with an average value of 210 GPa. During strain-rate jumps, the Young’s modulus data scatter slightly; however, the average value remains unaffected by the strain-rate changes.
The resulting hardness runs in a plateau value and is independent of the indentation depth, as an indentation size effect can be neglected for this NC material.Reference Durst, Backes and Göken21–Reference Mirshams and Parakala23 Using x-ray diffraction, the initial grain size of the used NC Ni was determined by Li et al.Reference Li, Mueller, Höppel, Göken and Blum5 as d 0X = 25 nm. Hence, a constant microstructure can be assumed underneath the indenter tip at displacements of more than 500 nm.
B. Constant indentation strain-rate experiments
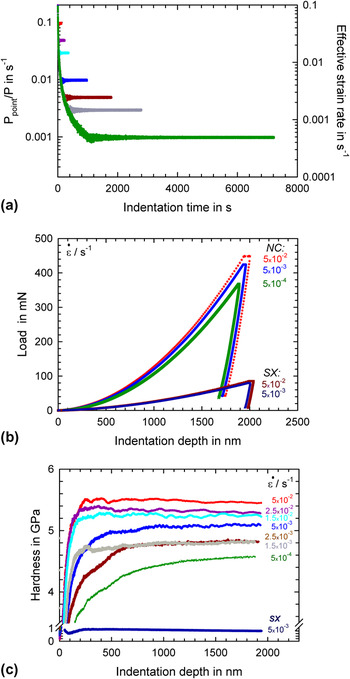
During testing, the loading time varied greatly for the different strain rates [Fig. 3(a)], ranging from about 125 s (strain rate 5 × 10⁻² s−1) up to 7000 s for the lowest strain rate (5 × 10⁻⁴ s−1). For longer testing periods, at a strain rate of 2.5 × 10⁻³ s−1 and lower, thermal drift might play an important role. At an allowable maximum drift rate of 0.05 nm s−1, a total drift of 350 nm might easily occur. This is in strong contrast to the strain-rate jump technique, which only requires one test with duration of 660 s for testing the material at the same strain-rate levels.
Constant strain-rate nanoindentation experiments on NC Ni: (a) indentation strain rate as a function of indentation time, (b) corresponding load–displacement curves ( = 5 × 10⁻² s−1, 5 × 10⁻³ s−1 and 5 × 10⁻⁴ s−1) and of single crystalline (SX) Ni (
 = 5 × 10⁻² s−1 and 5 × 10⁻³ s−1), and (c) resulting hardness. The same color code is used for Figs. 3 and 4.

Figure 3(b) exemplarily shows the load–displacement curves for NC and SX Ni at different applied strain rates. The maximum indentation depth was set constant at 2000 nm and the maximum load accordingly depends on the strain rate.
In Fig. 3(c), the resulting hardness is plotted versus the indentation depth determined continuously during each indentation experiment. The hardness values at indentation strain rates from 5 × 10⁻² to 2.5 × 10⁻³ s−1 are nearly constant at an indentation depth of more than 500 nm. Measurements with slow indentation strain rates of <1.5 × 10⁻³ s−1 show a continuously increasing hardness with increasing indentation depth. Generally, the hardness decreases, as expected, with decreasing strain rate. The resulting hardness values for NC Ni average between 5.4 and 4.7 GPa at an indentation strain rate of 5 × 10⁻² and 1.5 × 10⁻³ s−1, respectively. This maximum hardness corresponds very well to the hardness determined from the strain-rate jump experiments.
For SX Ni, a much lower strength is observed and a depth dependence of the hardness is obvious. However, these materials have a negligible SRS.
C. Comparison of SRS as measured by conventional and strain-rate jump tests
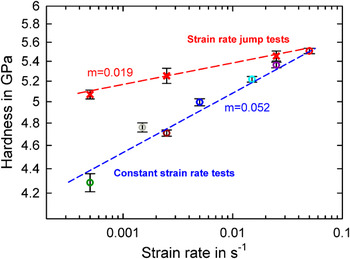
The evaluation of the SRS data for the nanoindentation experiments is shown in Fig. 4. According to Eq. (2), the strain rate exponent m is obtained from the slope of the ln (H)/ln ( ) curve, if the microstructure stays constant. Each hardness value has been obtained by averaging over at least six indentations for the conventional testing procedure and nine indentations for the nanoindentation strain-rate jump test. The measured standard deviation is quite small during conventional tests and indentation jump tests. For high strain-rate indentations (2.5 × 10⁻² s−1), the assessed hardness values are in good accordance with each other. Small differences can be explained with the different depth region during indentation. The differences increase with decreasing strain rates. At a strain rate of 5 × 10⁻⁴ s−1 the estimated hardness value differs by ∼0.8 GPa.

For the conventional testing procedure, an m-value of 0.052 was determined. From the indentation strain-rate jump tests (Fig. 2), a smaller m-value of 0.019 was obtained.
V. COMPRESSION TESTS
The microstructure and the macroscopic deformation behavior during uniaxial strain-rate jump compression tests of similar NC Ni was intensively investigated in 2007 by Li et al.Reference Li, Mueller, Höppel, Göken and Blum5 and Blum and Li.Reference Blum and Li29 These macroscopic compression tests are used as a reference for the materials properties and allow discussing the discrepancies between nanoindentation strain-rate jump tests and constant strain-rate testing.
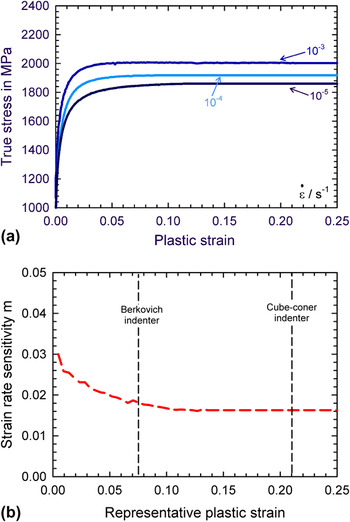
The flow behavior of the material was determined using compression tests with a fixed strain rate. The true stress–plastic strain data is shown in Fig. 5(a). After a plastic strain of about 5%, the material reaches a steady state. The steady-state stress depends on the strain rate, where a higher stress level was found for a higher strain rate. Figure 5(b) represents the SRS exponent m determined at different plastic strains. At small plastic strains, a higher m-value was found, which decreases to m = 0.016 at a plastic strain of 10% for steady-state deformation. For comparing indentation tests with uniaxial tests, Tabor and AtkinsReference Atkins and Tabor30 introduced representative indentation strain, which depends on the indenter shape, especially the opening angle. A Berkovich indenter thus induces a representative strain of around 8%, whereas the representative strain of a cube-corner shaped indenter is about 22%.
(a) Flow behavior of NC Ni determined by constant strain-rate compression experiments and (b) corresponding m-values over representative plastic strains.

This concept is studied in FEM indentations using the stress–strain data as input in the simulation to find out if the indenter shape may influence the measurements of the SRS.
VI. FINITE ELEMENT MODELING
A. FEM setup
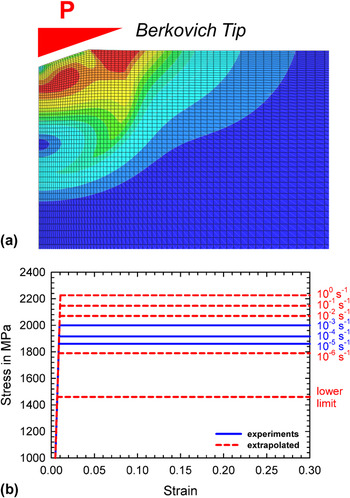
FE simulations have been carried out using the commercial software package ABAQUS 6.5 to clarify the different results obtained for local tests of the SRS. A two-dimensional axis-symmetrical model was used to describe the indentation process. The indenter was modeled as an analytic rigid indenter, and a friction coefficient of 0.2 was assumed between the indenter and the sample. The sample was approximated with 5479 linear elements. In the contact region of the indenter, 4225 linear rectangle elements (CAX) were used for more numerical accuracy, whereas the rest of the sample was described by 1254 triangle elements (CAX3). Figure 6(a) illustrates the deformed mesh in the contact region after unloading. A Young’s modulus of 210 GPa and Poisson’s ratio ν of 0.3 were assumed for the indented material. A J 2 yield criterion was used to model the plasticity of the material. More details on the FE model can be found in Backes et al.Reference Backes, Huang, Göken and Durst31
(a) Magnification of the contact region of the finite element mesh after the indentation simulation and (b) elastic and plastic material properties used in the finite element modeling analysis.

Figure 6(b) shows the stress–strain data, which were used as input data for the simulation of the nanoindentation experiment. An ideal plastic deformation behavior was assumed to describe the steady-state deformation behavior. To model the SRS behavior, different yield stress levels were used in the FE simulations, as has been measured by compression tests. Since the measurements could only be performed at strain rates between 10−3 and 10−5 s−1, the data have been extrapolated to higher and lower strain rates, as indicated in Fig. 6(b) by dashed lines.
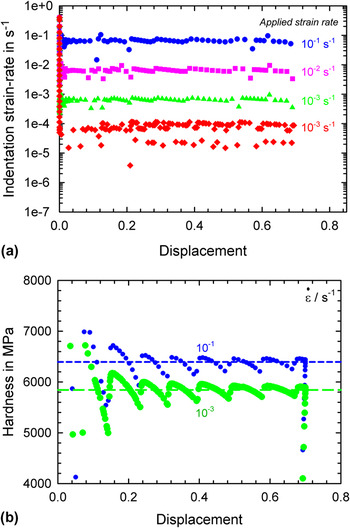
A displacement control setup was used to perform the simulations. To introduce a constant strain rate in the FE simulation, Eq. (3) was solved and the resultant exponential function was approximated by 16 linear segments. These segments describe the relation of the penetration depth and the time using the amplitude method in ABAQUS to obtain several constant strain rates. Figure 7(a) presents the resulting indentation strain rates  , shown as a function of the displacement of the indenter into the surface for different simulations. The indentation strain rate remains fairly constant throughout the simulated indentation tests, where numerical instabilities only lead to some scatter in the strain rate.
Example of a simulation of a nanoindentation data. (a) Indentation strain rate [Eq. (3)] as a function of displacement for different applied strain rates (b) Hardness of a strain–rate sensitivity material for different applied strain rates. The data show the hardness values H FEM, as calculated from the true contact area and applied load.

The contact area is calculated from the distance between the symmetry axis and the last node in contact with the indenter. Therefore, the discretization of the sample leads to a scatter in the contact area because with each time increment the force increases but the last node in contact does not necessarily change and the contact area remains constant in this case. The scatter in the contact area leads to a scatter in the hardness as well, as it is shown in Fig. 7(b). The hardness was therefore calculated using firstly the Oliver–PharrReference Oliver and Pharr10 method on the calculated load–displacement curves. Secondly the hardness H FEM is directly calculated from the maximum force and the contact area at the end of the loading step.
B. FEM results: Effect of indenter angle and pile-up on hardness and SRS
Figure 8 shows the resulting hardness as a function of the strain rate for a Berkovich and a cube-corner indenter. Since an ideally elastic/plastic material has been assumed, the FEM hardness for Berkovich and cube-corner indentations are about the same. The evaluation of the slope of the hardness strain rate data leads to a nearly similar m-value ranging from 0.014 to 0.02. This value is very close to the input data, regardless of the used evaluation method for the hardness. Berkovich and cube-corner indenter give more or less the same result for the SRS.
Evaluation of the SRS for an ideally plastic material for a Berkovich and cube-corner indentation tip.

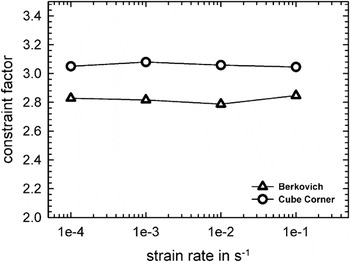
For understanding the observed SRS and hardness, the constraint factor as a function of strain rate and indenter angle is evaluated. According to Atkins and Tabor,Reference Atkins and Tabor30 the constraint factor relates the hardness to the uniaxial stress of a material. For a strain-rate sensitivity material, the constraint factor could depend on the strain rate, thus leading to a different behavior of the material in indentation testing compared to uniaxial testing. Dividing the hardness at a given indentation strain rate and indenter angle by the corresponding yield stress leads to the constraint factor (Fig. 9). There it is found that the constraint factor is constant for a given indenter opening angle, regardless of the strain rate. The slightly higher constraint factor for smaller indenter opening angles might be related to the used friction coefficient of 0.2 in the simulations.
Constraint factors simulated for different indenter geometries.

Briefly summing up the data analysis from this simple FE approach, it can be stated that for the assumed simple material with E/H ∼40, the FE analysis of the nanoindentation simulations leads to the same m-values, which are used as the input data for the calculations.
That means no differences are expected between nanoindentation test with a Berkovich or cube-corner indenter compared to compression or tensile test on bulk samples.
VII. DISCUSSION
A. Correlation between nanoindentation, compression test, and simulation results
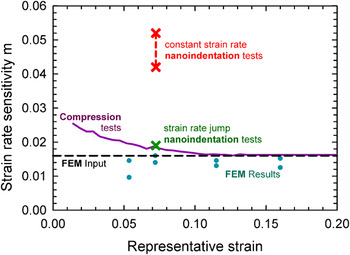
Generally, it was found that FEM simulations of nanoindentation experiments with input data from uniaxial compression tests lead to consistent results (Fig. 10), although some discrepancies between the simulated and the constant strain-rate nanoindentation results are obvious. However, the SRS as measured with the new nanoindentation strain-rate jump tests shows a good agreement with macroscopic compression tests and the FEM simulations.
SRS values for compression tests and for experimental as well as simulated nanoindentations.

The conventional constant strain-rate nanoindentation experiments exhibit significantly higher SRS than the results obtained by using the nanoindentation strain-rate jump test (Fig. 10). As it has been shown in the FEM simulations, these differences are not an effect of the complex stress state during the nanoindentation experiment, but must be due to some experimental effects.
During the conventional strain-rate test, it is quite obvious that the hardness values are not constant, specifically at low rates and indentation depths. The hardness is initially quite low and then approaches a more or less constant value at depths >1000 nm. This behavior is quite different from the strain-rate jump test, where the hardness at small strain rates is relatively constant. Reasons for the increasing hardness with indentation depth, specifically at small indentation depths and slow rate, must be found in the testing method. Figure 3(a) shows the  values for the different strain rates as a function of testing time. For slow rates, the indenter requires rather large depths and long times for achieving a constant strain-rate level. The resultant loading rates increase rather slowly, which leads to applied loading rates <2 μN s−1, for more than 30 min of indentation time. The contact depth during this testing period is smaller than 100 nm, and the exact determination of the contact area might be affected by thermal drift, even leading to inaccurate hardness values at larger indentation depths. These effects might explain the discrepancy between constant strain rate and strain-rate jump tests.
The strain-rate jump tests were designed in such a way that during initial contact, a large strain rate and thus a short testing time is used. The slow strain rates are only performed at larger indentation depths, where the applied loading rate is rather high ( = constant) and only a short testing time is needed for achieving a steady-state hardness value. Moreover, the determination of the m-value is based on a single indent. Therefore, the same microstructure is tested at different strain rates. This allows a very local determination of the SRS. The determined value is almost unaffected by microstructural changes, thermal drift influences, and further influences of long testing times due to low strain rates.
Overall, nanoindentation strain-rate jump tests lead to more accurate data. This is shown in good agreement between compression, simulation, and nanoindentation strain-rate jump test results.
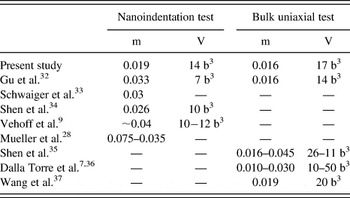
Table I gives a detailed overview of our results for NC Ni and literature data. An SRS exponent m of 0.016 found in this work in compression tests at room temperature corresponds well with other m-values determined from uniaxial macroscopic testing. Using tensile testing, Gu et al.Reference Gu, Lian, Jiang and Zheng32 and Wang et al.Reference Wang, Hamza and Ma37 obtained m-values of 0.016 and 0.019, respectively, Dalla Torre et al.Reference Dalla Torre, Van Swygenhoven and Victoria7, Reference Dalla Torre, Spätig, Schäublin and Victoria36 found an SRS exponent m between 0.01 and 0.030. For SX-Ni, an m-value around 0.001 was found, which is in good accordance to results found in literature.Reference Dalla Torre, Van Swygenhoven and Victoria7, Reference Gu, Lian, Jiang and Zheng32
Strain-rate sensitivity m and activation volume V obtained by nanoindentation and bulk uniaxial tensile or compression tests, respectively, for nanocrystalline Ni in this study and in literature.

The m-value determined by nanoindentation as reported in literature is generally higher. Gu et al.Reference Gu, Lian, Jiang and Zheng32 and Schwaiger et al.Reference Schwaiger, Moser, Dao, Chollacoop and Suresh33 found m-values around 0.03, and Mueller et al.Reference Mueller, Durst, Amberger and Göken28 found m-values between 0.035 and 0.075. These values are in good accordance to the values found in conventional nanoindentation experiments. The m-value measured from the jump tests is significantly smaller and in the range of the macroscopic m-values. However, it is to mention that the indentation methods used in literature strongly differ due to different strain-rate controlling techniques and indentation systems. Gu et al.Reference Gu, Lian, Jiang and Zheng32 and Mueller et al.Reference Mueller, Durst, Amberger and Göken28 use a CSM technique with constant indentation strain rates, whereas Schwaiger et al.Reference Schwaiger, Moser, Dao, Chollacoop and Suresh33 use a technique by varying the loading rates.
The activation volume has also been evaluated according to Eq. (4). The apparent activation volume implies that all variables except the strength remain constant. Therefore, especially the microstructure has a strong impact on the activation volume and is considered useful in the indication of dislocation mechanisms controlling deformation.Reference Li, Mueller, Höppel, Göken and Blum5, Reference Höppel, May, Eisenlohr and Göken38 For conventional nanoindentation testing, the activation volume V was estimated from a linear fit in the plot of ln( )/H to be around 5·b 3 (with b = 0.248 nm: length of the Burgersvector for Ni). In nanoindentation strain-rate jump tests, V averages at around 14 b 3. An increasing activation volume for strain-rate jump tests compared to conventional results can be directly correlated to the decrease of the m-value according to Eq. (4). These results fit well with the literature where values around 10 b 3 are given for NC materials, whereas conventional grain-sized metals exhibit activation volumes around 100–1000 b 3.Reference Gu, Lian, Jiang and Zheng32 Large activation volumes are associated with dislocations cutting through forest dislocations.Reference Meyers, Misha and Benson39 Those mechanisms related with low activation volumes in NC materials are explained to be associated to thermally activated diffusion processes at grain boundaries.Reference Li, Mueller, Höppel, Göken and Blum5, Reference Höppel, May, Eisenlohr and Göken38
B. Application of the methodology: local SRS around a bondlayer in an ARB sheet
Local SRS around a bond layer in an ARB sheet
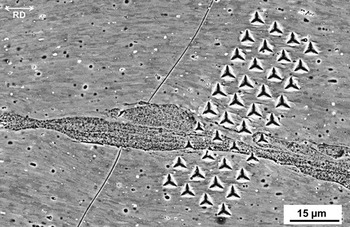
The methodology of nanoindentation strain-rate jump tests allows the investigation of the SRS of microstructural inhomogeneity in very small volumes. In this work, an ARB Al sheet has been studied close to a bonded interface. Figure 11 shows a clearly finer grained, inhomogeneous region around a bond layer after eight ARB cycles.
Scanning electron microscopy image of an inhomogeneous area near a bond layer in an ultrafine-grained (UFG) AA1050A sheet after accumulative roll bonding process up to eight cycles (RD: rolling direction) and a load controlled nanoindentation array.

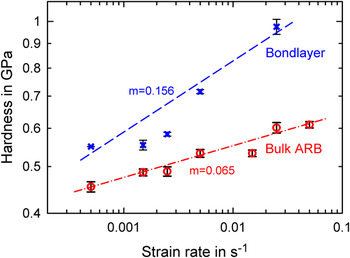
For determining the local SRS close to this bond layer, the nanoindentation strain-rate jump method was used. The indentation depth was set to 4000 nm and was positioned close to the inhomogeneous zone. Figure 12 shows the corresponding strain–rate-dependent hardness values in this bond layer and in the homogeneous bulk material of the ARB sheet.
Hardness and SRS for the bond layer and homogenous bulk material (UFG-Al) measured by nanoindentation strain-rate jump tests.

Comparing the m-values, an enhanced SRS near the bond layer was found. Although an m-value of 0.065 was obtained for the bulk ARB Al, the bond layer has an SRS exponent of 0.156 (Fig. 12). The estimated nanoindentation m-value for bulk ARB Al is in good accordance to values in literature from Schweitzer et al.Reference Schweitzer, Durst, Amberger, Göken, Anderson, Foecke, Misra and Rudd40 and Böhner et al.,Reference Böhner, Maier, Durst, Höppel and Göken25 who found an m-value around 0.07 in UFG samples.
The enhanced SRS at the bond layer can be explained with microstructural changes close to the interface. Lee et al.Reference Lee, Saito, Sakai and Utsunomiya41 found changes in Vickers hardness through the thickness of a specimen before and after ARB cycle. These changes in the material properties near the surface and the higher hardness values are caused by work hardening due to large shear strain introduced by high friction during ARB.Reference Lee, Saito, Tsuji, Utsunomiya and Sakai42 This has an effect on the hardness in the center and near the bond layer due to the procedure of the ARB process because the surfaces are put in the middle of the specimen in the next cycle. Moreover, the high hardness values in the center of the specimens are also caused by the special precycle surface treatment wire brushing, which leads to the formation of a complex microstructure consisting of UFG and NC grains. The higher hardness and smaller grain sizes are directly related to the enhanced SRS.
VIII. CONCLUSIONS
In this work, the SRS of NC-Ni was determined by a newly developed nanoindentation strain-rate jump test method. Abrupt strain-rate changes were implemented in a single indentation experiment, and the resulting hardness was evaluated. It was shown that the resulting m-values from nanoindentation jump experiments are in good agreement with values determined by macroscopic compression tests. However, the SRS obtained conventionally by using constant strain-rate indentation experiments leads to significantly higher m-values.
The FEM simulations showed that no difference should be expected between indentation experiments and compression tests on bulk samples. Also the indenter angle, that means testing with a Berkovich or cube-corner indenter, should only have a negligible influence.
It needs to be considered that for the slow constant strain-rate experiments rather long testing times (up to 7000 s) are required to achieve a constant hardness value. These long testing times are probably the major reason for the found discrepancy. For the strain-rate jump tests, however, the indentation is initially performed at large strain rates. The slow strain rates are only performed at larger indentation depths, where the applied loading rate is rather high and only a short testing time is needed to achieve a steady-state hardness value. Moreover, the determination of the m-value is based on a single indent and the same microstructure is tested at different strain rates.
The new method also allows the determination of the SRS of very small volumes. This was shown by means of indentations near a bond layer in an ARB-produced Al sheet. By assessing the local m-value near the bond layer and by comparing this to bulk values, an enhanced SRS and thus a reduced activation volume near the bond layer was found.
ACKNOWLEDGMENTS
The authors gratefully acknowledge the funding of the German Research Council, which, within the framework of its “Excellence Initiative” supports the Cluster of Excellence “Engineering of Advanced Materials” at the University of Erlangen-Nuernberg and the support of “Galvano 21” by the Bayerische Forschungsstiftung.